I noticed that the `compute_Hc` result for some time series is less than 0 or greater than 1. Is this behavior intended?
MWE to reproduce this bug:
```
import hurst
import numpy as np
print("numpy", np.__version__)
print("hurst", hurst.__version__)
print()
np.random.seed(988)
H, _, _ = hurst.compute_Hc(np.random.uniform(size=100), kind="random_walk", simplified=True)
print(H) # -0.017687382184009826
np.random.seed(916)
H, _, _ = hurst.compute_Hc(np.random.uniform(size=100), kind="random_walk", simplified=False)
print(H) # -0.011722357538317393
np.random.seed(164)
H, _, _ = hurst.compute_Hc(np.random.exponential(1, size=100), kind="change", simplified=True)
print(H) # 1.0118591069505447
```
Hi,
`np.random.uniform` doesn't produce random walk and it also doesn't produce changes since `np.random.uniform` by default generates values in [0, 1) range but changes should contain both positives and negatives ones.
For the same reason you can't use `np.random.exponential` since it generates only positive values.
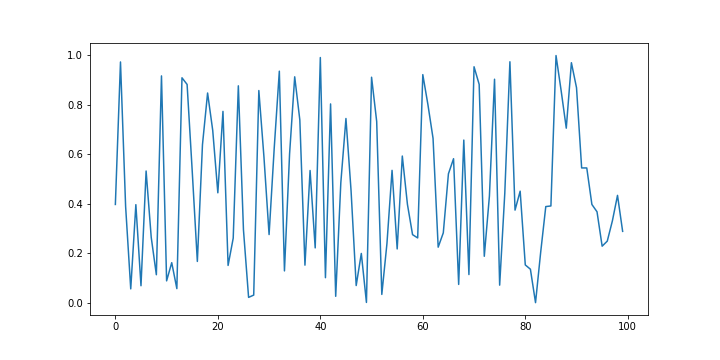
Okay, so I do understand that change can only be used with series that also contain negative values, right? However, I am still confused by the random walk kind. What assumption exactly must hold for a time series to be able to calculate the hurst exponent?
In other words, why would the following not be considered a random walk?
```
np.random.seed(988)
plt.plot(np.random.uniform(size=100))
```
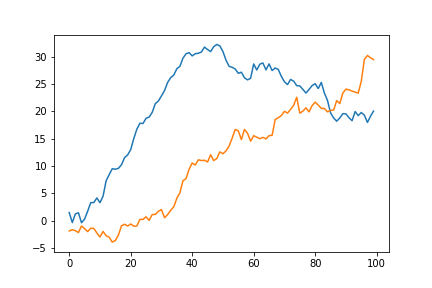
Okay, so here are two random walks that are out of range. Maybe this is due to some numerical problems?
```
np.random.seed(26240)
x1 = np.cumsum(np.random.randn(100))
np.random.seed(81984)
x2 = np.cumsum(np.random.randn(100))
H1, _, _ = hurst.compute_Hc(x1, kind="random_walk", simplified=False)
H2, _, _ = hurst.compute_Hc(x2, kind="random_walk", simplified=True)
print(H1) # 1.018265313908482
print(H2) # 1.008202895027869
```
_H_ is just a slope of a linear regression. The more time-series observations you have the longer interval _n_ you have and eventually the better estimate of _H_ you can get:
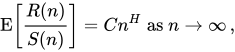
Whether you want to clip _H_ to (0, 1) range or not depends on your task.
If you doubt the correctness of the calculations you can check https://en.wikipedia.org/wiki/Hurst_exponent#Rescaled_range_(R/S)_analysis and compare with the actual Python code.