Packages used:
| S No. | Name |
|---|---|
| 1 | selenium |
| 2 | textblob |
| 3 | nltk |
| 4 | pandas |
| 5 | numpy |
| 6 | matplotlib |
To install:
cmd> pip install package-name
Selenium here uses Microsoft Edge Driver which can be found here.
cmd> python plot.py
Wait for the results!
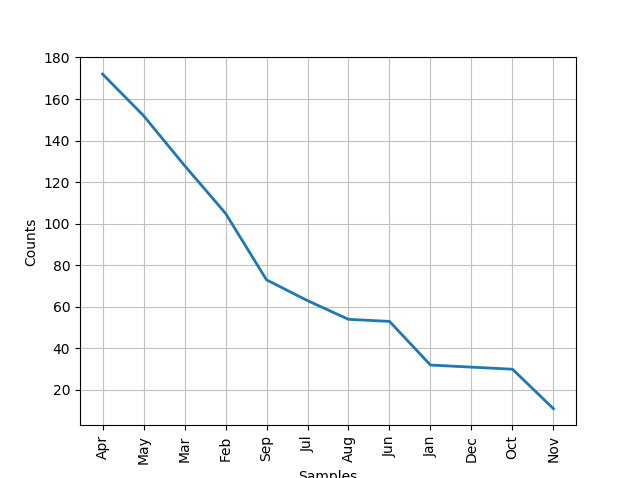
Sample results ~ for numberOfPages = 9
Monthly count of reviews:
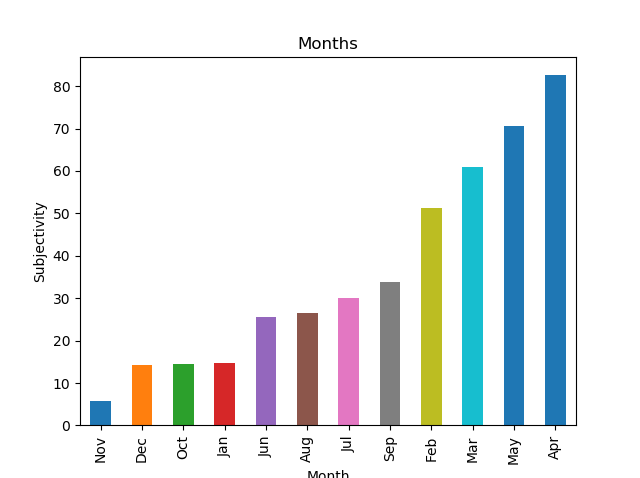
Subjectivity:
| month | mean | std |
|---|---|---|
| Apr | 0.480404 | 0.144391 |
| Aug | 0.489233 | 0.150553 |
| Dec | 0.456081 | 0.102739 |
| Feb | 0.489292 | 0.151400 |
| Jan | 0.462957 | 0.121368 |
| Jul | 0.476416 | 0.146015 |
| Jun | 0.480522 | 0.175589 |
| Mar | 0.475519 | 0.141978 |
| May | 0.463686 | 0.135119 |
| Nov | 0.532682 | 0.144049 |
| Oct | 0.481794 | 0.140831 |
| Sep | 0.464664 | 0.114662 |
Sum of Subjectivity grouped by month:
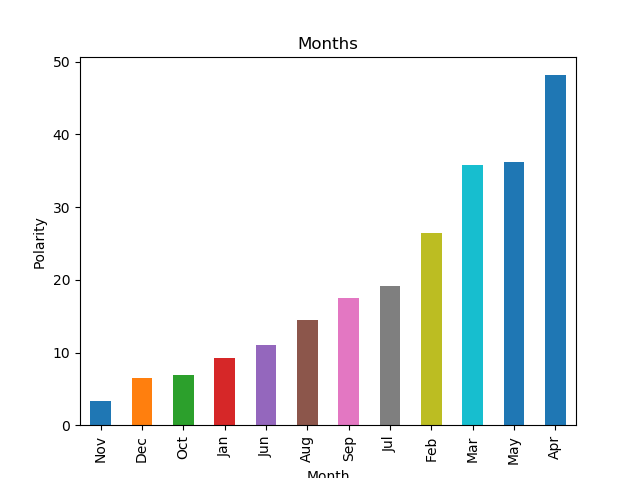
Polarity:
| month | mean | std |
|---|---|---|
| Apr | 0.280463 | 0.226523 |
| Aug | 0.268666 | 0.187963 |
| Dec | 0.210025 | 0.196812 |
| Feb | 0.251779 | 0.235441 |
| Jan | 0.288362 | 0.196624 |
| Jul | 0.303601 | 0.222313 |
| Jun | 0.208422 | 0.196958 |
| Mar | 0.280068 | 0.199223 |
| May | 0.238337 | 0.188634 |
| Nov | 0.301212 | 0.179222 |
| Oct | 0.228921 | 0.246744 |
| Sep | 0.243447 | 0.187616 |
Sum of Polarity grouped by month: