GithubHelp home page GithubHelp logo

datadog / watermarkpodautoscaler Goto Github PK

View Code? Open in Web Editor NEW
208.0 8.0 25.0 26.97 MB

Custom controller that extends the Horizontal Pod Autoscaler

License: Apache License 2.0

Dockerfile 0.50% Shell 6.20% Go 90.92% Makefile 1.86% Mustache 0.50% Smarty 0.02%
kubernetes autoscaling metrics hpa metrics-server

watermarkpodautoscaler's Introduction

Watermark Pod Autoscaler Controller

Disclaimer: This project is in beta - The API might change.

Overview

The Watermark Pod Autoscaler (WPA) Controller is a custom controller that extends the Horizontal Pod Autoscaler (HPA).

The features

  • Set high and low bounds to prevent autoscaling events.
  • Specify scaling velocity.
  • Specify windows of time to restrict upscale or downscale events.
  • Add delays to avoid scaling on bursts.
  • Different algorithms to compute the desired number of replicas.

The goal

The Watermark Pod Autoscaler Controller is an alternative controller to the upstream Horizontal Pod Autoscaler Controller.

When to use it

If you want to autoscale some of your applications, but:

  • The single threshold logic of the HPA is not enough.
  • If you need to have granular configuration for the autoscaling controller.

Usage

The algorithm

e.g.

apiVersion: datadoghq.com/v1alpha1
kind: WatermarkPodAutoscaler
[...]
spec:
  algorithm: absolute
[...]

There are two options to compute the desired number of replicas:

  1. average The controller will use the ratio value from the external metrics provider / current number of replicas, and will compare it to the watermarks. The recommended number of replicas is value from the external metrics provider / watermark (low or high depending on the current value).

    The average algorithm is a good fit if you use a metric that does not depend on the number of replicas. Typically, the number of requests received by an ELB can indicate how many webservers we want to have, given that we know that a single webserver should handle n rq/s. Adding a replica will not increase or decrease the number of requests received by the load balancer.

  2. absolute The default value is absolute. An average metric should be used. The recommended number of replicas is computed as current number of replicas * value from the external metrics provider / watermark.

    The absolute algorithm is the default, as it represents the most common use case. For example, if you want your application to run between 60% and 80% of CPU, and avg:cpu.usage is at 85%, you need to scale up. The metric has to be correlated to the number of replicas.

Note: In the upstream controller, only the math.Ceil function is used to round up the recommended number of replicas.

This means that if you have a threshold at 10, you will need to reach a utilization of 8.999... from the external metrics provider to downscale by one replica. However, a utilization of 10.001 will make you scale up by one replica.

The WPA controller will use math.Floor if the value is under the lower watermark. This ensures symmetrical behavior. Combined with other scaling options, this allows finer control over when to downscale.

Deployment

To use the Watermark Pod Autoscaler, deploy it in your Kubernetes cluster:

  1. Download the Watermark Pod Autoscaler project zip file. Source code can be found at DataDog/watermarkpodautoscaler.

  2. Unzip the project, and go into the ./watermarkpodautoscaler folder.

  3. Define your namespace and Watermark Pod Autoscaler controller:

    DD_NAMESPACE="datadog"
    DD_NAMEWPA="wpacontroller"
  4. Create the namespace:

    kubectl create ns $DD_NAMESPACE
  5. Install the Watermark Pod Autoscaler controller with Helm:

    helm install $DD_NAMEWPA -n $DD_NAMESPACE ./chart/watermarkpodautoscaler

kubectl plugin

The WatermarkPodAutoscaler Controler comes with a kubectl plugin providing a set of helper utilities. more information on the dedicated documentation page: docs/kubectl-plugin.md

The process

Create your WPA in the same namespace as your target deployment.

The Datadog Cluster Agent will pick up the creation/update/deletion event. It parses the WPA spec to extract the metric and scope to get from Datadog.

Concrete examples

In this example, we are using the following spec configuration:

apiVersion: datadoghq.com/v1alpha1
kind: WatermarkPodAutoscaler
metadata:
  name: example-watermarkpodautoscaler
spec:
  downscaleForbiddenWindowSeconds: 60
  downscaleDelayBelowWatermarkSeconds: 300
  upscaleForbiddenWindowSeconds: 30
  upscaleDelayAboveWatermarkSeconds: 30
  scaleDownLimitFactor: 30
  scaleUpLimitFactor: 50
  minReplicas: 4
  maxReplicas: 9
  scaleTargetRef:
    kind: "Deployment"
    name: "some_app"
    apiVersion: "apps/v1"
  metrics:
  - external:
      highWatermark: 400m
      lowWatermark: 150m
      metricName: custom.request_duration.max
      metricSelector:
        matchLabels:
          kubernetes_cluster: mycluster
          service: billing
          short_image: billing-app
    type: External
  tolerance: "0.01"
  • Metric types

Both the External and the Resource metric types are supported. The WPA controller uses the same format as the HPA. More information here.

  • Bounds

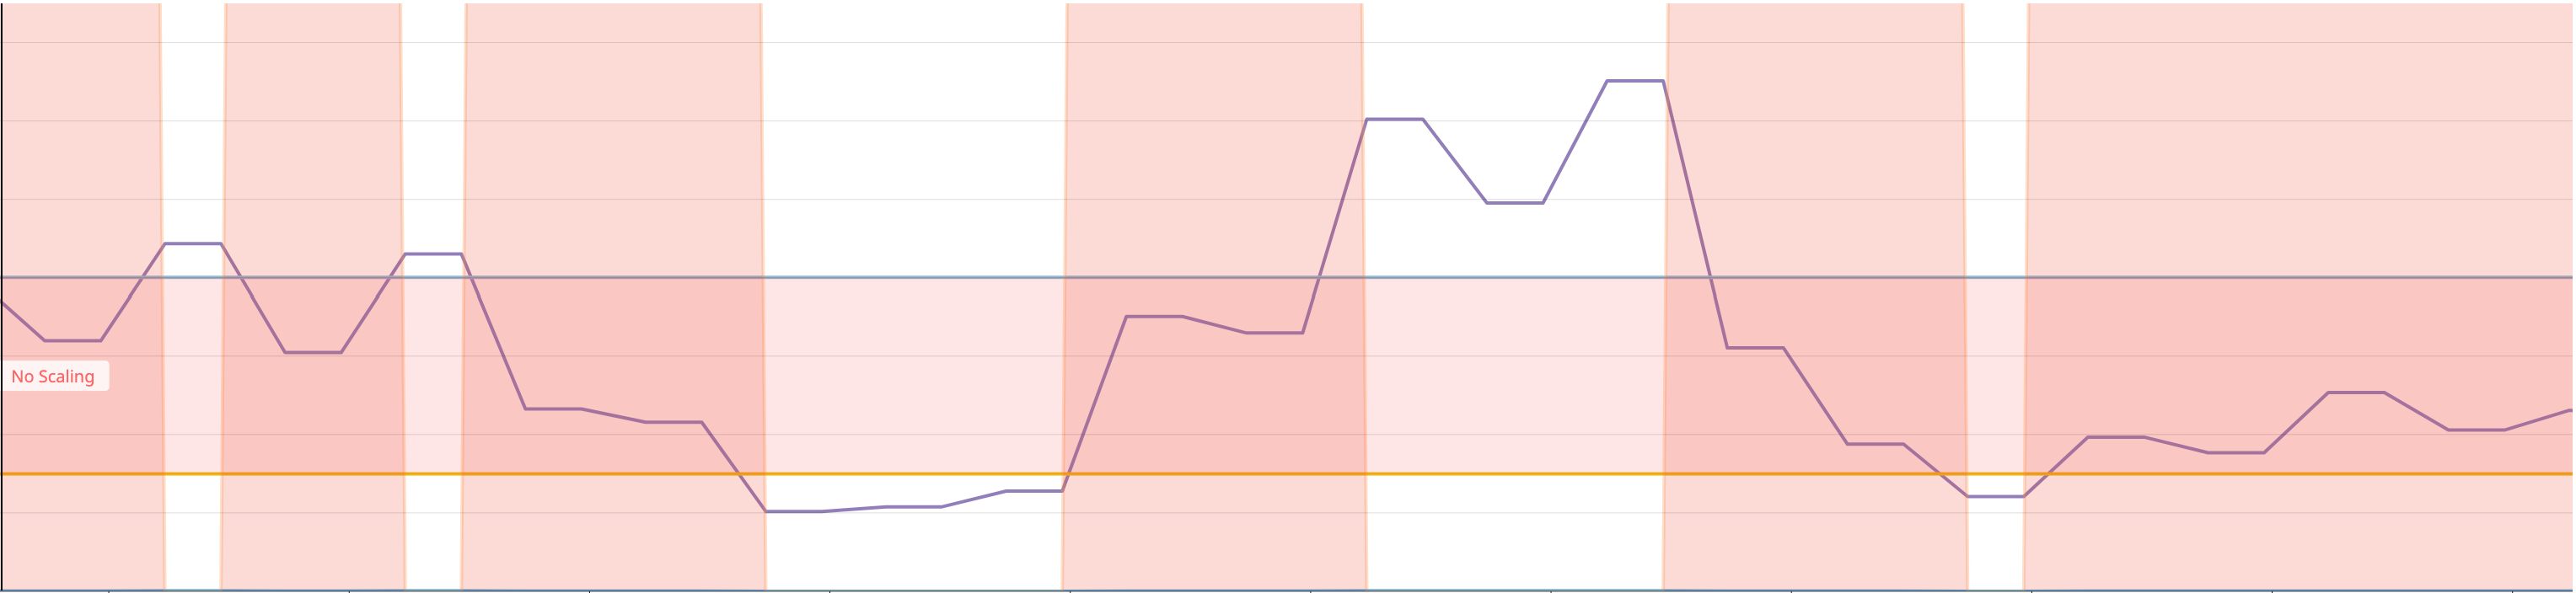
Starting with the watermarks, the value of the metric collected (watermarkpodautoscaler.wpa_controller_value) from Datadog in purple when between the bounds (watermarkpodautoscaler.wpa_controller_low_watermark and watermarkpodautoscaler.wpa_controller_high_watermark) will instruct the controller not to trigger a scaling event. They are specified as Quantities, so you can use m | "" | k | M | G | T | P | E to easily represent the value you want to use.

We can use the metric watermarkpodautoscaler.wpa_controller_restricted_scaling{reason:within_bounds} to verify that it is indeed restricted. Note: the metric was multiplied by 1000 in order to make it more explicit that during this time, no scaling event could have been triggered by the controller.
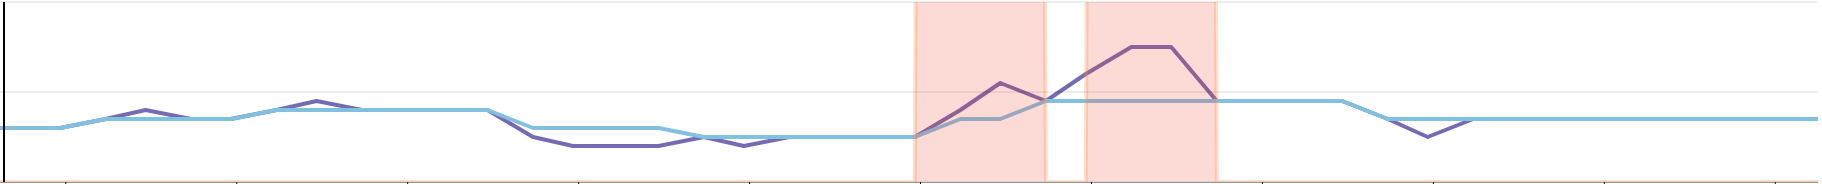
 Within Watermarks

  • Velocity

The second set of configuration options pertains to the scaling velocity of your deployment, controlled by scaleDownLimitFactor and scaleUpLimitFactor. These are integers between 0 and 100. They represent the maximum ratio of respectively downscaling and upscaling, given the current number of replicas.

In this case, should we have 10 replicas and a recommended number of replicas at 14 (see the Algorithm section for more details on the recommendation) with a scaleUpFactor of 30 (%), we would be capped at 13 replicas.

In the following graph, we can see that the suggested number of replicas (in purple), represented by the metric watermarkpodautoscaler.wpa_controller_replicas_scaling_proposal is too high compared to the current number of replicas. This will trigger the upscale capping logic, which can be monitored using the metric watermarkpodautoscaler.wpa_controller_restricted_scaling{reason:upscale_capping} (Note: Same as above, the metric was multiplied to make it more explicit). Thus, the effective number of replicas watermarkpodautoscaler.wpa_controller_replicas_scaling_effective will scale up, but according to the scaleUpLimitFactor. Upscale Capping

In this similar example, we avoid downscaling too much, and we can use the same set of metrics to guarantee that we only scale down by a reasonable number of replicas. Downscale Capping

It is important to note that we always make conservative scaling decisions.

  • With a scaleUpLimitFactor of 29%: if we have 10 replicas and are recommended 13, we will upscale to 12.
  • With a scaleDownLimitFactor of 29%: if we have 10 replicas and are recommended 7, we will downscale to 8.
  • The minimum number of replicas we can recommend to add or remove is one (not zero). This is to avoid edge scenarios when using a small number of replicas.
  • Note that the options minReplicas and maxReplicas take precedence. Refer to the Precedence section.
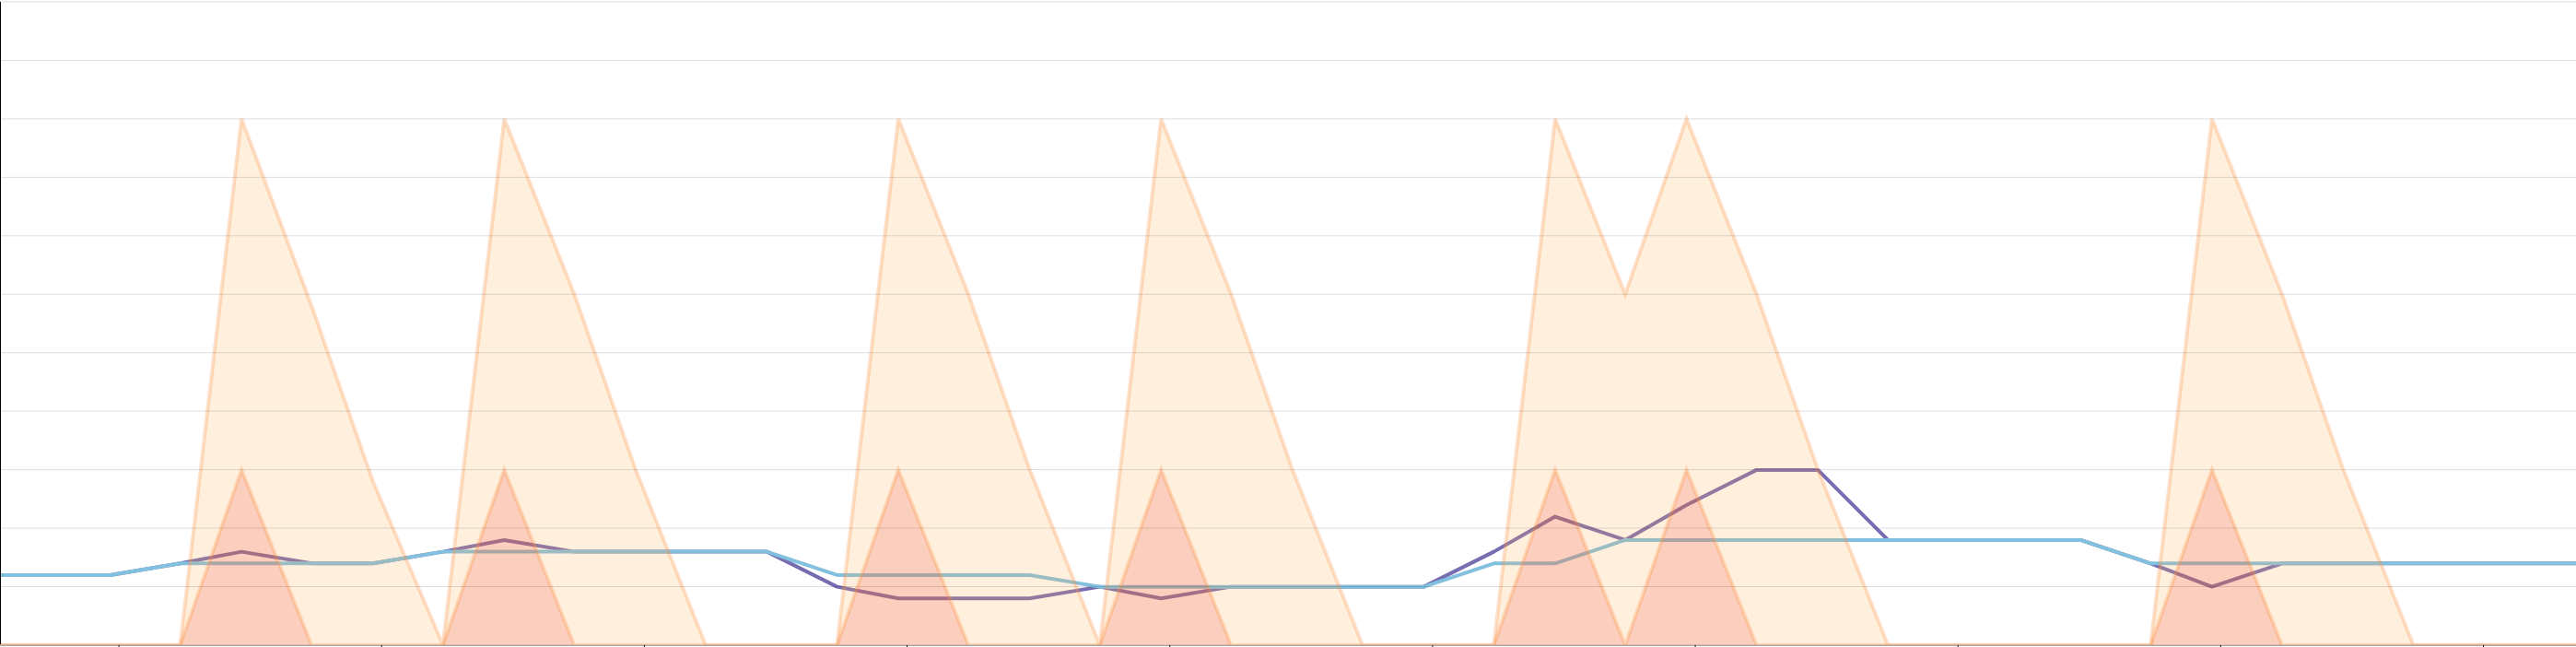
  • Cooldown periods

Finally, the last options available are downscaleForbiddenWindowSeconds and upscaleForbiddenWindowSeconds . These represent how much time (in seconds) after a scaling event to wait before scaling down and scaling up, respectively. We only keep the last scaling event, and we do not compare the upscaleForbiddenWindowSeconds to the last time we only upscaled.

In the following example, we can see that the recommended number of replicas is ignored if we are in a cooldown period. The downscale cooldown period can be visualized with watermarkpodautoscaler.wpa_controller_transition_countdown{transition:downscale}, and is represented in yellow on the graph below. We can see that it is significantly higher than the upscale cooldown period (transition:upscale) in orange on our graph. Once we are recommended to scale, we will only scale if the appropriate cooldown window is over. This will reset both countdowns. Forbidden Windows

  • Scaling Delay

In order to avoid scaling from bursts you can use the following features: downscaleDelayBelowWatermarkSeconds and/or upscaleDelayAboveWatermarkSeconds. These options are specified as integers. The metric(s) have to remain above or under its/their respective watermark for the configured duration. You can keep track of how much time is left in the status of the WPA:

  - lastTransitionTime: "2022-11-15T02:02:09Z"
    message: Allow downscaling if the value stays under the Watermark
    reason: Value below Low Watermark
    status: "False"
    type: BelowLowWatermark

Or in the logs of the controller:

{"level":"info","ts":1668481092517.446,"logger":"controllers.WatermarkPodAutoscaler","msg":"Will not scale: value has not been out of bounds for long enough","watermarkpodautoscaler":"datadog/example-watermarkpodautoscaler","wpa_name":"example-watermarkpodautoscaler","wpa_namespace":"datadog","time_left":3209}

Note: If you are using multiple metrics with this feature, the above/below condition is considered using the OR of the metrics.

For example, suppose you have a 60 second upscaleDelay with two metrics, M1 and M2. If M1 stays above its high watermark for 40 seconds [t0; t40], and the M2 one goes above its high watermark for 30 seconds, overlapping with M1 during its last 10 seconds, [t30; t60], this validates the upscaleDelay condition and allows for an upscaling event.

  • Precedence

As we retrieve the value of the external metric, we will first compare it to the sum highWatermark + tolerance and to the difference lowWatermark - tolerance. If we are outside of the bounds, we compute the recommended number of replicas. We then compare this value to the current number of replicas to potentially cap the recommended number of replicas also according to minReplicas and maxReplicas. Finally, we look at if we are allowed to scale, given the downscaleForbiddenWindowSeconds and upscaleForbiddenWindowSeconds.

  • Pod Lifecycle

In order to have more granular control over the conditions under which a target can be scaled, you can use the following features:

  • minAvailableReplicaPercentage: Indicates the minimum percentage of replicas that need to be available in order for the controller to autoscale the target. For instance, if set at 50 and less than half of the pods behind the target are in an Available state, the target will not be scaled by the controller.

  • readinessDelaySeconds: Specifies how much time replicas need to be running for, prior to be taken into account in the scaling decisions.

  • Simulation

If all the conditions are met, the controller will scale the targeted object in scaleTargetRef to the recommended number of replicas only if the dryRun flag is not set to true. It will indicate this by logging:

{"level":"info","ts":1566327479.866722,"logger":"wpa_controller","msg":"DryRun mode: scaling change was inhibited currentReplicas:8 desiredReplicas:12"}

Limitations

  • Only officially supports one metric per WPA. While the logic supports multiple metrics and applies the greatest recommendation of all metrics, the status needs some refactoring to reflect this insight.
  • Does not take CPU into account to normalize the number of replicas.

Troubleshooting

On the Datadog Cluster Agent side

The Cluster Agent is running an informer against the WPA resources, and similar to the HPA, upon creation/update/deletion will parse the spec to query the metric from Datadog.

The Cluster Agent doesn't run the WPA listener by default. To enable WPA in the Cluster Agent, set the environment variable DD_EXTERNAL_METRICS_PROVIDER_WPA_CONTROLLER=true and update the ClusterRole assigned to the Cluster Agent Service Account to have access to WatermarkPodAutoscaler objects:

[...]
- apiGroups: ["datadoghq.com"]
  resources:
  - watermarkpodautoscalers
  verbs:
  - get
  - list
  - watch
[...]

Note: To enable WPA in the Cluster Agent using the datadog helm chart, set clusterAgent.metricsProvider.wpaController to true. The ClusterRole will be updated automatically.

Once you have applied those changes and created a WPA object, if you exec in the Datadog Cluster Agent pod and run agent status you will be able to see more specific details about the spec of the autoscalers that were parsed (whether it's a horizontal or a watermark pod autoscaler).

  * watermark pod autoscaler: default/example2-watermarkpodautoscaler
    - name: example2-watermarkpodautoscaler
    - namespace: default
    - type: watermark
    - uid: ff09b7d8-d99b-11e9-a8c1-42010a8001c4
    Metric name: sinus
    Labels:
    - foo: bar
    Value: 75.1297378540039
    Timestamp: 15688259400
    Valid: true

  * horizontal pod autoscaler: default/nginxext
    - name: nginxext
    - namespace: default
    - type: horizontal
    - uid: 61ef3f6e-af32-11e9-a8c1-42010a8001c4
    Metric name: docker.mem.rss
    Labels:
    - cluster-location: us-central1-a
    - cluster-name: charly
    Value: 263888700952
    Timestamp: 15688259400
    Valid: true

Lifecycle of the controller

In addition to the metrics mentioned above, these are logs that will help you better understand the proper functioning of the WPA.

Every 15 seconds, we retrieve the metric listed in the metrics section of the spec from Datadog.

{"level":"info","ts":1668484420515.7678,"logger":"controllers.WatermarkPodAutoscaler","msg":"Metrics from the External Metrics Provider","watermarkpodautoscaler":"datadog/example-watermarkpodautoscaler","wpa_name":"example-watermarkpodautoscaler","wpa_namespace":"datadog","metrics":[33959]}
{"level":"info","ts":1668484420515.8203,"logger":"controllers.WatermarkPodAutoscaler","msg":"Value is below lowMark","watermarkpodautoscaler":"datadog/example-watermarkpodautoscaler","wpa_name":"example-watermarkpodautoscaler","wpa_namespace":"datadog","usage":"33959m","replicaCount":7,"currentReadyReplicas":8,"tolerance (%)":1,"adjustedLM":34650,"adjustedUsage":33959}
{"level":"info","ts":1668484420515.8906,"logger":"controllers.WatermarkPodAutoscaler","msg":"Proposing replicas","watermarkpodautoscaler":"datadog/example-watermarkpodautoscaler","wpa_name":"example-watermarkpodautoscaler","wpa_namespace":"datadog","proposedReplicas":7,"metricName":"datadogmetric@datadog:example-watermarkpodautoscaler-utilization-metric{map[kube_container_name:my-container service:my-target]}","reference":"Deployment/datadog/example-watermarkpodautoscaler","metric timestamp":"Tue, 15 Nov 2022 03:53:20 UTC"}
{"level":"info","ts":1668484420515.9324,"logger":"controllers.WatermarkPodAutoscaler","msg":"Normalized Desired replicas","watermarkpodautoscaler":"datadog/example-watermarkpodautoscaler","wpa_name":"example-watermarkpodautoscaler","wpa_namespace":"datadog","desiredReplicas":7}
{"level":"info","ts":1668484420515.946,"logger":"controllers.WatermarkPodAutoscaler","msg":"Cooldown status","watermarkpodautoscaler":"datadog/example-watermarkpodautoscaler","wpa_name":"example-watermarkpodautoscaler","wpa_namespace":"datadog","backoffUp":false,"backoffDown":false,"desiredReplicas":7,"currentReplicas":8}
{"level":"info","ts":1668484420515.9563,"logger":"controllers.WatermarkPodAutoscaler","msg":"Will not scale: value has not been out of bounds for long enough","watermarkpodautoscaler":"datadog/example-watermarkpodautoscaler","wpa_name":"example-watermarkpodautoscaler","wpa_namespace":"datadog","time_left":2335}

Here, the current number of replicas seen in the target deployment is six. We then see the raw value retrieved from the External Metrics Provider, and we compare it to the high and low watermarks. Given the result of this comparison, we print the recommended number of replicas. In this case, it is five.

If you want to query the External Metrics Provider directly, you can use the following command:

kubectl get --raw "/apis/external.metrics.k8s.io/v1beta1/namespaces/<namespace of your deployment>/<name of the metrics>" | jq .

You can optionally add label selectors too by adding ?labelSelector=key%3Dvalue. If we wanted to retrieve our metric in this case, we could use:

kubectl get --raw "/apis/external.metrics.k8s.io/v1beta1/namespaces/<namespace of your deployment>/<name of the metrics>?labelSelector=key%3Dvalue%2Cotherkey%3Dothervalue%2Cshort_image%3Dimage" | jq .

If you see logs such as:

{"level":"info","ts":1566397216.8918724,"logger":"wpa_controller","msg":"failed to compute desired number of replicas based on listed metrics for Deployment/datadog/propjoe-green: failed to get external metric dd.propjoe.request_duration.max: unable to get external metric datadog/propjoe-green/&LabelSelector{MatchLabels:map[string]string{fooa: bar,},MatchExpressions:[],}: no metrics returned from external metrics API"}

Then you can verify that this metric is indeed not available from the External Metrics Provider. This could be because of a typo in the labels, or the metric can't be fetched from Datadog (which could be due to various factors: too sparse, API down, rate limit hit, etc.). You can look through the External Metrics Provider logs for further investigation.

We then verify the scaling velocity capping and the cooldown windows. In the case of a scaling capping, you would see something like:

{"level":"info","ts":1566327268.8839815,"logger":"wpa_controller","msg":"Upscaling rate higher than limit of 50.0% up to 9 replicas. Capping the maximum upscale to 9 replicas"}
{"level":"info","ts":1566327268.884001,"logger":"wpa_controller","msg":"Returning 9 replicas, condition: ScaleUpLimit reason the desired replica count is increasing faster than the maximum scale rate"}
{"level":"info","ts":1566327479.8845513,"logger":"wpa_controller","msg":" -> after normalization: 9"}

Then we consider the cooldown periods. You will have logs indicative of when the last scaling event was, as well as when the next upscale and downscale events are forbidden until:

{"level":"info","ts":1566327479.8845847,"logger":"wpa_controller","msg":"Too early to downscale. Last scale was at 2019-08-20 18:57:44 +0000 UTC, next downscale will be at 2019-08-20 18:58:44 +0000 UTC, last metrics timestamp: 2019-08-20 18:57:59 +0000 UTC"}
{"level":"info","ts":1566327479.8846018,"logger":"wpa_controller","msg":"Too early to upscale. Last scale was at 2019-08-20 18:57:44 +0000 UTC, next upscale will be at 2019-08-20 18:58:14 +0000 UTC, last metrics timestamp: 2019-08-20 18:57:59 +0000 UTC"}
{"level":"info","ts":1566327479.884608,"logger":"wpa_controller","msg":"backoffUp: true, backoffDown: true, desiredReplicas 5, currentReplicas: 6"}

Finally, we have verification that the deployment was correctly autoscaled:

{"level":"info","ts":1566327253.7887673,"logger":"wpa_controller","msg":"Successful rescale of watermarkpodautoscaler, old size: 8, new size: 9, reason: cutom_metric.max{map[kubernetes_cluster:my-cluster service:my-service short_image:my-image]} above target"}

Extra options

  • You can use the annotation wpa.datadoghq.com/logs-attributes to add extra key values in the logs associated with the underlying WPA object. Example:
apiVersion: datadoghq.com/v1alpha1
kind: WatermarkPodAutoscaler
metadata:
  annotations:
    wpa.datadoghq.com/logs-attributes: '{"mywpa": "isgreat"}'
  name: watermarkpodautoscaler-sinus
  namespace: default
  [...]

Will yield:

{"level":"info","ts":1643642642091.062,"logger":"controllers.WatermarkPodAutoscaler","msg":"getReadyPodsCount","watermarkpodautoscaler":"default/watermarkpodautoscaler-sinus","mywpa":"isgreat","full podList length":2,"toleratedAsReadyPodCount":2,"incorrectly targeted pods":0}

FAQ

  • What happens if I scale manually my deployment?

    In the next reconcile loop, the new number of replicas will be considered to compute the desired number of replicas. You might see a log saying that the resource was modified by someone else. If the number of replicas configured is outside of the bounds, however, the controller will scale this back to a number of replicas within the acceptable range.

  • How to disable temporarily the WPA to manually scale up/down my deployment?

    The recommended way is to set the WPA in dry run mode and then scale to the desired number of replicas. You can set the WPA in dry run using this patch command:

    kubectl patch wpa <wpa-name> --type='json' -p='[{"op": "replace", "path": "/spec/dryRun", "value":true}]'
    

    Don't forget to set back the dry run mode to false once your temporary override is over so that the WPA is active again.

  • What is the footprint of the controller?

    From our testing, it is a factor of the number of deployments in the cluster.

    • 500+ deployments, 1GB - 30mCores
    • 1000+ deployments, 2.3GB - 100mCores Note: When the API server restarts, the controller runtime caches the old state and the new one for a second and then merges everything. This makes the memory usage shoot up and can OOM the controller.
  • Is the controller stateless?

    Yes.

  • Does WPA support multiple metrics?

    Yes, WPA can scale on multiple metrics and works similar to HPA. WPA evaluates each metric separately and proposes the number of replicas associated with the metric that requires the largest number. For example, if WPA evaluates metric1, metric2, metric3, and for each it calculates 10, 20, 30 replica proposals respectively, the final proposal is 30.

RBAC

Since we watch all the WPA definitions cluster wide, we use a clusterrole.

A useful option is to impersonate the user to verify rights. For instance, to verify that you have the right to get a deployment as the WPA controller's service account:

kubectl get deploy <your_deploy>  --as system:serviceaccount:datadog:watermarkpodautoscaler -n <your_ns>

Or, query the External Metrics Provider:

kubectl get --raw "/apis/external.metrics.k8s.io/v1beta1/namespaces/<your_ns>/metric --as system:serviceaccount:<your_ns>:watermarkpodautoscaler

Developer guide

Setup your dev environment

Requirements:

  • golang >= 1.18
  • make
  • docker
  • git

After cloning the repository https://github.com/DataDog/watermarkpodautoscaler, set some environment variables:

export GO111MODULE=on
unset GOPATH
export PATH=$PATH:$(pwd)/bin

Then, to install some tooling dependencies, run make install-tools.

Useful commands

  • make install-tools: Install the tooling to use the operator SDK.
  • make build: Build the controller locally.
  • make generate: Run the several operator SDK generator, which generates code for the controller and the informer's registration.
  • make test: Run unit tests.
  • make validate: Run common Golang linters (golangci-lint).
  • make e2e: Run end-to-end tests on the current configured Kubernetes cluster.
  • make container: Build the controller Docker image using the operator SDK.
  • make container-ci: Build the controller Docker image with the multi-stage Dockerfile.

Releasing

The release process documentation is available here.

Acknowledgements

Some of the features were inspired by the Configurable HPA or CHPA. Most of the code structure was also used for the Watermark Pod Autoscaler, although the overall packaging of the CRD was done with the operator SDK.

watermarkpodautoscaler's People

Contributors

adriacabeza avatar ahmed-mez avatar anleg avatar arapulido avatar bpineau avatar celenechang avatar clamoriniere avatar cswatt avatar davidor avatar dependabot[bot] avatar fanny-jiang avatar fl0lec avatar ganeshkumarsv avatar jeremy-lq avatar jkulton avatar juliogreff avatar khewonc avatar l3n41c avatar levan-m avatar levipe01 avatar mfpierre avatar nicolasgodefroy avatar octplane avatar trazfr avatar vboulineau avatar xornivore avatar zrosenberg avatar

Stargazers

 avatar  avatar  avatar  avatar  avatar  avatar  avatar  avatar  avatar  avatar  avatar  avatar  avatar  avatar  avatar  avatar  avatar  avatar  avatar  avatar  avatar  avatar  avatar  avatar  avatar  avatar  avatar  avatar  avatar  avatar  avatar  avatar  avatar  avatar  avatar  avatar  avatar  avatar  avatar  avatar  avatar  avatar  avatar  avatar  avatar  avatar  avatar  avatar  avatar  avatar  avatar  avatar  avatar  avatar  avatar  avatar  avatar  avatar  avatar  avatar  avatar  avatar  avatar  avatar  avatar  avatar  avatar  avatar  avatar  avatar  avatar  avatar  avatar  avatar  avatar  avatar  avatar  avatar  avatar  avatar  avatar  avatar  avatar  avatar  avatar  avatar  avatar  avatar  avatar  avatar  avatar  avatar  avatar  avatar  avatar  avatar  avatar  avatar  avatar  avatar

Watchers

 avatar  avatar  avatar  avatar  avatar  avatar  avatar

watermarkpodautoscaler's Issues

WPA support for openshift 3.11 + k8s 1.11

Can WPA support openshiift 3.11 or kubernetes 1.11?
I try to apply WPA on okd3.11 and I got the following error
must only have "properties", "required" or "description" at the root if the status subresource is enabled

I tried to mark "subresources" which is in CRD WatermarkPodAutoscaler and it could be deployed successfully.
file datadoghq.com_watermarkpodautoscalers_crd.yaml

 33     shortNames:
 34     - wpa
 35     singular: watermarkpodautoscaler
 36   scope: Namespaced
 37   subresources: # delete these two lines
 38     status: {} # delete these two lines
 39   validation:
 40     openAPIV3Schema:
 41       description: WatermarkPodAutoscaler is the Schema for the watermarkpodautoscalers
 42         API

But I face a problem that datadog cluster didn't detect wpa created and didn't collect custom metrics from Datadog server when I add WPA as below

  1 apiVersion: datadoghq.com/v1alpha1
  2 kind: WatermarkPodAutoscaler
  3 metadata:
  4   name: consumer
  5   namespace: kafka-project
  6 spec:
  7   # Add fields here
  8   algorithm: average
  9   maxReplicas: 15
 10   minReplicas: 1
 11   tolerance: 0.01
 12   downscaleForbiddenWindowSeconds: 300
 13   upscaleForbiddenWindowSeconds: 15
 14   scaleUpLimitFactor: 50
 15   scaleDownLimitFactor: 20
 16   scaleTargetRef:
 17     kind: Deployment
 18     apiVersion: apps/v1
 19     name: consumer
 20   readinessDelay: 10
 21   metrics:
 22   # Resource or External type supported
 23   # Example usage of External type
 24   - type: External
 25     external:
 26       highWatermark: "1"
 27       lowWatermark: "1"
 28       metricName: <metrics_name>
 29       metricSelector:
 30         matchLabels:
 31           kube_deployment: consumer
 32           kube_namespace: kafka-project

Erorr log is below

Datadog cluster agent

2020-05-12 12:13:04 UTC | CLUSTER | DEBUG | (pkg/aggregator/aggregator.go:554 in sendEvents) | Flushing 1 events to the forwarder
2020-05-12 12:13:04 UTC | CLUSTER | DEBUG | (pkg/aggregator/aggregator.go:393 in pushSeries) | Flushing 2 series to the forwarder
2020-05-12 12:13:04 UTC | CLUSTER | DEBUG | (pkg/aggregator/aggregator.go:506 in sendServiceChecks) | Flushing 5 service checks to the forwarder
2020-05-12 12:13:04 UTC | CLUSTER | DEBUG | (pkg/serializer/split/split.go:77 in Payloads) | The payload was not too big, returning the full payload
2020-05-12 12:13:05 UTC | CLUSTER | DEBUG | (pkg/collector/runner/runner.go:263 in work) | Running check kubernetes_apiserver
2020-05-12 12:13:05 UTC | CLUSTER | DEBUG | (pkg/util/kubernetes/apiserver/leaderelection/leaderelection.go:164 in EnsureLeaderElectionRuns) | Currently Leader: true. Leader identity: "datadog-cluster-agent-59858975fd-98rfr"
2020-05-12 12:13:05 UTC | CLUSTER | DEBUG | (pkg/util/kubernetes/apiserver/common/common.go:23 in GetResourcesNamespace) | No configured namespace for the resource, fetching from the current context
2020-05-12 12:13:05 UTC | CLUSTER | DEBUG | (pkg/util/kubernetes/apiserver/events.go:55 in RunEventCollection) | Starting to watch from 60726555
2020-05-12 12:13:07 UTC | CLUSTER | DEBUG | (pkg/util/kubernetes/apiserver/events.go:113 in RunEventCollection) | Collected 2 events, will resume watching from resource version 60726597
2020-05-12 12:13:07 UTC | CLUSTER | DEBUG | (pkg/util/kubernetes/apiserver/common/common.go:23 in GetResourcesNamespace) | No configured namespace for the resource, fetching from the current context
2020-05-12 12:13:07 UTC | CLUSTER | DEBUG | (pkg/util/kubernetes/apiserver/apiserver.go:328 in UpdateTokenInConfigmap) | Updated event.tokenKey to 60726597 in the ConfigMap datadogtoken
2020-05-12 12:13:07 UTC | CLUSTER | DEBUG | (pkg/collector/runner/runner.go:329 in work) | Done running check kubernetes_apiserver
2020-05-12 12:13:08 UTC | CLUSTER | DEBUG | (pkg/clusteragent/custommetrics/provider.go:196 in GetExternalMetric) | External metrics returned: []external_metrics.ExternalMetricValue{}

WPA controller

E0512 12:10:52.718448       1 memcache.go:199] couldn't get resource list for external.metrics.k8s.io/v1beta1: Got empty response for: external.metrics.k8s.io/v1beta1
{"level":"info","ts":1589285452.7814093,"logger":"wpa_controller","msg":"Target deploy","Request.Namespace":"kafka-project","Request.Name":"consumer","replicas":2}
{"level":"error","ts":1589285452.7956553,"logger":"wpa_controller","msg":"The WPA controller was unable to update the number of replicas","Request.Namespace":"kafka-project","Request.Name":"consumer","error":"the server could not find the requested resource (put watermarkpodautoscalers.datadoghq.com consumer)","stacktrace":"github.com/go-logr/zapr.(*zapLogger).Error\n\twatermarkpodautoscaler/vendor/github.com/go-logr/zapr/zapr.go:128\ngithub.com/DataDog/watermarkpodautoscaler/pkg/controller/watermarkpodautoscaler.(*ReconcileWatermarkPodAutoscaler).reconcileWPA\n\twatermarkpodautoscaler/pkg/controller/watermarkpodautoscaler/watermarkpodautoscaler_controller.go:428\ngithub.com/DataDog/watermarkpodautoscaler/pkg/controller/watermarkpodautoscaler.(*ReconcileWatermarkPodAutoscaler).Reconcile\n\twatermarkpodautoscaler/pkg/controller/watermarkpodautoscaler/watermarkpodautoscaler_controller.go:344\nsigs.k8s.io/controller-runtime/pkg/internal/controller.(*Controller).reconcileHandler\n\twatermarkpodautoscaler/vendor/sigs.k8s.io/controller-runtime/pkg/internal/controller/controller.go:216\nsigs.k8s.io/controller-runtime/pkg/internal/controller.(*Controller).processNextWorkItem\n\twatermarkpodautoscaler/vendor/sigs.k8s.io/controller-runtime/pkg/internal/controller/controller.go:192\nsigs.k8s.io/controller-runtime/pkg/internal/controller.(*Controller).worker\n\twatermarkpodautoscaler/vendor/sigs.k8s.io/controller-runtime/pkg/internal/controller/controller.go:171\nk8s.io/apimachinery/pkg/util/wait.JitterUntil.func1\n\twatermarkpodautoscaler/vendor/k8s.io/apimachinery/pkg/util/wait/wait.go:152\nk8s.io/apimachinery/pkg/util/wait.JitterUntil\n\twatermarkpodautoscaler/vendor/k8s.io/apimachinery/pkg/util/wait/wait.go:153\nk8s.io/apimachinery/pkg/util/wait.Until\n\twatermarkpodautoscaler/vendor/k8s.io/apimachinery/pkg/util/wait/wait.go:88"}
{"level":"info","ts":1589285467.796208,"logger":"wpa_controller","msg":"Reconciling WatermarkPodAutoscaler","Request.Namespace":"kafka-project","Request.Name":"consumer"}
{"level":"info","ts":1589285467.8238223,"logger":"wpa_controller","msg":"Target deploy","Request.Namespace":"kafka-project","Request.Name":"consumer","replicas":2}
{"level":"error","ts":1589285467.8450387,"logger":"wpa_controller","msg":"The WPA controller was unable to update the number of replicas","Request.Namespace":"kafka-project","Request.Name":"consumer","error":"the server could not find the requested resource (put watermarkpodautoscalers.datadoghq.com consumer)","stacktrace":"github.com/go-logr/zapr.(*zapLogger).Error\n\twatermarkpodautoscaler/vendor/github.com/go-logr/zapr/zapr.go:128\ngithub.com/DataDog/watermarkpodautoscaler/pkg/controller/watermarkpodautoscaler.(*ReconcileWatermarkPodAutoscaler).reconcileWPA\n\twatermarkpodautoscaler/pkg/controller/watermarkpodautoscaler/watermarkpodautoscaler_controller.go:428\ngithub.com/DataDog/watermarkpodautoscaler/pkg/controller/watermarkpodautoscaler.(*ReconcileWatermarkPodAutoscaler).Reconcile\n\twatermarkpodautoscaler/pkg/controller/watermarkpodautoscaler/watermarkpodautoscaler_controller.go:344\nsigs.k8s.io/controller-runtime/pkg/internal/controller.(*Controller).reconcileHandler\n\twatermarkpodautoscaler/vendor/sigs.k8s.io/controller-runtime/pkg/internal/controller/controller.go:216\nsigs.k8s.io/controller-runtime/pkg/internal/controller.(*Controller).processNextWorkItem\n\twatermarkpodautoscaler/vendor/sigs.k8s.io/controller-runtime/pkg/internal/controller/controller.go:192\nsigs.k8s.io/controller-runtime/pkg/internal/controller.(*Controller).worker\n\twatermarkpodautoscaler/vendor/sigs.k8s.io/controller-runtime/pkg/internal/controller/controller.go:171\nk8s.io/apimachinery/pkg/util/wait.JitterUntil.func1\n\twatermarkpodautoscaler/vendor/k8s.io/apimachinery/pkg/util/wait/wait.go:152\nk8s.io/apimachinery/pkg/util/wait.JitterUntil\n\twatermarkpodautoscaler/vendor/k8s.io/apimachinery/pkg/util/wait/wait.go:153\nk8s.io/apimachinery/pkg/util/wait.Until\n\twatermarkpodautoscaler/vendor/k8s.io/apimachinery/pkg/util/wait/wait.go:88"}

Is there a workaround I can do for supporting k8s 1.11? Could you help to support k8s 1.11?
Thanks for your help.

Get a wpa based on CPU/Memory resource does not show values

I created a WPA object which looks for internal metrics as described here:

apiVersion: datadoghq.com/v1alpha1
kind: WatermarkPodAutoscaler
metadata:
  name: watermarkpodautoscaler-internal
spec:
  maxReplicas: 3
  minReplicas: 1
  tolerance: 1
  readinessDelay: 10
  scaleTargetRef:
    kind: Deployment
    apiVersion: apps/v1
    name: nginx-deployment-wpa
  metrics:
  - type: Resource
    resource:
      highWatermark: "100m"
      lowWatermark: "50m"
      name: cpu
      metricSelector:
        matchLabels:
          app: nginx-wpa

The status tells me that it is under monitoring :

kubectl describe wpa watermarkpodautoscaler-internal
[...]
  Current Metrics:
    Resource:
      Current Average Value:  24m
      Name:                   cpu
    Type:                     Resource
[...]

Unfortunately a simple get command shows me empty fields for "VALUE, WATERMARK, ..."

❯ k get wpa watermarkpodautoscaler-internal
NAME                              VALUE   HIGH WATERMARK   LOW WATERMARK   AGE   MIN REPLICAS   MAX REPLICAS   DRY-RUN
watermarkpodautoscaler-internal                                            14m   1              3

Can we improve this ?

WPA will get panic if we try to scale Openshift DeploymentConfig

Describe what happened:
WPA try to scale-out Openshift DeploymentConfig but get the following error

{"level":"info","ts":1600848500.4110653,"logger":"wpa_controller","msg":"Reconciling WatermarkPodAutoscaler","Request.Namespace":"nginx-preloader-sample","Request.Name":"wpa4"}
{"level":"error","ts":1600848500.412769,"logger":"wpa_controller","msg":"RunTime error in reconcileWPA","Request.Namespace":"nginx-preloader-sample","Request.Name":"wpa4","returnValue":"runtime error: invalid memory address or nil pointer dereference","error":"recover error","stacktrace":"github.com/go-logr/zapr.(*zapLogger).Error\n\twatermarkpodautoscaler/vendor/github.com/go-logr/zapr/zapr.go:128\ngithub.com/DataDog/watermarkpodautoscaler/pkg/controller/watermarkpodautoscaler.(*ReconcileWatermarkPodAutoscaler).reconcileWPA.func1\n\twatermarkpodautoscaler/pkg/controller/watermarkpodautoscaler/watermarkpodautoscaler_controller.go:360\nruntime.gopanic\n\t/usr/local/Cellar/go/1.13.4/libexec/src/runtime/panic.go:679\nruntime.panicmem\n\t/usr/local/Cellar/go/1.13.4/libexec/src/runtime/panic.go:199\nruntime.sigpanic\n\t/usr/local/Cellar/go/1.13.4/libexec/src/runtime/signal_unix.go:394\ngithub.com/DataDog/watermarkpodautoscaler/pkg/controller/watermarkpodautoscaler.(*ReconcileWatermarkPodAutoscaler).reconcileWPA\n\twatermarkpodautoscaler/pkg/controller/watermarkpodautoscaler/watermarkpodautoscaler_controller.go:379\ngithub.com/DataDog/watermarkpodautoscaler/pkg/controller/watermarkpodautoscaler.(*ReconcileWatermarkPodAutoscaler).Reconcile\n\twatermarkpodautoscaler/pkg/controller/watermarkpodautoscaler/watermarkpodautoscaler_controller.go:344\nsigs.k8s.io/controller-runtime/pkg/internal/controller.(*Controller).reconcileHandler\n\twatermarkpodautoscaler/vendor/sigs.k8s.io/controller-runtime/pkg/internal/controller/controller.go:216\nsigs.k8s.io/controller-runtime/pkg/internal/controller.(*Controller).processNextWorkItem\n\twatermarkpodautoscaler/vendor/sigs.k8s.io/controller-runtime/pkg/internal/controller/controller.go:192\nsigs.k8s.io/controller-runtime/pkg/internal/controller.(*Controller).worker\n\twatermarkpodautoscaler/vendor/sigs.k8s.io/controller-runtime/pkg/internal/controller/controller.go:171\nk8s.io/apimachinery/pkg/util/wait.JitterUntil.func1\n\twatermarkpodautoscaler/vendor/k8s.io/apimachinery/pkg/util/wait/wait.go:152\nk8s.io/apimachinery/pkg/util/wait.JitterUntil\n\twatermarkpodautoscaler/vendor/k8s.io/apimachinery/pkg/util/wait/wait.go:153\nk8s.io/apimachinery/pkg/util/wait.Until\n\twatermarkpodautoscaler/vendor/k8s.io/apimachinery/pkg/util/wait/wait.go:88"}

WPA.yaml

apiVersion: datadoghq.com/v1alpha1
kind: WatermarkPodAutoscaler
metadata:
  name: wpa4
  namespace: nginx-preloader-sample
spec:
  algorithm: average
  maxReplicas: 20
  minReplicas: 1
  tolerance: 0.01
  downscaleForbiddenWindowSeconds: 300
  upscaleForbiddenWindowSeconds: 15
  scaleUpLimitFactor: 90
  scaleDownLimitFactor: 90
  scaleTargetRef:
    kind: DeploymentConfig
    apiVersion: apps.openshift.io/v1
    name: nginx-prepared
  readinessDelay: 10
  metrics:
  - type: External
    external:
      highWatermark: "1"
      lowWatermark: "1"
      metricName: federatorai.recommendation
      metricSelector:
        matchLabels:
          resource: replicas
          kube_cluster: jason-4-115
          oshift_deployment_config: nginx-prepared
          kube_namespace: nginx-preloader-sample

Cluster Agent can get external metrics

  * watermark pod autoscaler: nginx-preloader-sample/wpa4
    Metric name: federatorai.recommendation
    Labels:
    - kube_cluster: jason-4-115
    - kube_namespace: nginx-preloader-sample
    - oshift_deployment_config: nginx-prepared
    - resource: replicas
    Value: 6
    Timestamp: 2020-09-23 08:18:00.000000 UTC
    Valid: true

Other WPA works as we expected

  * watermark pod autoscaler: myproject/wpa3
    Metric name: federatorai.recommendation
    Labels:
    - kube_cluster: jason-4-115
    - kube_deployment: consumer3
    - kube_namespace: myproject
    - resource: replicas
    Value: 7
    Timestamp: 2020-09-23 08:25:00.000000 UTC
    Valid: true

WPA yaml

apiVersion: datadoghq.com/v1alpha1
kind: WatermarkPodAutoscaler
metadata:
  name: wpa3
  namespace: myproject
spec:
  # Add fields here
  # algorithm must be average
  algorithm: average
  maxReplicas: 15
  minReplicas: 1
  tolerance: 0.01
  downscaleForbiddenWindowSeconds: 300
  upscaleForbiddenWindowSeconds: 15
  scaleUpLimitFactor: 90
  scaleDownLimitFactor: 90
  scaleTargetRef:
    kind: Deployment
    apiVersion: apps/v1
    name: consumer3
  readinessDelay: 10
  metrics:
  # Resource or External type supported
  # Example usage of External type
  - type: External
    external:
      # do not edit highWatermakr, and lowWatermark
      # highWatermark and lowWatermark must be 1
      highWatermark: "1"
      lowWatermark: "1"
      metricName: federatorai.recommendation
      metricSelector:
        matchLabels:
          resource: replicas
          kube_cluster: jason-4-115
          kube_deployment: consumer3
          kube_namespace: myproject

WPA log

{"level":"info","ts":1600849222.9556293,"logger":"wpa_controller","msg":"Successful rescale","Request.Namespace":"myproject","Request.Name":"wpa3","currentReplicas":6,"desiredReplicas":7,"rescaleReason":"federatorai.recommendation{map[kube_cluster:jason-4-115 kube_deployment:consumer3 kube_namespace:myproject resource:replicas]} above target"}

Describe what you expected:
WPA can scale-out Openshift DeploymentConfig successfully.

Steps to reproduce the issue:

Additional environment details (Kubernetes version, etc):
openshift v3.11.0+8f721f2-450
kubernetes v1.11.0+d4cacc0

WPA image
image: datadog/watermarkpodautoscaler:v0.1.0

Standby pods are panicking

Describe what happened:

When I run the autoscaler in HA, having a second pod in standby, the second pod will log out that it is standing by a few times and then exit. Eventually the pod enters a CrashBackoffLoop state, which means it will not actually be standing by part of the time.

What I see in the pod describe output is:

    Last State:     Terminated
      Reason:       Error
      Exit Code:    2
      Started:      Wed, 17 Mar 2021 11:54:57 -0400
      Finished:     Wed, 17 Mar 2021 11:55:27 -0400
    Ready:          False
    Restart Count:  3258

What I see in the logs:

{"level":"info","ts":1615997228.2988877,"logger":"cmd","msg":"Version: v0.2.0-dirty"}
{"level":"info","ts":1615997228.2989118,"logger":"cmd","msg":"Build time: 2020-09-09/20:03:05"}
{"level":"info","ts":1615997228.2989151,"logger":"cmd","msg":"Git tag: v0.2.0"}
{"level":"info","ts":1615997228.298917,"logger":"cmd","msg":"Git Commit: 3c5176693cdf2838c54298fb6f732c4ac21dbe86"}
{"level":"info","ts":1615997228.2989194,"logger":"cmd","msg":"Go Version: go1.13.15"}
{"level":"info","ts":1615997228.2989216,"logger":"cmd","msg":"Go OS/Arch: linux/amd64"}
{"level":"info","ts":1615997228.2989237,"logger":"cmd","msg":"Version of operator-sdk: v0.13.0"}
{"level":"info","ts":1615997228.299064,"logger":"leader","msg":"Trying to become the leader."}
{"level":"info","ts":1615997229.3133864,"logger":"leader","msg":"Found existing lock","LockOwner":"watermarkpodautoscaler-69cc854fbf-dqjbg"}
{"level":"info","ts":1615997229.3252141,"logger":"leader","msg":"Not the leader. Waiting."}
{"level":"info","ts":1615997230.456776,"logger":"leader","msg":"Not the leader. Waiting."}
{"level":"info","ts":1615997232.8421242,"logger":"leader","msg":"Not the leader. Waiting."}
{"level":"info","ts":1615997237.3827972,"logger":"leader","msg":"Not the leader. Waiting."}
{"level":"info","ts":1615997246.0937243,"logger":"leader","msg":"Not the leader. Waiting."}

Describe what you expected:

I expect that the pod can remain online and continue to check if it can become leader without panicking.

Steps to reproduce the issue:

  • Run 2 or more autoscaler pods in the same cluster, with leader election enabled
  • Wait a few minutes
  • Check on standby pod state

Additional environment details (Kubernetes version, etc):

Autoscaler image: datadog/watermarkpodautoscaler:v0.2.0, exact commit hash is in the logs above

I'm seeing this behaviour in multiple clusters, different kubernetes versions:

Server Version: version.Info{Major:"1", Minor:"18", GitVersion:"v1.18.9", GitCommit:"94f372e501c973a7fa9eb40ec9ebd2fe7ca69848", GitTreeState:"clean", BuildDate:"2020-09-16T13:47:43Z", GoVersion:"go1.13.15", Compiler:"gc", Platform:"linux/amd64"}                              
Server Version: version.Info{Major:"1", Minor:"15", GitVersion:"v1.15.7", GitCommit:"6c143d35bb11d74970e7bc0b6c45b6bfdffc0bd4", GitTreeState:"clean", BuildDate:"2019-12-11T12:34:17Z", GoVersion:"go1.12.12", Compiler:"gc", Platform:"linux/amd64"}

Datadog API rate limits

Since this controller extracts metrics using the Datadog API I would like to know how this can be brought in line with the low API rate-limits for these kind of calls (source: https://docs.datadoghq.com/api/#rate-limiting):

  • The rate limit for metric retrieval is 100 per hour per organization
  • The rate limit for the query_batch API [...] call is 300 per hour per organization.

Additionally there is no way to monitor the current rate-limit budget so it just starts failing silently.

There should at least be some kind of warning in the README or information on what to do about this.

host images in docker hub

"docker.io/datadog/watermarkpodautoscaler:v0.3.0-rc5": failed to resolve
reference "docker.io/datadog/watermarkpodautoscaler:v0.3.0-rc5": docker.io/datadog/watermarkpodautoscaler:v0.3.0-rc5:

shema watermarkpodautoscaler-datadoghq-v1alpha1.json not found

ERR  - myservice/templates/watermarkpodautoscaler.yaml: Failed initializing schema https://kubernetesjsonschema.dev/master-standalone-strict/watermarkpodautoscaler-datadoghq-v1alpha1.json: Could not read schema from HTTP, response status is 404 Not Found
 dry run...history.go:56: [debug] getting history for release myservice
upgrade.go:123: [debug] preparing upgrade for vehicle-region-store
upgrade.go:131: [debug] performing update for vehicle-region-store

crash loop - flag provided but not defined: -zap-level

Seems like used container params are unknown to the container/ go application

kubectl logs watermarkpodautoscaler-75cd69b9f7-tz88b

flag provided but not defined: -zap-level
Usage of /manager:
  -enable-leader-election
        Enable leader election for controller manager. Enabling this will ensure there is only one active controller manager. (default true)
  -health-port int
        Port to use for the health probe (default 9440)
  -kubeconfig string
        Paths to a kubeconfig. Only required if out-of-cluster.
  -leader-election-resource string
        determines which resource lock to use for leader election. option:[configmapsleases|endpointsleases|configmaps] (default "configmaps")
  -logEncoder string
        log encoding ('json' or 'console') (default "json")
  -loglevel value
        Set log level
  -metrics-addr string
        The address the metric endpoint binds to. (default ":8080")
  -syncPeriodSeconds int
        The informers resync period in seconds (default 3600)
  -version
        print version and exit

Publish to a Helm Chart repository

Hello 👋

Are there plans to publish this to either the official Helm Chart repo or one of your own making?

It would help a lot with installing this if we didn't have to commit a clone of this repo to our own VCS just to use the helm chart :)

docs: external_metrics vs custometric

Trying to understand the difference or historical evolution? from A.) external_metrics with embedded query as part of the wpa resource spec to B.) external_metrics referencing custom metric defined as dedicated

A.)

apiVersion: datadoghq.com/v1alpha1
kind: WatermarkPodAutoscaler
metadata:
  name: {{ .Chart.Name }}
  namespace: {{ .Release.Namespace }}
spec:
  metrics:
    - type: External
      external:
      metricName: "<METRIC_NAME>"
      metricSelector:
        matchLabels:
          <TAG_KEY>: <TAG_VALUE>

B.)

apiVersion: datadoghq.com/v1alpha1
kind: DatadogMetric
metadata:
  name: your_datadogmetric_name
  namespace: {{ .Release.Namespace }}
  labels:
    {{- include "labels" . | indent 4 }}
spec:
  query: avg:kubernetes.cpu.usage{app:myapp,release:myapp}.rollup(30)
apiVersion: datadoghq.com/v1alpha1
kind: WatermarkPodAutoscaler
metadata:
  name: {{ .Chart.Name }}
  namespace: {{ .Release.Namespace }}
spec:
  metrics:
    - type: External
      external:
        metricName: "datadogmetric@{{ .Release.Namespace }}:your_datadogmetric_name"

https://docs.datadoghq.com/agent/cluster_agent/external_metrics/#set-up-an-hpa-to-use-a-datadogmetric-object

1.) Is it like that B is the new version to spec metrics used in wpa instead of A since Kubernetes v1.2 allows such?
2.) Why does B outweights A, in features, does it? Is A no longer best practice or even to be sundowned?
3.) Can instead defining a emtric resource via k8 manifest also use the beta datadog ui feature to create custom metric as "your_datadogmetric_name" and it is then referenceable in any wpa resource spec as well?
4.) If i change the query live in ui for an already depliyed wpa using it, how fast will it be pulled?
5.) Does the in the query used "labels" will match always to the label i specified on the application i want to apply the metric filter on (e.g deployemnt.metadata.labels ?
6.) Creating new custom metric either via UI or k8 manifest - which tags can they filter on (e.g pods, deployments, deamons set)

Resource type WPA metrics do not appear to be averaging correctly

Describe what happened:
Resource type WPA metrics do not appear to be calculating average values, rather they are calculating totals.

Describe what you expected:
I expect the values to be averaged.

> k top pod
NAME                                       CPU(cores)   MEMORY(bytes)   
ingress-nginx-controller-64dd76d79-lfckl   7m           122Mi           
ingress-nginx-controller-64dd76d79-rzxvc   8m           124Mi           
 
> k describe wpa nginx-wpa | grep -A 1 "Current Average Value"
      Current Average Value:  16m
      Name:                   cpu
--
      Current Average Value:  258920448
      Name:                   memory

Constant errors

I went ahead and applied the contents of deploy/ to get a test of this running. Created a wpa for a deployment.

I got various errors regarding lacking rbac permissions in the provided role added a few (deployment,replicaset,statefulset get/list/watch, service, create/update/get). That didn't solve problems though. Checked and saw that your provided yamls apply version v0.0.1, went ahead and set it up to use v0.1.0 instead. Now I'm getting the following errors:

{"level":"info","ts":1578589126.4794915,"logger":"cmd","msg":"Version: 0.0.1"}
{"level":"info","ts":1578589126.4795249,"logger":"cmd","msg":"Build time: "}
{"level":"info","ts":1578589126.4795303,"logger":"cmd","msg":"Git tag: "}
{"level":"info","ts":1578589126.4795349,"logger":"cmd","msg":"Git Commit: "}
{"level":"info","ts":1578589126.4795387,"logger":"cmd","msg":"Go Version: go1.13.4"}
{"level":"info","ts":1578589126.4795427,"logger":"cmd","msg":"Go OS/Arch: linux/amd64"}
{"level":"info","ts":1578589126.4795468,"logger":"cmd","msg":"Version of operator-sdk: v0.12.0"}
{"level":"info","ts":1578589126.479719,"logger":"leader","msg":"Trying to become the leader."}
{"level":"info","ts":1578589127.4483173,"logger":"leader","msg":"No pre-existing lock was found."}
{"level":"info","ts":1578589127.453766,"logger":"leader","msg":"Became the leader."}
{"level":"info","ts":1578589128.408475,"logger":"controller-runtime.metrics","msg":"metrics server is starting to listen","addr":"0.0.0.0:8383"}
{"level":"info","ts":1578589128.4087286,"logger":"cmd","msg":"Registering Components."}
{"level":"info","ts":1578589128.4106596,"logger":"controller-runtime.controller","msg":"Starting EventSource","controller":"watermarkpodautoscaler-controller","source":"kind source: /, Kind="}
{"level":"info","ts":1578589128.4107704,"logger":"cmd","msg":"Starting the Cmd."}
{"level":"info","ts":1578589128.4110043,"logger":"controller-runtime.manager","msg":"starting metrics server","path":"/metrics"}
{"level":"info","ts":1578589128.5111277,"logger":"controller-runtime.controller","msg":"Starting Controller","controller":"watermarkpodautoscaler-controller"}
{"level":"info","ts":1578589128.6113448,"logger":"controller-runtime.controller","msg":"Starting workers","controller":"watermarkpodautoscaler-controller","worker count":1}
{"level":"info","ts":1578589128.6114364,"logger":"wpa_controller","msg":"Reconciling WatermarkPodAutoscaler","Request.Namespace":"default","Request.Name":"statsdgenerator-wpa"}
E0109 16:58:49.515122       1 memcache.go:199] couldn't get resource list for external.metrics.k8s.io/v1beta1: Got empty response for: external.metrics.k8s.io/v1beta1
{"level":"error","ts":1578589129.5824547,"logger":"wpa_controller","msg":"RunTime error in reconcileWPA","Request.Namespace":"default","Request.Name":"statsdgenerator-wpa","returnValue":"runtime error: invalid memory address or nil pointer dereference","error":"recover error","stacktrace":"github.com/go-logr/zapr.(*zapLogger).Error\n\twatermarkpodautoscaler/vendor/github.com/go-logr/zapr/zapr.go:128\ngithub.com/DataDog/watermarkpodautoscaler/pkg/controller/watermarkpodautoscaler.(*ReconcileWatermarkPodAutoscaler).reconcileWPA.func1\n\twatermarkpodautoscaler/pkg/controller/watermarkpodautoscaler/watermarkpodautoscaler_controller.go:360\nruntime.gopanic\n\t/usr/local/Cellar/go/1.13.4/libexec/src/runtime/panic.go:679\nruntime.panicmem\n\t/usr/local/Cellar/go/1.13.4/libexec/src/runtime/panic.go:199\nruntime.sigpanic\n\t/usr/local/Cellar/go/1.13.4/libexec/src/runtime/signal_unix.go:394\ngithub.com/DataDog/watermarkpodautoscaler/pkg/controller/watermarkpodautoscaler.(*ReconcileWatermarkPodAutoscaler).reconcileWPA\n\twatermarkpodautoscaler/pkg/controller/watermarkpodautoscaler/watermarkpodautoscaler_controller.go:379\ngithub.com/DataDog/watermarkpodautoscaler/pkg/controller/watermarkpodautoscaler.(*ReconcileWatermarkPodAutoscaler).Reconcile\n\twatermarkpodautoscaler/pkg/controller/watermarkpodautoscaler/watermarkpodautoscaler_controller.go:344\nsigs.k8s.io/controller-runtime/pkg/internal/controller.(*Controller).reconcileHandler\n\twatermarkpodautoscaler/vendor/sigs.k8s.io/controller-runtime/pkg/internal/controller/controller.go:216\nsigs.k8s.io/controller-runtime/pkg/internal/controller.(*Controller).processNextWorkItem\n\twatermarkpodautoscaler/vendor/sigs.k8s.io/controller-runtime/pkg/internal/controller/controller.go:192\nsigs.k8s.io/controller-runtime/pkg/internal/controller.(*Controller).worker\n\twatermarkpodautoscaler/vendor/sigs.k8s.io/controller-runtime/pkg/internal/controller/controller.go:171\nk8s.io/apimachinery/pkg/util/wait.JitterUntil.func1\n\twatermarkpodautoscaler/vendor/k8s.io/apimachinery/pkg/util/wait/wait.go:152\nk8s.io/apimachinery/pkg/util/wait.JitterUntil\n\twatermarkpodautoscaler/vendor/k8s.io/apimachinery/pkg/util/wait/wait.go:153\nk8s.io/apimachinery/pkg/util/wait.Until\n\twatermarkpodautoscaler/vendor/k8s.io/apimachinery/pkg/util/wait/wait.go:88"}

Thoughts?

Change dryRun value using helm chart

Describe what happened:
We deploy WPA object for our services using a helm chart. This chart contains a manifest template that manage the WPA objects.
Whatever is the value we define for dryRun attribute (false/true, on/off, empty value) if someone set it to true using kubectl, the value is never reset to false when we update the chart release.

Describe what you expected:
Setting dryRun to false in the WPA manifest should set the value to false when the manifest is applied by helm.
This works fine using the kubectl providen in the README file

Steps to reproduce the issue:

  • Deploy a WPA with dryRun=false
  • change dryRun to true using kubectl
  • Deploy the WPA again with the same manifest.
    The value will still be true.

Additional environment details (Kubernetes version, etc):

  • latest release datadog chart
  • latest release WPA chart
  • kubernetes version 1.21

WPA doesn't build on M1

  • hack/install-wwhrd.sh fails to install an ARM64 version (the amd64 version works, there's probably a new release as well)
  • hack/install-yq.sh fails to install an ARM64 version (the amd64 version works, we need to move to yq 4 to have an arm64 version)
  • We need go install sigs.k8s.io/controller-tools/cmd/[email protected] instead of go get
  • etcd is not installed by install-tools but required for the tests
  • hack/install-kubebuilder.sh only copy the kubebuilder binary and forgets the assets (etcd/kube-apiserver). Downloading the amd64 version and replacing etcd by an arm64 version works
  • make e2e doesn't work, the pod says runtime: failed to create new OS thread (have 2 already; errno=22)

multiple metrics with must and should requirements

I read the doc and did not yet get an idea what happens if i would combine multiple metrics even of the same type
external and resource.
What is possible and how will it behave? Given these examples

1.)
I think i understood if you use type external only one is allowed.

 - external:
      highWatermark: 400m
      lowWatermark: 150m
      metricName: custom.request_duration.max
      metricSelector:
        matchLabels:
          app: {{ .Chart.Name }}
          release: {{ .Release.Name }}

2.) But what if use resource? Can i have two metrics e.g.

 - Resource:
    resource:
      name: memory
      target:
        type: Utilization
        averageUtilization: 85%
    type: Resource
- Resource:
    resource:
      name: cpu
      target:
        type: Utilization
        averageUtilization: 90%
    type: Resource

And what happens if memory is at 90% and cpu at 50%? Will it scale up or down?

3.) And if i even mix kinds?

    1. prior never downscale based on mem but make sure memory stays below 85% always
    1. prio scale dynamically based on cores utlization
      Which one of a. and b. will full above requirement?

a.)

 - external:
      highWatermark: 90
      lowWatermark: 60
      metricName: kubernetes.cpu.usage
      metricSelector:
        matchLabels:
          app: {{ .Chart.Name }}
          release: {{ .Release.Name }}
 - Resource:
    resource:
      name: memory
      target:
        type: Utilization
        averageUtilization: 85%
    type: Resource

b.)

 - external: 
      highWatermark: 85
      lowWatermark: 0
      metricName: kubernetes.ememoty.usage
      metricSelector:
        matchLabels:
          app: {{ .Chart.Name }}
          release: {{ .Release.Name }}
 - Resource:
    resource:
      name: memory
      target:
        type: Utilization
        averageUtilization: 85%
    type: Resource

4.) What if i mix and create contra dictionary requirements

 - external:
      highWatermark: 80
      lowWatermark: 40
      metricName: kubernetes.cpu.usage
      metricSelector:
        matchLabels:
          app: {{ .Chart.Name }}
          release: {{ .Release.Name }}
- Resource:
    resource:
      name: cpu
      target:
        type: Utilization
        averageUtilization: 90%
    type: Resource

unable to fetch metrics from external metrics API: Internal error occurred: DatadogMetric is invalid, err: Invalid metric (from backend)

{"level":"info","ts":1624011129.786673,"logger":"controllers.WatermarkPodAutoscaler","msg":"Failed to compute desired number of replicas based on listed metrics.","watermarkpodautoscaler":"dev/myapp","reference":"Deployment/dev/myapp","error":"failed to get external metric kubernetes.cpu.usage: unable to get external metric dev/kubernetes.cpu.usage/&LabelSelector{MatchLabels:map[string]string{app: myapp,release: myapp,},MatchExpressions:[]LabelSelectorRequirement{},}: unable to fetch metrics from external metrics API: Internal error occurred: DatadogMetric is invalid, err: Invalid metric (from backend), query: avg:kubernetes.cpu.usage{app:myapp,release:myapp}.rollup(30)"}
{"level":"info","ts":1624011144.793971,"logger":"controllers.WatermarkPodAutoscaler","msg":"Target deploy","watermarkpodautoscaler":"dev/myapp","replicas":2}
{"level":"info","ts":1624011144.7941537,"logger":"controllers.WatermarkPodAutoscaler","msg":"getReadyPodsCount","watermarkpodautoscaler":"dev/myapp","full podList length":2,"toleratedAsReadyPodCount":2,"incorrectly targeted pods":0}
{"level":"info","ts":1624011144.8295028,"logger":"controllers.WatermarkPodAutoscaler","msg":"Failed to compute desired number of replicas based on listed metrics.","watermarkpodautoscaler":"dev/myapp","reference":"Deployment/dev/myapp","error":"failed to get external metric kubernetes.cpu.usage: unable to get external metric dev/kubernetes.cpu.usage/&LabelSelector{MatchLabels:map[string]string{app: myapp,release: myapp,},MatchExpressions:[]LabelSelectorRequirement{},}: unable to fetch metrics from external metrics API: Internal error occurred: DatadogMetric is invalid, err: Invalid metric (from backend), query: avg:kubernetes.cpu.usage{app:myapp,release:myapp}.rollup(30)"}
{"level":"info","ts":1624011159.8374639,"logger":"controllers.WatermarkPodAutoscaler","msg":"Target deploy","watermarkpodautoscaler":"dev/myapp","replicas":2}

Ask for metric (without tags)

% kubectl get --raw "/apis/external.metrics.k8s.io/v1beta1/namespaces/dev/kubernetes.cpu.usage | jq ."
Error from server (InternalError): Internal error occurred: DatadogMetric not found for metric name: kubernetes.cpu.usage | jq ., datadogmetricid: datadog/dcaautogen-646a73ad876299907eb8035a2fa8e2b60ac832

Impersonate and ask for any metric

% kubectl get --raw "/apis/external.metrics.k8s.io/v1beta1/namespaces/dev/metric --as system:serviceaccount:dev:watermarkpodautoscaler"
Error from server (InternalError): Internal error occurred: DatadogMetric not found for metric name: metric --as system:serviceaccount:dev:watermarkpodautoscaler, datadogmetricid: datadog/dcaautogen-98eae079d0f4a80135d6f4b6f9762cea878b97

What did i wrong?
How can i general find out which metrics and which tags for it are available?

documentation: quantities and metric relation, case sensitiveness, metric context/selection

quantities and metric relation

Taken from the docs..
"They are specified as Quantities, so you can use m | "" | k | M | G | T | P | E to easily represent the value you want to use."

The above sentence quotes that highWatermark and lowWatermark values can or must? be extended by quantity.
I assume its dependent on the type of metric.

What type of quantity is "" ?
What about percent values like i think it shall be able to use all kind of metrics which have a defined max and a min value like e.g kubernetes.memory.usage_pct or kubernetes.cpu.usage_pct. Do i need to set only the value 90 or 90% ?

If i don't add a quantity but just the number, will it take a default (which) or will it fail?

case sensitiveness

There are different metrics i can use . eg.

The docker Metrics e.g "Memory" have upper case. Is there generally any case sensitiveness ?

metric context/selection

Taking above two metric sources - system/docker and kubernetes - i could use
similar metrics from both e.g system.mem.used vs kubernetes.memory.usage
If i deploy a resource wpa

      metricSelector:
        matchLabels:
          app: {{ .Chart.Name }}
          release: {{ .Release.Name }}

will the both metric measurements be scoped to the container level per pod or do they have different scopes and which?

Which of these might be the better choice to control the scale

WPA controller was unable to update the number of replicas: status.currentMetrics in body must be of type array: "null"

Hello 👋

We're trying to take the WPA into use, but we keep seeing this error message:

{
	"level": "error",
	"ts": 1594040003.47035,
	"logger": "wpa_controller",
	"msg": "The WPA controller was unable to update the number of replicas",
	"Request.Namespace": "web-services-staging",
	"Request.Name": "nextapi",
	"error": "WatermarkPodAutoscaler.datadoghq.com \"nextapi\" is invalid: []: Invalid value: map[string]interface {}{\"apiVersion\":\"datadoghq.com/v1alpha1\", \"kind\":\"WatermarkPodAutoscaler\", \"metadata\":map[string]interface {}{\"annotations\":map[string]interface {}{\"meta.helm.sh/release-name\":\"nextapi\", \"meta.helm.sh/release-namespace\":\"web-services-staging\"}, \"creationTimestamp\":\"2020-07-06T12:49:21Z\", \"generation\":2, \"labels\":map[string]interface {}{\"app\":\"nextapi\", \"app.kubernetes.io/managed-by\":\"Helm\", \"chart\":\"mozart-0.4.0\", \"env\":\"staging\", \"heritage\":\"Helm\", \"region\":\"eu-west-1\", \"release\":\"nextapi\", \"stage\":\"staging\"}, \"name\":\"nextapi\", \"namespace\":\"web-services-staging\", \"resourceVersion\":\"124372418\", \"uid\":\"51196075-0345-4839-8526-3cf805be0376\"}, \"spec\":map[string]interface {}{\"algorithm\":\"absolute\", \"downscaleForbiddenWindowSeconds\":60, \"maxReplicas\":50, \"metrics\":[]interface {}{map[string]interface {}{\"external\":map[string]interface {}{\"highWatermark\":\"1\", \"lowWatermark\":\"0\", \"metricName\":\"php_fpm.listen_queue.size\", \"metricSelector\":map[string]interface {}{\"matchLabels\":map[string]interface {}{\"app\":\"nextapi\", \"region\":\"eu-west-1\", \"stage\":\"staging\"}}}, \"type\":\"External\"}}, \"minReplicas\":2, \"scaleDownLimitFactor\":30, \"scaleTargetRef\":map[string]interface {}{\"apiVersion\":\"apps/v1\", \"kind\":\"Deployment\", \"name\":\"nextapi\"}, \"scaleUpLimitFactor\":50, \"tolerance\":0.01, \"upscaleForbiddenWindowSeconds\":30}, \"status\":map[string]interface {}{\"conditions\":[]interface {}{map[string]interface {}{\"lastTransitionTime\":\"2020-07-06T12:53:23Z\", \"message\":\"Scaling changes can be applied\", \"reason\":\"DryRun mode disabled\", \"status\":\"False\", \"type\":\"DryRun\"}, map[string]interface {}{\"lastTransitionTime\":\"2020-07-06T12:53:23Z\", \"message\":\"the WPA controller was able to get the target's current scale\", \"reason\":\"SucceededGetScale\", \"status\":\"True\", \"type\":\"AbleToScale\"}, map[string]interface {}{\"lastTransitionTime\":\"2020-07-06T12:53:23Z\", \"message\":\"the HPA was unable to compute the replica count: unable to get external metric web-services-staging/php_fpm.listen_queue.size/&LabelSelector{MatchLabels:map[string]string{app: nextapi,region: eu-west-1,stage: staging,},MatchExpressions:[],}: unable to fetch metrics from external metrics API: the server is currently unable to handle the request (get php_fpm.listen_queue.size.external.metrics.k8s.io)\", \"reason\":\"FailedGetExternalMetric\", \"status\":\"False\", \"type\":\"ScalingActive\"}}, \"currentMetrics\":interface {}(nil), \"currentReplicas\":2, \"desiredReplicas\":0}}: validation failure list:\nstatus.currentMetrics in body must be of type array: \"null\"",
	"stacktrace": "github.com/go-logr/zapr.(*zapLogger).Error\n\twatermarkpodautoscaler/vendor/github.com/go-logr/zapr/zapr.go:128\ngithub.com/DataDog/watermarkpodautoscaler/pkg/controller/watermarkpodautoscaler.(*ReconcileWatermarkPodAutoscaler).reconcileWPA\n\twatermarkpodautoscaler/pkg/controller/watermarkpodautoscaler/watermarkpodautoscaler_controller.go:428\ngithub.com/DataDog/watermarkpodautoscaler/pkg/controller/watermarkpodautoscaler.(*ReconcileWatermarkPodAutoscaler).Reconcile\n\twatermarkpodautoscaler/pkg/controller/watermarkpodautoscaler/watermarkpodautoscaler_controller.go:344\nsigs.k8s.io/controller-runtime/pkg/internal/controller.(*Controller).reconcileHandler\n\twatermarkpodautoscaler/vendor/sigs.k8s.io/controller-runtime/pkg/internal/controller/controller.go:216\nsigs.k8s.io/controller-runtime/pkg/internal/controller.(*Controller).processNextWorkItem\n\twatermarkpodautoscaler/vendor/sigs.k8s.io/controller-runtime/pkg/internal/controller/controller.go:192\nsigs.k8s.io/controller-runtime/pkg/internal/controller.(*Controller).worker\n\twatermarkpodautoscaler/vendor/sigs.k8s.io/controller-runtime/pkg/internal/controller/controller.go:171\nk8s.io/apimachinery/pkg/util/wait.JitterUntil.func1\n\twatermarkpodautoscaler/vendor/k8s.io/apimachinery/pkg/util/wait/wait.go:152\nk8s.io/apimachinery/pkg/util/wait.JitterUntil\n\twatermarkpodautoscaler/vendor/k8s.io/apimachinery/pkg/util/wait/wait.go:153\nk8s.io/apimachinery/pkg/util/wait.Until\n\twatermarkpodautoscaler/vendor/k8s.io/apimachinery/pkg/util/wait/wait.go:88"
}

This is our WPA definition:

apiVersion: datadoghq.com/v1alpha1
kind: WatermarkPodAutoscaler
metadata:
  name: nextapi
  labels:
    app: nextapi
    chart: mozart-0.4.0
    release: nextapi
    heritage: Helm
    env: staging
    region: eu-west-1
    stage: staging
spec:
  scaleTargetRef:
    apiVersion: apps/v1
    kind: Deployment
    name: nextapi
  downscaleForbiddenWindowSeconds: 60
  upscaleForbiddenWindowSeconds: 30
  scaleDownLimitFactor: 30
  scaleUpLimitFactor: 50
  minReplicas: 2
  maxReplicas: 50
  metrics:
    - external:
        highWatermark: "1"
        lowWatermark: "0"
        metricName: php_fpm.listen_queue.size
        metricSelector:
          matchLabels:
            app: nextapi
            stage: staging
            region: eu-west-1
      type: External
  tolerance: 0.01

Recommend Projects

  • React photo React

    A declarative, efficient, and flexible JavaScript library for building user interfaces.

  • Vue.js photo Vue.js

    🖖 Vue.js is a progressive, incrementally-adoptable JavaScript framework for building UI on the web.

  • Typescript photo Typescript

    TypeScript is a superset of JavaScript that compiles to clean JavaScript output.

  • TensorFlow photo TensorFlow

    An Open Source Machine Learning Framework for Everyone

  • Django photo Django

    The Web framework for perfectionists with deadlines.

  • D3 photo D3

    Bring data to life with SVG, Canvas and HTML. 📊📈🎉

Recommend Topics

  • javascript

    JavaScript (JS) is a lightweight interpreted programming language with first-class functions.

  • web

    Some thing interesting about web. New door for the world.

  • server

    A server is a program made to process requests and deliver data to clients.

  • Machine learning

    Machine learning is a way of modeling and interpreting data that allows a piece of software to respond intelligently.

  • Game

    Some thing interesting about game, make everyone happy.

Recommend Org

  • Facebook photo Facebook

    We are working to build community through open source technology. NB: members must have two-factor auth.

  • Microsoft photo Microsoft

    Open source projects and samples from Microsoft.

  • Google photo Google

    Google ❤️ Open Source for everyone.

  • D3 photo D3

    Data-Driven Documents codes.