Scales are a convenient abstraction for a fundamental task in visualization: mapping a dimension of abstract data to a visual representation. Although most often used for position-encoding quantitative data, such as mapping a measurement in meters to a position in pixels for dots in a scatterplot, scales can represent virtually any visual encoding, such as diverging colors, stroke widths, or symbol size. Scales can also be used with virtually any type of data, such as named categorical data or discrete data that requires sensible breaks.
For continuous quantitative data, you typically want a linear scale. (For time series data, a time scale.) If the distribution calls for it, consider transforming data using a power or log scale. A quantize scale may aid differentiation by rounding continuous data to a fixed set of discrete values; similarly, a quantile scale computes quantiles from a sample population, and a threshold scale allows you to specify arbitrary breaks in continuous data. Several built-in sequential color scales are also provided. (If you don’t like these palettes, try ColorBrewer.)
For discrete ordinal (ordered) or categorical (unordered) data, an ordinal scale specifies an explicit mapping from a set of data values to a corresponding set of visual attributes (such as colors). The related band and point scales are useful for position-encoding ordinal data, such as bars in a bar chart or dots in an categorical scatterplot. Several built-in categorical color scales are also provided.
Scales have no intrinsic visual representation. However, most scales can generate and format ticks for reference marks to aid in the construction of axes.
For a longer introduction, see these recommended tutorials:
-
Introducing d3-scale by Mike Bostock
-
Chapter 7. Scales of Interactive Data Visualization for the Web by Scott Murray
-
d3: scales, and color. by Jérôme Cukier
If you use NPM, npm install d3-scale. Otherwise, download the latest release. The released bundle supports AMD, CommonJS, and vanilla environments. Create a custom build using Rollup or your preferred bundler. You can also load directly from d3js.org:
<script src="https://d3js.org/d3-array.v0.6.min.js"></script>
<script src="https://d3js.org/d3-color.v0.3.min.js"></script>
<script src="https://d3js.org/d3-format.v0.4.min.js"></script>
<script src="https://d3js.org/d3-interpolate.v0.3.min.js"></script>
<script src="https://d3js.org/d3-time.v0.1.min.js"></script>
<script src="https://d3js.org/d3-time-format.v0.2.min.js"></script>
<script src="https://d3js.org/d3-scale.v0.4.min.js"></script>
(If you’re not using time scales, you can omit d3-time and d3-time-format.) In a vanilla environment, a d3_scale global is exported. Try d3-scale in your browser.
- Continuous (Linear, Power, Log, Identity, Time)
- Sequential Color
- Quantize
- Quantile
- Threshold
- Ordinal (Band, Point)
- Categorical Color
Continuous scales map a continuous, quantitative input domain to a continuous output range. If the range is also numeric, the mapping may be inverted. A continuous scale is not constructed directly; instead, try a linear, power, log, identity, time or sequential color scale.
# continuous(value)
Given a value from the domain, returns the corresponding value from the range. If the given value is outside the domain, and clamping is not enabled, the mapping may be extrapolated such that the returned value is outside the range. For example, to apply a position encoding:
var x = d3_scale.linear()
    .domain([10, 130])
    .range([0, 960]);

x(20); // 80
x(50); // 320
Or to apply a color encoding:
var color = d3_scale.linear()
    .domain([10, 100])
    .range(["brown", "steelblue"]);

color(20); // "#9a3439"
color(50); // "#7b5167"
# continuous.invert(value)
Given a value from the range, returns the corresponding value from the domain. Inversion is useful for interaction, say to determine the data value corresponding to the position of the mouse. For example, to invert a position encoding:
var x = d3_scale.linear()
    .domain([10, 130])
    .range([0, 960]);

x.invert(80); // 20
x.invert(320); // 50
If the given value is outside the range, and clamping is not enabled, the mapping may be extrapolated such that the returned value is outside the domain. This method is only supported if the range is numeric. If the range is not numeric, returns NaN.
For a valid value y in the range, continuous(continuous.invert(y)) approximately equals y; similarly, for a valid value x in the domain, continuous.invert(continuous(x)) approximately equals x. The scale and its inverse may not be exact due to the limitations of floating point precision.
# continuous.domain([domain])
If domain is specified, sets the scale’s domain to the specified array of numbers. The array must contain two or more elements. If the elements in the given array are not numbers, they will be coerced to numbers. If domain is not specified, returns a copy of the scale’s current domain.
Although continuous scales typically have two values each in their domain and range, specifying more than two values produces a piecewise scale. For example, to create a diverging color scale that interpolates between white and red for negative values, and white and green for positive values, say:
var color = d3_scale.linear()
    .domain([-1, 0, 1])
    .range(["red", "white", "green"]);

color(-0.5); // "#ff8080"
color(+0.5); // "#80c080"
Internally, a piecewise scale performs a binary search for the range interpolator corresponding to the given domain value. Thus, the domain must be in ascending or descending order. If the domain and range have different lengths N and M, only the first min(N,M) elements in each are observed.
# continuous.range([range])
If range is specified, sets the scale’s range to the specified array of values. The array must contain two or more elements. Unlike the domain, elements in the given array need not be numbers; any value that is supported by the underlying interpolator will work, though note that numeric ranges are required for invert. If range is not specified, returns a copy of the scale’s current range. See continuous.interpolate for more examples.
# continuous.rangeRound([range])
Sets the scale’s range to the specified array of values while also setting the scale’s interpolator to d3-interpolate’s round. This is a convenience method equivalent to:
continuous
    .range(range)
    .interpolate(d3_interpolate.round);
The rounding interpolator is sometimes useful for avoiding antialiasing artifacts, though also consider the shape-rendering “crispEdges” styles. Note that this interpolator can only be used with numeric ranges.
# continuous.clamp(clamp)
If clamp is specified, enables or disables clamping accordingly. If clamping is disabled and the scale is passed a value outside the domain, the scale may return a value outside the range through extrapolation. If clamping is enabled, the return value of the scale is always within the scale’s range. Clamping similarly applies to continuous.invert. For example:
var x = d3_scale.linear()
    .domain([10, 130])
    .range([0, 960]);

x(-10); // -160, outside range
x.invert(-160); // -10, outside domain

x.clamp(true);
x(-10); // 0, clamped to range
x.invert(-160); // 10, clamped to domain
If clamp is not specified, returns whether or not the scale currently clamps values to within the range.
# continuous.interpolate(interpolate[, parameters…])
If interpolate is specified, sets the scale’s range interpolator factory. This interpolator factory is used to create interpolators for each adjacent pair of values from the range; these interpolators then map a normalized domain parameter t in [0, 1] to the corresponding value in the range. If factory is not specified, returns the scale’s current interpolator factory, which defaults to d3-interpolate’s value. See d3-interpolate for more interpolators.
For example, consider a diverging color scale with three colors in the range:
var color = d3_scale.linear()
    .domain([-100, 0, +100])
    .range(["red", "white", "green"]);
Two interpolators are created internally by the scale, equivalent to:
var i0 = d3_interpolate.value("red", "white"),
    i1 = d3_interpolate.value("white", "green");
A common reason to specify a custom interpolator is to change the color space of interpolation. For example, to use HCL:
var color = d3_scale.linear()
    .domain([10, 100])
    .range(["brown", "steelblue"])
    .interpolate(d3_interpolate.hcl);
Note: the default value interpolator may reuse return values. For example, if the range values are objects, then the value interpolator always returns the same object, modifying it in-place. If the scale is used to set an attribute or style, this is typically acceptable (and desirable for performance); however, if you need to store the scale’s return value, you must specify your own interpolator or make a copy as appropriate.
# continuous.ticks([count])
Returns approximately count representative values from the scale’s domain. If count is not specified, it defaults to 10. The returned tick values are uniformly spaced, have human-readable values (such as multiples of powers of 10), and are guaranteed to be within the extent of the domain. Ticks are often used to display reference lines, or tick marks, in conjunction with the visualized data. The specified count is only a hint; the scale may return more or fewer values depending on the domain. See also d3-array’s ticks.
# continuous.tickFormat([count[, specifier]])
Returns a number format function suitable for displaying a tick value, automatically computing the appropriate precision based on the fixed interval between tick values. The specified count should have the same value as the count that is used to generate the tick values.
An optional specifier allows a custom format where the precision of the format is automatically set by the scale as appropriate for the tick interval. For example, to format percentage change, you might say:
var x = d3_scale.linear()
    .domain([-1, 1])
    .range([0, 960]);

var ticks = x.ticks(5),
    tickFormat = x.tickFormat(5, "+%");

ticks.map(tickFormat); // ["-100%", "-50%", "+0%", "+50%", "+100%"]
If specifier uses the format type s, the scale will return a SI-prefix format based on the largest value in the domain. If the specifier already specifies a precision, this method is equivalent to locale.format.
# continuous.nice([count])
Extends the domain so that it starts and ends on nice round values. This method typically modifies the scale’s domain, and may only extend the bounds to the nearest round value. An optional tick count argument allows greater control over the step size used to extend the bounds, guaranteeing that the returned ticks will exactly cover the domain. Nicing is useful if the domain is computed from data, say using extent, and may be irregular. For example, for a domain of [0.201479…, 0.996679…], a nice domain might be [0.2, 1.0]. If the domain has more than two values, nicing the domain only affects the first and last value. See also d3-array’s tickStep.
# continuous.copy()
Returns an exact copy of this scale. Changes to this scale will not affect the returned scale, and vice versa.
# d3_scale.linear()
Constructs a new continuous scale with the unit domain [0, 1], the unit range [0, 1], a value interpolator and clamping disabled. Linear scales are a good default choice for continuous quantitative data because they preserve proportional differences. Each range value y can be expressed as a function of the domain value x: y = mx + b.
Power scales are similar to linear scales, except an exponential transform is applied to the input domain value before the output range value is computed. Each range value y can be expressed as a function of the domain value x: y = mx^k + b, where k is the exponent value. Power scales also support negative domain values, in which case the input value and the resulting output value are multiplied by -1.
# d3_scale.pow()
Constructs a new continuous scale with the unit domain [0, 1], the unit range [0, 1], the exponent 1, a value interpolator and clamping disabled. (Note that this is effectively a linear scale until you set a different exponent.)
# pow.exponent([exponent])
If exponent is specified, sets the current exponent to the given numeric value. If exponent is not specified, returns the current exponent, which defaults to 1. (Note that this is effectively a linear scale until you set a different exponent.)
# d3_scale.sqrt()
Constructs a new continuous power scale with the unit domain [0, 1], the unit range [0, 1], the exponent 0.5, a value interpolator and clamping disabled. This is a convenience method equivalent to d3_scale.pow().exponent(0.5).
Log scales are similar to linear scales, except a logarithmic transform is applied to the input domain value before the output range value is computed. The mapping to the range value y can be expressed as a function of the domain value x: y = m log(x) + b.
As log(0) = -∞, a log scale domain must be strictly-positive or strictly-negative; the domain must not include or cross zero. A log scale with a positive domain has a well-defined behavior for positive values, and a log scale with a negative domain has a well-defined behavior for negative values. (For a negative domain, input and output values are implicitly multiplied by -1.) The behavior of the scale is undefined if you pass a negative value to a log scale with a positive domain or vice versa.
# d3_scale.log()
Constructs a new continuous scale with the domain [1, 10], the unit range [0, 1], the base 10, a value interpolator and clamping disabled.
# log.base([base])
If base is specified, sets the base for this logarithmic scale to the specified value. If base is not specified, returns the current base, which defaults to 10.
# log.nice()
Like continuous.nice, except extends the domain to integer powers of base. For example, for a domain of [0.201479…, 0.996679…], and base 10, the nice domain is [0.1, 1]. If the domain has more than two values, nicing the domain only affects the first and last value.
# log.ticks([count])
Like continuous.ticks, but customized for a log scale. If the base is an integer, the returned ticks are uniformly spaced within each integer power of base; otherwise, one tick per power of base is returned. The returned ticks are guaranteed to be within the extent of the domain. If the orders of magnitude in the domain is greater than count, then at most one tick per power is returned. Otherwise, the tick values are unfiltered, but note that you can use log.tickFormat to filter the display of tick lables. If count is not specified, it defaults to 10.
# log.tickFormat([count[, specifier]])
Like continuous.tickFormat, but customized for a log scale. If a count is specified, then the formatter may return the empty string for some of the tick labels; this is useful if there is not enough room to fit all of the tick labels, but you still want to display the tick marks to show the log scale distortion. When specifying a count, you may also provide a format specifier or format function. For example, to get a tick formatter that will display 20 ticks of a currency, say log.tickFormat(20, "$,f"). If the specifier does not have a defined precision, the precision will be set automatically by the scale, returning the appropriate format. This provides a convenient, declarative way of specifying a format whose precision will be automatically set by the scale.
Identity scales are a special case of linear scales where the domain and range are identical; the scale and its invert method are thus the identity function. These scales are occasionally useful when working with pixel coordinates, say in conjunction with an axis or brush. Identity scales do not support rangeRound, clamp or interpolate.
# d3_scale.identity()
Constructs a new identity scale with the unit domain [0, 1] and the unit range [0, 1].
Time scales are a variant of linear scales that have a temporal domain: domain values are coerced to dates rather than numbers, and invert likewise returns a date. Time scales implement ticks based on calendar intervals, taking the pain out of generating axes for temporal domains.
For example, to create a position encoding:
var x = d3_scale.time()
    .domain([new Date(2000, 0, 1), new Date(2000, 0, 2)])
    .range([0, 960]);

x(new Date(2000, 0, 1,  5)); // 200
x(new Date(2000, 0, 1, 16)); // 640
x.invert(200); // Sat Jan 01 2000 05:00:00 GMT-0800 (PST)
x.invert(640); // Sat Jan 01 2000 16:00:00 GMT-0800 (PST)
For a valid value y in the range, time(time.invert(y)) equals y; similarly, for a valid value x in the domain, time.invert(time(x)) equals x. The invert method is useful for interaction, say to determine the value in the domain that corresponds to the pixel location under the mouse.
# d3_scale.time()
Constructs a new time scale with the domain [2000-01-01, 2000-01-02], the unit range [0, 1], a value interpolator and clamping disabled.
# time.ticks([count])
# time.ticks([interval[, step]])
Returns representative dates from the scale’s domain. The returned tick values are uniformly-spaced (mostly), have sensible values (such as every day at midnight), and are guaranteed to be within the extent of the domain. Ticks are often used to display reference lines, or tick marks, in conjunction with the visualized data.
An optional count may be specified to affect how many ticks are generated. If count is not specified, it defaults to 10. The specified count is only a hint; the scale may return more or fewer values depending on the domain. For example, to create ten default ticks, say:
var x = d3_scale.time();

x.ticks(10);
// [Sat Jan 01 2000 00:00:00 GMT-0800 (PST),
//  Sat Jan 01 2000 03:00:00 GMT-0800 (PST),
//  Sat Jan 01 2000 06:00:00 GMT-0800 (PST),
//  Sat Jan 01 2000 09:00:00 GMT-0800 (PST),
//  Sat Jan 01 2000 12:00:00 GMT-0800 (PST),
//  Sat Jan 01 2000 15:00:00 GMT-0800 (PST),
//  Sat Jan 01 2000 18:00:00 GMT-0800 (PST),
//  Sat Jan 01 2000 21:00:00 GMT-0800 (PST),
//  Sun Jan 02 2000 00:00:00 GMT-0800 (PST)]
The following time intervals are considered for automatic ticks:
- 1-, 5-, 15- and 30-second.
- 1-, 5-, 15- and 30-minute.
- 1-, 3-, 6- and 12-hour.
- 1- and 2-day.
- 1-week.
- 1- and 3-month.
- 1-year.
In lieu of a count, a time interval may be explicitly specified. If an interval is specified, an optional step may also be specified to prune generated ticks. For example, time.ticks(d3_time.minute, 15) will generate ticks at 15-minute intervals:
var x = d3_scale.time()
    .domain([new Date(2000, 0, 1, 0), new Date(2000, 0, 1, 2)]);

x.ticks(d3_time.minute, 15);
// [Sat Jan 01 2000 00:00:00 GMT-0800 (PST),
//  Sat Jan 01 2000 00:15:00 GMT-0800 (PST),
//  Sat Jan 01 2000 00:30:00 GMT-0800 (PST),
//  Sat Jan 01 2000 00:45:00 GMT-0800 (PST),
//  Sat Jan 01 2000 01:00:00 GMT-0800 (PST),
//  Sat Jan 01 2000 01:15:00 GMT-0800 (PST),
//  Sat Jan 01 2000 01:30:00 GMT-0800 (PST),
//  Sat Jan 01 2000 01:45:00 GMT-0800 (PST),
//  Sat Jan 01 2000 02:00:00 GMT-0800 (PST)]
This is equivalent to using minute.every(15), or minute.filter with the following test function:
x.ticks(d3_time.minute.filter(function(d) {
  return d.getMinutes() % 15 === 0;
}));
Note: in some cases, such as with day ticks, specifying a step can result in irregular spacing of ticks because time intervals have varying length.
# time.tickFormat([specifier])
Returns a time format function suitable for displaying tick values. If a format specifier is specified, this method is equivalent to format. If specifier is not specified, the default time format is returned. The default multi-scale time format chooses a human-readable representation based on the specified date as follows:
%Y- for year boundaries, such as2011.%B- for month boundaries, such asFebruary.%b %d- for week boundaries, such asFeb 06.%a %d- for day boundaries, such asMon 07.%I %p- for hour boundaries, such as01 AM.%I:%M- for minute boundaries, such as01:23.:%S- for second boundaries, such as:45..%L- milliseconds for all other times, such as.012.
Although somewhat unusual, this default behavior has the benefit of providing both local and global context: for example, formatting a sequence of ticks as [11 PM, Mon 07, 01 AM] reveals information about hours, dates, and day simultaneously, rather than just the hours [11 PM, 12 AM, 01 AM]. See d3-time-format if you’d like to roll your own conditional time format.
# time.nice([count])
# time.nice([interval[, step]])
Extends the domain so that it starts and ends on nice round values. This method typically modifies the scale’s domain, and may only extend the bounds to the nearest round value.
An optional tick count argument allows greater control over the step size used to extend the bounds, guaranteeing that the returned ticks will exactly cover the domain. Alternatively, a time interval may be specified to explicitly set the ticks. If an interval is specified, an optional step may also be specified to skip some ticks. For example, time.nice(d3_time.second, 10) will extend the domain to an even ten seconds (0, 10, 20, etc.). See time.ticks and interval.every for further detail.
Nicing is useful if the domain is computed from data, say using extent, and may be irregular. For example, for a domain of [2009-07-13T00:02, 2009-07-13T23:48], the nice domain is [2009-07-13, 2009-07-14]. If the domain has more than two values, nicing the domain only affects the first and last value.
# d3_scale.utcTime()
Equivalent to time, but the returned time scale operates in Coordinated Universal Time rather than local time.
Sequential scales are similar to continuous scales in that they map a continuous, numeric input domain to a continuous output range. However, unlike continuous scales, the output range of a sequential color scale is fixed and not configurable. These scales do not expose invert, range, rangeRound and interpolate methods.
# d3_scale.viridis()
![]()
Constructs a new sequential scale with the unit domain [0, 1] and implementing the “viridis” perceptually-uniform color scheme designed by van der Walt, Smith and Firing for matplotlib.
# d3_scale.inferno()
![]()
Constructs a new sequential scale with the unit domain [0, 1] and implementing the “inferno” perceptually-uniform color scheme designed by van der Walt and Smith for matplotlib.
# d3_scale.magma()
![]()
Constructs a new sequential scale with the unit domain [0, 1] and implementing the “magma” perceptually-uniform color scheme designed by van der Walt and Smith for matplotlib.
# d3_scale.plasma()
![]()
Constructs a new sequential scale with the unit domain [0, 1] and implementing the “plasma” perceptually-uniform color scheme designed by van der Walt and Smith for matplotlib.
# d3_scale.warm()
![]()
Constructs a new sequential scale with the unit domain [0, 1] and approximately implementing a 180° rotation of Niccoli’s perceptual rainbow color scheme using the Cubehelix color space.
# d3_scale.cool()
![]()
Constructs a new sequential scale with the unit domain [0, 1] and approximately implementing Niccoli’s perceptual rainbow color scheme using the Cubehelix color space.
# d3_scale.rainbow()
![]()
Constructs a new sequential scale with the unit domain [0, 1] combining the warm scale from [0.0, 0.5] followed by the cool scale from [0.5, 1.0], thus implementing the cyclical less-angry rainbow color scheme.
# d3_scale.cubehelix()
![]()
Constructs a new linear scale with the unit domain [0, 1] and implementing Green’s default Cubehelix color scheme. Note that this is a linear, not sequential scale, and thus you may override the range and interpolator.
Quantize scales are similar to linear scales, except they use a discrete rather than continuous range. The continuous input domain is divided into uniform segments based on the number of values in (i.e., the cardinality of) the output range. Each range value y can be expressed as a quantized linear function of the domain value x: y = m round(x) + b. See bl.ocks.org/4060606 for an example.
# d3_scale.quantize()
Constructs a new quantize scale with the unit domain [0, 1] and the unit range [0, 1]. Thus, the default quantize scale is equivalent to the Math.round function.
# quantize(value)
Given a value in the input domain, returns the corresponding valuein the output range. For example, to apply a color encoding:
var color = d3_scale.quantize()
    .domain([0, 1])
    .range(["brown", "steelblue"]);

color(0.49); // "brown"
color(0.51); // "steelblue"
Or dividing the domain into three equally-sized parts with different range values to compute an appropriate stroke width:
var width = d3_scale.quantize()
    .domain([10, 100])
    .range([1, 2, 4]);

width(20); // 1
width(50); // 2
width(80); // 4
# quantize.invertExtent(value)
Returns the extent of values in the domain [x0, x1] for the corresponding value in the range: the inverse of quantize. This method is useful for interaction, say to determine the value in the domain that corresponds to the pixel location under the mouse.
var width = d3_scale.quantize()
    .domain([10, 100])
    .range([1, 2, 4]);

width.invertExtent(2); // [40, 70]
# quantize.domain([domain])
If domain is specified, sets the scale’s domain to the specified two-element array of numbers. If the elements in the given array are not numbers, they will be coerced to numbers. If domain is not specified, returns the scale’s current domain.
# quantize.range([range])
If range is specified, sets the scale’s range to the specified array of values. The array may contain any number of discrete values. The elements in the given array need not be numbers; any value or type will work. If range is not specified, returns the scale’s current range.
# quantize.nice()
Equivalent to linear.nice.
# quantize.ticks([count])
Equivalent to linear.ticks.
# quantize.tickFormat([count[, specifier]])
Equivalent to linear.tickFormat.
# quantize.copy()
Returns an exact copy of this scale. Changes to this scale will not affect the returned scale, and vice versa.
Quantile scales map a sampled input domain to a discrete range. The domain is considered continuous and thus the scale will accept any reasonable input value; however, the domain is specified as a discrete set of sample values. The number of values in (the cardinality of) the output range determines the number of quantiles that will be computed from the domain. To compute the quantiles, the domain is sorted, and treated as a population of discrete values; see d3-array’s quantile. See bl.ocks.org/8ca036b3505121279daf for an example.
# d3_scale.quantile()
Constructs a new quantile scale with an empty domain and an empty range. The quantile scale is invalid until both a domain and range are specified.
# quantile(value)
Given a value in the input domain, returns the corresponding value in the output range.
# quantile.invertExtent(value)
Returns the extent of values in the domain [x0, x1] for the corresponding value in the range: the inverse of quantile. This method is useful for interaction, say to determine the value in the domain that corresponds to the pixel location under the mouse.
# quantile.domain([domain])
If domain is specified, sets the domain of the quantile scale to the specified set of discrete numeric values. The array must not be empty, and must contain at least one numeric value; NaN, null and undefined values are ignored and not considered part of the sample population. If the elements in the given array are not numbers, they will be coerced to numbers. A copy of the input array is sorted and stored internally. If domain is not specified, returns the scale’s current domain.
# quantile.range([range])
If range is specified, sets the discrete values in the range. The array must not be empty, and may contain any type of value. The number of values in (the cardinality, or length, of) the range array determines the number of quantiles that are computed. For example, to compute quartiles, range must be an array of four elements such as [0, 1, 2, 3]. If range is not specified, returns the current range.
# quantile.quantiles()
Returns the quantile thresholds. If the range contains n discrete values, the returned array will contain n - 1 thresholds. Values less than the first threshold are considered in the first quantile; values greater than or equal to the first threshold but less than the second threshold are in the second quantile, and so on. Internally, the thresholds array is used with bisect to find the output quantile associated with the given input value.
# quantile.copy()
Returns an exact copy of this scale. Changes to this scale will not affect the returned scale, and vice versa.
Threshold scales are similar to quantize scales, except they allow you to map arbitrary subsets of the domain to discrete values in the range. The input domain is still continuous, and divided into slices based on a set of threshold values. See bl.ocks.org/3306362 for an example.
# d3_scale.threshold()
Constructs a new threshold scale with the default domain [0.5] and the default range [0, 1]. Thus, the default threshold scale is equivalent to the Math.round function for numbers; for example threshold(0.49) returns 0, and threshold(0.51) returns 1.
# threshold(value)
Given a value in the input domain, returns the corresponding value in the output range. For example:
var color = d3_scale.threshold()
    .domain([0, 1])
    .range(["red", "white", "green"]);

color(-1);   // "red"
color(0);    // "white"
color(0.5);  // "white"
color(1);    // "green"
color(1000); // "green"
# threshold.invertExtent(value)
Returns the extent of values in the domain [x0, x1] for the corresponding value in the range, representing the inverse mapping from range to domain. This method is useful for interaction, say to determine the value in the domain that corresponds to the pixel location under the mouse. For example:
var color = d3_scale.threshold()
    .domain([0, 1])
    .range(["red", "white", "green"]);

color.invertExtent("red"); // [undefined, 0]
color.invertExtent("white"); // [0, 1]
color.invertExtent("green"); // [1, undefined]
# threshold.domain([domain])
If domain is specified, sets the scale’s domain to the specified array of values. The values must be in sorted ascending order, or the behavior of the scale is undefined. The values are typically numbers, but any naturally ordered values (such as strings) will work; a threshold scale can be used to encode any type that is ordered. If the number of values in the scale’s range is N+1, the number of values in the scale’s domain must be N. If there are fewer than N elements in the domain, the additional values in the range are ignored. If there are more than N elements in the domain, the scale may return undefined for some inputs. If domain is not specified, returns the scale’s current domain.
# threshold.range([range])
If range is specified, sets the scale’s range to the specified array of values. If the number of values in the scale’s domain is N, the number of values in the scale’s range must be N+1. If there are fewer than N+1 elements in the range, the scale may return undefined for some inputs. If there are more than N+1 elements in the range, the additional values are ignored. The elements in the given array need not be numbers; any value or type will work. If range is not specified, returns the scale’s current range.
# threshold.copy()
Returns an exact copy of this scale. Changes to this scale will not affect the returned scale, and vice versa.
Unlike continuous scales, ordinal scales have a discrete domain and range. For example, an ordinal scale might map a set of named categories to a set of colors, or determine the horizontal positions of columns in a column chart.
# d3_scale.ordinal()
Constructs a new ordinal scale with an empty domain and an empty range. The ordinal scale always returns undefined until an output range is specified.
# ordinal(value)
Given a value in the input domain, returns the corresponding value in the output range. If the given value is not in the scale’s domain, returns the unknown; or, if the unknown value is implicit (the default), then the value is implicitly added to the domain and the next-available value in the range is assigned to value, such that this and subsequent invocations of the scale given the same input value return the same output value.
# ordinal.domain([domain])
If domain is specified, sets the domain to the specified array of values. The first element in domain will be mapped to the first element in the range, the second domain value to the second range value, and so on. Domain values are stored internally in a map from stringified value to index; the resulting index is then used to retrieve a value from the range. Thus, an ordinal scale’s values must be coercible to a string, and the stringified version of the domain value uniquely identifies the corresponding range value. If domain is not specified, this method returns the current domain.
Setting the domain on an ordinal scale is optional if the unknown value is implicit (the default). In this case, the domain will be inferred implicitly from usage by assigning each unique value passed to the scale a new value from the range. Note that an explicit domain is recommended to ensure deterministic behavior, as inferring the domain from usage will be dependent on ordering.
# ordinal.range([range])
If range is specified, sets the range of the ordinal scale to the specified array of values. The first element in the domain will be mapped to the first element in range, the second domain value to the second range value, and so on. If there are fewer elements in the range than in the domain, the scale will reuse values from the start of the range. If range is not specified, this method returns the current range.
# ordinal.unknown([value])
If value is specified, sets the output value of the scale for unknown input values and returns this scale. If value is not specified, returns the current unknown value, which defaults to implicit. The implicit value enables implicit domain construction; see ordinal.domain.
# ordinal.copy()
Returns an exact copy of this ordinal scale. Changes to this scale will not affect the returned scale, and vice versa.
# d3_scale.implicit
A special value for ordinal.unknown that enables implicit domain construction: unknown values are implicitly added to the domain.
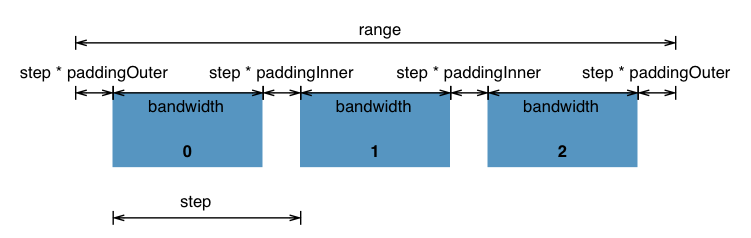
Band scales are like ordinal scales except the output range is continuous and numeric. Discrete output values are automatically computed by the scale by dividing the continuous range into uniform bands. Band scales are typically used for bar charts with an ordinal or categorical dimension. The unknown value of a band scale is effectively undefined: they do not allow implicit domain construction.
# d3_scale.band()
Constructs a new band scale with the empty domain, the unit range [0, 1], no padding, no rounding and center alignment.
# band(value)
Given a value in the input domain, returns the start of the corresponding band derived from the output range. If the given value is not in the scale’s domain, returns undefined.
# band.domain([domain])
If domain is specified, sets the domain to the specified array of values. The first element in domain will be mapped to the first band, the second domain value to the second band, and so on. Domain values are stored internally in a map from stringified value to index; the resulting index is then used to determine the band. Thus, a band scale’s values must be coercible to a string, and the stringified version of the domain value uniquely identifies the corresponding band. If domain is not specified, this method returns the current domain.
# band.range([range])
If domain is specified, sets the scale’s domain to the specified two-element array of numbers. If the elements in the given array are not numbers, they will be coerced to numbers. If range is not specified, returns the scale’s current range, which defaults to [0, 1].
# band.rangeRound([range])
Sets the scale’s range to the specified two-element array of numbers while also enabling rounding. This is a convenience method equivalent to:
band
    .range(range)
    .round(true);
Rounding is sometimes useful for avoiding antialiasing artifacts, though also consider the shape-rendering “crispEdges” styles.
# band.round([round])
If round is specified, enables or disables rounding accordingly. If rounding is enabled, the start and stop of each band will be integers. Rounding is sometimes useful for avoiding antialiasing artifacts, though also consider the shape-rendering “crispEdges” styles. Note that if the width of the domain is not a multiple of the cardinality of the range, there may be leftover unused space, even without padding! Use band.align to specify how the leftover space is distributed.
# band.paddingInner([padding])
If padding is specified, sets the inner padding to the specified value which must be in the range [0, 1]. If padding is not specified, returns the current inner padding which defaults to 0. The inner padding determines the ratio of the range that is reserved for blank space between bars.
# band.paddingOuter([padding])
If padding is specified, sets the outer padding to the specified value which must be in the range [0, 1]. If padding is not specified, returns the current outer padding which defaults to 0. The outer padding determines the ratio of the range that is reserved for blank space before the first bar and after the last bar.
# band.padding([padding])
A convenience method for setting the inner and outer padding to the same padding value. If padding is not specified, returns the inner padding.
# band.align([align])
If align is specified, sets the alignment to the specified value which must be in the range [0, 1]. If align is not specified, returns the current alignment which defaults to 0.5. The alignment determines how any leftover unused space in the range is distributed. A value of 0.5 indicates that the leftover space should be equally distributed before the first bar and after the last bar; i.e., the bars should be centered within the range. A value of 0 or 1 may be used to shift the bars to one side, say to position them adjacent to an axis.
# band.bandwidth()
Returns the width of each band.
# band.step()
Returns the distance between the starts of adjacent bands.
# band.copy()
Returns an exact copy of this scale. Changes to this scale will not affect the returned scale, and vice versa.
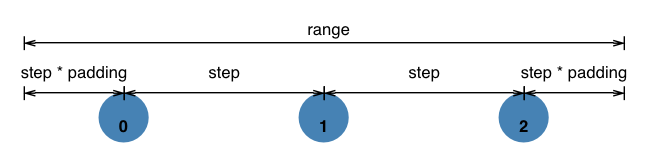
Point scales are a variant of band scales with the bandwidth fixed to zero. Point scales are typically used for scatterplots with an ordinal or categorical dimension. The unknown value of a point scale is always undefined: they do not allow implicit domain construction.
# d3_scale.point()
Constructs a new point scale with the empty domain, the unit range [0, 1], no padding, no rounding and center alignment.
# point.padding([padding])
Equivalent to band.paddingOuter.
# d3_scale.category10()
![]()
Constructs a new ordinal scale with a range of ten categorical colors.
# d3_scale.category20()
![]()
Constructs a new ordinal scale with a range of twenty categorical colors.
# d3_scale.category20b()
![]()
Constructs a new ordinal scale with a range of twenty categorical colors.
# d3_scale.category20c()
![]()
Constructs a new ordinal scale with a range of twenty categorical colors. This color scale includes color specifications and designs developed by Cynthia Brewer (colorbrewer2.org).


