GithubHelp home page GithubHelp logo

freqtrade / technical Goto Github PK

View Code? Open in Web Editor NEW
695.0 42.0 208.0 1.34 MB

Various indicators developed or collected for the Freqtrade

License: GNU General Public License v3.0

Python 100.00%
freqtrade dataframe technical-analysis trading

technical's Introduction

Technical

Technical CI PyPI Code style: black

This is a collection of technical indicators collected or developed for Freqtrade as well as utilities such as timeframe resampling.

What does it do for you

We basically provide you with easy to use indicators, collected from all over github and custom methods. Over time we plan to provide a simple API wrapper around TA-Lib, PyTi and others, as we find them. So you have one place, to find 100s of indicators.

Custom indicators

  • Consensus - an indicator which is based on a consensus model, across several indicators you can easily customize these. It is based on the TradingView buy/sell graph. - MovingAverage Consensus - Oscillator Consensus - Summary Consensus
  • vfi
  • mmar
  • madrid_sqz
  • stc
  • ichimoku cloud
  • volume weighted moving average
  • laguerre
  • vpci
  • trendlines, 2 different algorithms to calculate trendlines
  • fibonacci retracements
  • pivots points
  • TKE Indicator - Arithmetical mean of 7 oscilators
  • Volume Weighted MACD - Volume Weighted MACD indicator
  • RMI - Relative Momentum indicator
  • VIDYA - Variable Index Dynamic Average
  • MADR - Moving Average Deviation Rate
  • SSL - SSL Channel
  • PMAX - PMAX indicator

Utilities

  • resample - easily resample your dataframe to a larger interval
  • merge - merge your resampled dataframe into your original dataframe, so you can build triggers on more than 1 interval!

Wrapped Indicators

The following indicators are available and have been 'wrapped' to be used on a dataframe with the standard open/close/high/low/volume columns:

  • chaikin_money_flow - Chaikin Money Flow, requires dataframe and period
  • accumulation_distribution - requires a dataframe
  • osc - requires a dataframe and the periods
  • atr - dataframe, period, field
  • atr_percent - dataframe, period, field
  • bollinger_bands - dataframe, period, stdv, field, prefix
  • cmo - dataframe, period, field
  • cci - dataframe, period
  • williams percent
  • momentum oscilator
  • hull moving average
  • ultimate oscillator
  • sma
  • ema
  • tema

We will try to add more and more wrappers as we get to it, but please be patient or help out with PR's! It's super easy, but also super boring work.

Usage

to use the library, please install it with pip

pip install technical

To get the latest version, install directly from github:

pip install git+https://github.com/freqtrade/technical

and than import the required packages

from technical.indicators import accumulation_distribution, ...
from technical.util import resample_to_interval, resampled_merge

# Assuming 1h dataframe -resampling to 4h:
dataframe_long = resample_to_interval(dataframe, 240)  # 240 = 4 * 60 = 4h

dataframe_long['rsi'] = ta.RSI(dataframe_long)
# Combine the 2 dataframes
dataframe = resampled_merge(dataframe, dataframe_long, fill_na=True)

"""
The resulting dataframe will have 5 resampled columns in addition to the regular columns,
following the template resample_<interval_in_minutes>_<orig_column_name>.
So in the above example:
['resample_240_open', 'resample_240_high', 'resample_240_low','resample_240_close', 'resample_240_rsi']
"""

Contributions

We will happily add your custom indicators to this repo! Just clone this repository and implement your favorite indicator to use with Freqtrade.

Have fun!

technical's People

Contributors

baont avatar berlinguyinca avatar bmoulkaf avatar boschje avatar creslinux avatar dependabot-preview[bot] avatar dependabot[bot] avatar dericdesta avatar gjuju avatar hroff-1902 avatar jisnardo avatar kjkraw avatar masmar25 avatar michealreed avatar mishaker avatar pauldesco avatar pfakanator avatar polakowo avatar pyup-bot avatar sangtrx avatar sauces1313 avatar seannowotny avatar ssmehta avatar stash86 avatar th0masl avatar thejoeschr avatar xmatthias avatar

Stargazers

 avatar  avatar  avatar  avatar  avatar  avatar  avatar  avatar  avatar  avatar  avatar  avatar  avatar  avatar  avatar  avatar  avatar  avatar  avatar  avatar  avatar  avatar  avatar  avatar  avatar  avatar  avatar  avatar  avatar  avatar  avatar  avatar  avatar  avatar  avatar  avatar  avatar  avatar  avatar  avatar  avatar  avatar  avatar  avatar  avatar  avatar  avatar  avatar  avatar  avatar  avatar  avatar  avatar  avatar  avatar  avatar  avatar  avatar  avatar  avatar  avatar  avatar  avatar  avatar  avatar  avatar  avatar  avatar  avatar  avatar  avatar  avatar  avatar  avatar  avatar  avatar  avatar  avatar  avatar  avatar  avatar  avatar  avatar  avatar  avatar  avatar  avatar  avatar  avatar  avatar  avatar  avatar  avatar  avatar  avatar  avatar  avatar  avatar  avatar  avatar

Watchers

 avatar  avatar  avatar  avatar  avatar  avatar  avatar  avatar  avatar  avatar  avatar  avatar  avatar  avatar  avatar  avatar  avatar  avatar  avatar  avatar  avatar  avatar  avatar  avatar  avatar  avatar  avatar  avatar  avatar  avatar  avatar  avatar  avatar  avatar  avatar  avatar  avatar  avatar  avatar  avatar  avatar  avatar

technical's Issues

ATR differences

There is still ATR differences with TradingView built-in indicator.
Following issue #26
when it was fixed, now there is difference again.

Wrong method documentation in method segtrends

In method segtrends, trendline.py.
These params are listed in comment section but do not exist actual parameters:

:param x: One-dimensional data set
:param window: How long the trendlines should be. If window < 1, then it
               will be taken as a percentage of the size of the data

Whereas, param segments=2 is not documented.

How to add indicators to strategy

Hello guys, I see lots of def supertrend(dataframe, multiplier=3, period=10): or def MOST(dataframe , percent, length): etc. but I couldnt find any guide how to implant to strategy.

What I tried
For example I choose this def from #90

def MOST2(dataframe,  percent=2, length=8, MAtype=1):
    import talib.abstract as ta
    df = dataframe.copy()
    mostvalue = 'MOST_' + str(length) + '_' + str(percent)
    mavalue = 'MA_' + str(length) + '_' + str(percent)
    trend = 'Trend_' + str(length) + '_' + str(percent)
    # Compute basic upper and lower bands
    if MAtype==1:
        df[mavalue]=ta.EMA(df , timeperiod = length)
    elif MAtype==2:
        df[mavalue]=ta.DEMA(df , timeperiod = length)
    elif MAtype==3:
        df[mavalue]=ta.T3(df , timeperiod = length)
    df['basic_ub'] = df[mavalue] * (1+percent/100)
    df['basic_lb'] = df[mavalue] * (1-percent/100)
    # Compute final upper and lower bands
    df['final_ub'] = 0.00
    df['final_lb'] = 0.00
    for i in range(length, len(df)):
        df['final_ub'].iat[i] = df['basic_ub'].iat[i] if df['basic_ub'].iat[i] < df['final_ub'].iat[i - 1] or df[mavalue].iat[i - 1] > df['final_ub'].iat[i - 1] else df['final_ub'].iat[i - 1]
        df['final_lb'].iat[i] = df['basic_lb'].iat[i] if df['basic_lb'].iat[i] > df['final_lb'].iat[i - 1] or df[mavalue].iat[i - 1] < df['final_lb'].iat[i - 1] else df['final_lb'].iat[i - 1]
    # Set the MOST value
    df[mostvalue] = 0.00
    for i in range(length, len(df)):
        df[mostvalue].iat[i] = df['final_ub'].iat[i] if df[mostvalue].iat[i - 1] == df['final_ub'].iat[i - 1] and df[mavalue].iat[i] <= df['final_ub'].iat[i] else \
                        df['final_lb'].iat[i] if df[mostvalue].iat[i - 1] == df['final_ub'].iat[i - 1] and df[mavalue].iat[i] >  df['final_ub'].iat[i] else \
                        df['final_lb'].iat[i] if df[mostvalue].iat[i - 1] == df['final_lb'].iat[i - 1] and df[mavalue].iat[i] >= df['final_lb'].iat[i] else \
                        df['final_ub'].iat[i] if df[mostvalue].iat[i - 1] == df['final_lb'].iat[i - 1] and df[mavalue].iat[i] <  df['final_lb'].iat[i] else 0.00
    # Mark the trend direction up/down
    df[trend] = np.where((df[mostvalue] > 0.00), np.where((df[mavalue] < df[mostvalue]), 'down',  'up'), np.NaN)
    # Remove basic and final bands from the columns
    df.drop(['basic_ub', 'basic_lb', 'final_ub', 'final_lb'], inplace=True, axis=1)
    df.fillna(0, inplace=True)
    return df

But I don't know how to use it and couldnt find any guide.Btw I am noob

Thanks for reply

Edit: I am using plot. So it would be good if u tell me how to see this indicator result in plot. Because i want to compare with tradingview etc.

Looking for Laguerre Rsi Indicator

Hey guys,

I'm wondering how can I find a Laguerre Rsi indicator for Freqtrade. I've found one in backtrader (https://github.com/mementum/backtrader/blob/master/backtrader/indicators/lrsi.py) but I can't use it.

I've tried to use this but failed:

`

def populate_indicators(self, dataframe: DataFrame, metadata: dict) -> DataFrame:
  
  try:
     dataframe['l0_1'] = dataframe['l0']
     dataframe['l1_1'] = dataframe['l1']
     dataframe['l2_1'] = dataframe['l2']
     dataframe['l3_1'] = dataframe['l3']
     dataframe['l0'] = dataframe['l0'] = (1.0 - gamma) * dataframe['close'] + gamma * dataframe['l0_1']
     dataframe['l1'] = dataframe['l1'] = -gamma * dataframe['l0'] + dataframe['l0_1'] + gamma * dataframe['l1_1']
     dataframe['l2'] = dataframe['l2'] = -gamma * dataframe['l1'] + dataframe['l1_1'] + gamma * dataframe['l2_1']
     dataframe['l3'] = dataframe['l3'] = -gamma * dataframe['l2'] + dataframe['l2_1'] + gamma * dataframe['l3']

     cu = 0.0
     cd = 0.0
     if dataframe['l0'] >= dataframe['l1']:
        cu = dataframe['l0'] - dataframe['l1']
     else:
        cd = dataframe['l1'] - dataframe['l0']

     if dataframe['l1'] >= dataframe['l2']:
        cu += dataframe['l1'] - dataframe['l2']
     else:
        cd += dataframe['l2'] - dataframe['l1']

     if dataframe['l2'] >= dataframe['l3']:
        cu += dataframe['l2'] - dataframe['l3']
     else:
        cd += dataframe['l3'] - dataframe['l2']

     den = cu + cd
     dataframe['lrsi'] = 1.0 if not den else cu / den
  except:
     dataframe['l0'] = 0.0
     dataframe['l1'] = 0.0
     dataframe['l2'] = 0.0
     dataframe['l3'] = 0.0
     dataframe['l0_1'] = 0.0
     dataframe['l1_1'] = 0.0
     dataframe['l2_1'] = 0.0
     dataframe['l3_1'] = 0.0
     dataframe['lrsi'] = 0

  print('rsi is')
  print(dataframe['lrsi'])
  
  return dataframe

`

Any suggestion?
Thanks.

docker installation problem

Hi

I am using docker-compose and it works without any problem. Now, I want to add technical to the default image but I got error during the build

This is my Dockerfile.technical file:

`ROM freqtradeorg/freqtrade:develop

RUN apt-get update
&& apt-get -y install git
&& apt-get clean
&& pip install git+https://github.com/freqtrade/technical`

and this is my docker-compose:

version: '3' services: freqtrade: #image: freqtradeorg/freqtrade:stable image: freqtradeorg/freqtrade:custom # image: freqtradeorg/freqtrade:develop # Use plotting image # image: freqtradeorg/freqtrade:develop_plot # Build step - only needed when additional dependencies are needed build: context: . dockerfile: "./Dockerfile.technical" restart: unless-stopped container_name: freqtrade volumes: - "./user_data:/freqtrade/user_data" # Expose api on port 8080 (localhost only) # Please read the https://www.freqtrade.io/en/latest/rest-api/ documentation # before enabling this. # ports: # - "127.0.0.1:8080:8080" # Default command used when running docker compose upcommand: > trade --logfile /freqtrade/user_data/logs/freqtrade.log --db-url sqlite:////freqtrade/user_data/tradesv3.sqlite --config /freqtrade/user_data/config.json --strategy SampleStrategy

then I build the image by docker-compose build

Unfortunately, I got the following error:

`Building freqtrade
Sending build context to Docker daemon 3.584kB

Step 1/2 : FROM freqtradeorg/freqtrade:develop
---> 8621fb14095f
Step 2/2 : RUN apt-get update && apt-get -y install git && apt-get clean && pip install git+https://github.com/freqtrade/technical
---> Running in facf971d95e8
Reading package lists...
E: Could not open lock file /var/lib/apt/lists/lock - open (13: Permission denied)
E: Unable to lock directory /var/lib/apt/lists/
The command '/bin/sh -c apt-get update && apt-get -y install git && apt-get clean && pip install git+https://github.com/freqtrade/technical' returned a non-zero code: 100
ERROR: Service 'freqtrade' failed to build`

I built the image with Sudo and directly with root, and it is not working.

I added sudo before apt-get but It shows me the following message and again it didn't work:

`Step 1/2 : FROM freqtradeorg/freqtrade:develop
---> 8621fb14095f
Step 2/2 : RUN sudo apt-get update && sudo apt-get -y install git && sudo apt-get clean && sudo pip install git+https://github.com/freqtrade/technical
---> Running in 0bd9fb6352b4

We trust you have received the usual lecture from the local System
Administrator. It usually boils down to these three things:

#1) Respect the privacy of others.
#2) Think before you type.
#3) With great power comes great responsibility.

sudo: no tty present and no askpass program specified
The command '/bin/sh -c sudo apt-get update && sudo apt-get -y install git && sudo apt-get clean && sudo pip install git+https://github.com/freqtrade/technical' returned a non-zero code: 1
ERROR: Service 'freqtrade' failed to build`

I edited visudo for specific user to run sudo without password to solve sudo: no tty present and no askpass program specified message but nothing changed.

what is my mistake and how to solve it?

Thanks

Relativ Momentum index implement

RMI indicator just like RSI ... i use it. it will be usefull.

def Rmi(dataframe, Len=20, Mom=5):
    import talib.abstract as ta
    df = dataframe.copy()
    df["maxup"] = 0.00
    df["maxdown"] = 0.00
    df["RMI"] = 0.00
    # maxdown = []
    for i in range(Mom, len(df.close)):
        df["maxup"].iat[i]=(max(df.close.iat[i] - df.close.iat[i-Mom], 0))
        df["maxdown"].iat[i]=(max(df.close.iat[i-Mom] - df.close.iat[i], 0))
    emaIncframe = DataFrame(df['maxup']).rename(columns={'maxup': 'close'})
    emaDecframe = DataFrame(df['maxdown']).rename(columns={'maxdown': 'close'})
    df["emaInc"] = ta.EMA(emaIncframe, timeperiod=Len)
    df["emaDec"] = ta.EMA(emaDecframe, timeperiod=Len)
    df.fillna(0, inplace=True)
    # df["RMI"] = emadec == 0 ? 0 : 100 - 100 / (1 + emaInc / emaDec)
    for i in range(Mom, len(df.close)):
        if df["emaDec"][i] == 0 :
            df["RMI"].iat[i] = 0
        else:
            df["RMI"].iat[i] = 100 - 100 / (1 + df["emaInc"][i] / df["emaDec"][i])
    return df["RMI"]

Chikou Span (Ichimoku Cloud Lagging Price)

I plan to raise this as a different issue in the freqtrade repo, but the way the chikou span is implemented allows the backtesting engine to look at future data. Chikou is only supposed to be a visual indicator for plotting the current price 26-30 ticks back on the chart.

Implementing the Technical library in freqtrade

I'm trying to implement the Ichimoku cloud indicator in a strategy from https://cryptocue.io/ichimoku-strategy-with-freqtrade/.

ichi.py

`
from freqtrade.strategy.interface import IStrategy
from pandas import DataFrame
from technical.indicators import accumulation_distribution
from technical.util import resample_to_interval, resampled_merge

import talib.abstract as ta
import freqtrade.vendor.qtpylib.indicators as qtpylib
import numpy # noqa
from technical.indicators import ichimoku

class ichis(IStrategy):

# Minimal ROI designed for the strategy.
# This attribute will be overridden if the config file contains "minimal_roi"
minimal_roi = {

    "0": 1
}

# Optimal stoploss designed for the strategy
# This attribute will be overridden if the config file contains "stoploss"
stoploss = -0.1

# trailing stoploss
trailing_stop = True
trailing_stop_positive = -0.15
trailing_stop_positive_offset = 0.20 # Disabled / not configured
trailing_only_offset_is_reached = True

# Optimal ticker interval for the strategy
ticker_interval = '15m'

# run "populate_indicators" only for new candle
process_only_new_candles = False

# Experimental settings (configuration will overide these if set)
use_sell_signal = True
sell_profit_only = False
ignore_roi_if_buy_signal = False

# Optional order type mapping
order_types = {
    'buy': 'limit',
    'sell': 'limit',
    'stoploss': 'market',
    'stoploss_on_exchange': False
}

# Optional order time in force
order_time_in_force = {
    'buy': 'gtc',
    'sell': 'gtc'
}

def informative_pairs(self):
    """
   Define additional, informative pair/interval combinations to be cached from the exchange.
   These pair/interval combinations are non-tradeable, unless they are part
   of the whitelist as well.
   For more information, please consult the documentation
   :return: List of tuples in the format (pair, interval)
       Sample: return [("ETH/USDT", "5m"),
                       ("BTC/USDT", "15m"),
                       ]
   """
    return []

def populate_indicators(self, dataframe: DataFrame, metadata: dict) -> DataFrame:
   
    ichi=ichimoku(dataframe)
    dataframe['tenkan']=ichi['tenkan_sen']
    dataframe['kijun']=ichi['kijun_sen']
    dataframe['senkou_a']=ichi['senkou_span_a']
    dataframe['senkou_b']=ichi['senkou_span_b']
    dataframe['cloud_green']=ichi['cloud_green']
    dataframe['cloud_red']=ichi['cloud_red']

    return dataframe

def populate_buy_trend(self, dataframe: DataFrame, metadata: dict) -> DataFrame:
    """
   Based on TA indicators, populates the buy signal for the given dataframe
   :param dataframe: DataFrame populated with indicators
   :param metadata: Additional information, like the currently traded pair
   :return: DataFrame with buy column
   """
   
    dataframe.loc[
        (
            (dataframe['tenkan'].shift(1)<dataframe['kijun'].shift(1)) &
            (dataframe['tenkan']>dataframe['kijun']) &
            (dataframe['cloud_red']==True)

        ),
        'buy'] = 1

    return dataframe

def populate_sell_trend(self, dataframe: DataFrame, metadata: dict) -> DataFrame:
    """
   Based on TA indicators, populates the sell signal for the given dataframe
   :param dataframe: DataFrame populated with indicators
   :param metadata: Additional information, like the currently traded pair
   :return: DataFrame with buy column
   """
    dataframe.loc[
        (
           
        ),
        'sell'] = 1

    return dataframe`

I'm getting the error

freqtrade - ERROR - Impossible to load Strategy 'ichi'. This class does not exist or contains Python code errors.

I can get the default strategy to run. This error doesn't give me much to go off of. Is there a better place to get support using freqtrade and the technical library? I'm not finding much on google.

PMAX indicator

I mentioned here #97. an indicator that I like and use..

def PMAX(dataframe, period = 10, multiplier = 3, length=12, MAtype=1, src=1):
    """
    Function to compute PMAX
    
    Args :
        df : Pandas DataFrame which contains ['date', 'open', 'high', 'low', 'close', 'volume'] columns
        period : Integer indicates the period of computation in terms of number of candles
        multiplier : Integer indicates value to multiply the ATR
        length: moving averages length
        MAtype: type of the moving average
        
    Returns :
        df : Pandas DataFrame with new columns added for 
            True Range (TR), ATR (ATR_$period)
            PMAX (pm_$period_$multiplier_$length_$Matypeint)
            PMAX Direction (pmX_$period_$multiplier_$length_$Matypeint)
    """
    import talib.abstract as ta
    df = dataframe.copy()
    mavalue = 'MA_' + str(MAtype) + '_' + str(length)
    atr = 'ATR_' + str(period)
    df[atr]=ta.ATR(df , timeperiod = period)
    pm = 'pm_' + str(period) + '_' + str(multiplier) + '_' + str(length) + '_' + str(MAtype)
    pmx = 'pmX_' + str(period) + '_' + str(multiplier) + '_' + str(length) + '_' + str(MAtype)
    # MAtype==1 --> EMA
    # MAtype==2 --> DEMA
    # MAtype==3 --> T3
    # MAtype==4 --> SMA
    # MAtype==5 --> VIDYA
    # MAtype==6 --> TEMA
    # MAtype==7 --> WMA
    # MAtype==8 --> VWMA
    # MAtype==9 --> zema
    if src == 1:
        masrc=df["close"]
    elif src == 2:
        masrc = (df["high"] + df["low"]) / 2
    elif src == 3:
        masrc = (df["high"] + df["low"]+ df["close"] + df["open"]) / 4
    if MAtype==1:
        df[mavalue]= ta.EMA(masrc , timeperiod = length)
    elif MAtype==2:
        df[mavalue]= ta.DEMA(masrc , timeperiod = length)
    elif MAtype==3:
        df[mavalue]= ta.T3(masrc , timeperiod = length)
    elif MAtype==4:
        df[mavalue]= ta.SMA(masrc , timeperiod = length)
    elif MAtype==5:
        df[mavalue]= VIDYA(df , length= length)
    elif MAtype==6:
        df[mavalue]= ta.TEMA(masrc , timeperiod = length)
    elif MAtype==7:
        df[mavalue]= ta.WMA(df , timeperiod = length)
    elif MAtype==8:
        df[mavalue]= vwma(df , length)
    elif MAtype==9:
        df[mavalue]= zema(df , period=length)
    # Compute basic upper and lower bands
    df['basic_ub'] = df[mavalue] + (multiplier * df[atr])
    df['basic_lb'] = df[mavalue] - (multiplier * df[atr])
    # Compute final upper and lower bands
    df['final_ub'] = 0.00
    df['final_lb'] = 0.00
    for i in range(period, len(df)):
        df['final_ub'].iat[i] = df['basic_ub'].iat[i] if df['basic_ub'].iat[i] < df['final_ub'].iat[i - 1] or df[mavalue].iat[i - 1] > df['final_ub'].iat[i - 1] else df['final_ub'].iat[i - 1]
        df['final_lb'].iat[i] = df['basic_lb'].iat[i] if df['basic_lb'].iat[i] > df['final_lb'].iat[i - 1] or df[mavalue].iat[i - 1] < df['final_lb'].iat[i - 1] else df['final_lb'].iat[i - 1]
       
    # Set the Pmax value
    df[pm] = 0.00
    for i in range(period, len(df)):
        df[pm].iat[i] = df['final_ub'].iat[i] if df[pm].iat[i - 1] == df['final_ub'].iat[i - 1] and df[mavalue].iat[i] <= df['final_ub'].iat[i] else \
                        df['final_lb'].iat[i] if df[pm].iat[i - 1] == df['final_ub'].iat[i - 1] and df[mavalue].iat[i] >  df['final_ub'].iat[i] else \
                        df['final_lb'].iat[i] if df[pm].iat[i - 1] == df['final_lb'].iat[i - 1] and df[mavalue].iat[i] >= df['final_lb'].iat[i] else \
                        df['final_ub'].iat[i] if df[pm].iat[i - 1] == df['final_lb'].iat[i - 1] and df[mavalue].iat[i] <  df['final_lb'].iat[i] else 0.00 
    # Mark the trend direction up/down
    df[pmx] = np.where((df[pm] > 0.00), np.where((df[mavalue] < df[pm]), 'down',  'up'), np.NaN)
    # Remove basic and final bands from the columns
    df.drop(['basic_ub', 'basic_lb', 'final_ub', 'final_lb'], inplace=True, axis=1)
    
    df.fillna(0, inplace=True)

    return df

ATR differences

Moved this from ta-lib: TA-Lib/ta-lib-python#266
(I guess we should not discuss technical and qtpylib in ta-lib repo)

The ATR indicator (which is part of DMI) implementation in qtpylib gives results that differ from all 4 variants (RMA/SMA/EMA/WMA) of tradingview's built-in ATR...
Btw, ATR from talib also produces different (from all others) results for ATR.
And, ATR from freqtrade/technical (which wraps ATR from pyti) also seems to be just buggy, the values are very far from all other implementations...

How to reproduce:
add in the custom strategy (I'm not plotting, just printing the results):

import talib as talib
import technical.indicators as technical
...

def populate_indicators(self, dataframe: DataFrame, metadata: dict) -> DataFrame:
        ...
        dataframe['tr'] = qtpylib.true_range(dataframe)
        dataframe['atr-q1'] = qtpylib.atr(dataframe, window=14, exp=False)
        dataframe['atr-q2'] = qtpylib.atr(dataframe, window=14, exp=True)
        dataframe['atr-technical'] = technical.atr(dataframe, period=14)
        dataframe['atr-talib'] = talib.ATR(dataframe['high'], dataframe['low'], dataframe['close'], timeperiod = 14)
        ...
        print(dataframe[['date', 'open', 'high', 'low', 'close', 'tr', 'atr-q1', 'atr-q2', 'atr-technical', 'atr-talib']])
        return dataframe

qtpylib's TR is okay, but ATR...

I used ETH/BTC, 1h from Binance (here and on tradingview)

Calculation of Heikin-Ashi open

I am comparing the Heikin-Ashi candles from freqtrade technical library with QTPyLib, and found a difference in the calculation of the first candle open. Since all following candles are based on the previous, it affects the Heikin-Ashi open value for all candles in the dataframe.

Normally Heikin-Ashi open is based on the previous candle: (open.shift(1) + close.shift(1)) / 2

However for the first candle we should use the current candle: (open + close) / 2

Reference: https://school.stockcharts.com/doku.php?id=chart_analysis:heikin_ashi
"The first Heikin-Ashi open equals the average of the open and close ((O+C)/2)."

But currently in freqtrade technical only the open is used for the first candle:

bars.loc[:1, 'ha_open'] = bars['open'].values[0]

Suggest to change this to:
bars.loc[:1, 'ha_open'] = (bars['open'].values[0] + bars['close'].values[0]) / 2

Then it would be same as QTPyLib and Tradingview.

Plotting or using the future parts of senkou_span_a/b

image
As you can see on a current price chart here: the default behavior of senkou_span_a and b is to be plotted into the future (without the need of future price data!).

However I noticed that freqtrade plots only up to the current price and cuts off the parts of senkou_span_a and b that are in the future.

I wonder if we can plot those parts and most importantly: if we can use the shifted (future) parts of them in strategies.

implementation of fibonacci in freqtrade

HI Guys
1st thanks for creating such an amazing trading tool Freqtrade and the associated and important repositories. Im new to the game, and have only got into freqtrade and crypto in the past 12months and have learnt a looooot. so thank you.
i've the following request
i'm a fan of fibonacci retracement and it's been working for me very well in this current bull market esp in combination with RSI. i'm now looking at automating my setup. but i cant seem to find how i can do this from the material on freqtrade.
i want to do a rolling auto fibonacci with a 30day look back and the trade entry would be at 50% or 61.8% tretracement and RSI <30
exit is based on RSI over bought (i can do this part :))
thanking you in advance
best regards
Connor

Ichimoku kumo twist

current implementation of ichimoku indicator doesn't offer the possibility to check for kumo twists,
as they need senkou_span_a and senkou_span_b data in the future.
the data needed is lost when shifting senkou span a and b.

Moving Average Deviation Rate indicator

https://tr.tradingview.com/v/25KCgL9H/ this indicator just like bollinger bands..
bollinger strategies can apply it.. e.g. lowerband buy , upperband sell..
i hope usefull..

def MADR(dataframe , length=21, stds=2):
    #Moving Averae Deviation RAte just like bollinger bands ...
    import talib.abstract as ta
    df = dataframe.copy()
    """ tradingview's code
    _maPeriod = input(21, title="Moving average period")

    //deviation rate
    _sma = sma(close, _maPeriod)
    _rate = close / _sma * 100 - 100

    //deviation rate std
    _stdCenter = sma(_rate, _maPeriod * 2)
    _std = stdev(_rate, _maPeriod * 2)
    _plusDev = _stdCenter + _std * 2
    _minusDev = _stdCenter - _std * 2    
    """
    df["sma"] = ta.SMA(df, timeperiod=length)
    df["rate"] = (df["close"] / df["sma"]) * 100 - 100
    df["stdcenter"] = ta.SMA(df.rate, timeperiod=length * stds)
    df["std"] = ta.STDDEV(df.rate, timeperiod=length * stds)
    df["plusdev"] = df["stdcenter"] + df["std"] * stds
    df["minusdev"] = df["stdcenter"] - df["std"] * stds
    df = df.drop(columns=['sma','std'])
    # return stdcenter , plusdev , minusdev, rate
    return df

Supertrend

i test it and use it. her is the code

def SuperTrend(dataframe, period = 10, multiplier = 3):
    import talib.abstract as ta
    df = dataframe.copy()
    atr = 'ATR_' + str(period)
    df[atr]=ta.ATR(df , timeperiod = period)
    st = 'ST_' + str(period) + '_' + str(multiplier)
    stx = 'STX_' + str(period) + '_' + str(multiplier)
    # Compute basic upper and lower bands
    df['basic_ub'] = (df["high"] + df["low"]) / 2 + multiplier * df[atr]
    df['basic_lb'] = (df["high"] + df["low"]) / 2 - multiplier * df[atr]
    # Compute final upper and lower bands
    df['final_ub'] = 0.00
    df['final_lb'] = 0.00
    for i in range(period, len(df)):
        df['final_ub'].iat[i] = df['basic_ub'].iat[i] if df['basic_ub'].iat[i] < df['final_ub'].iat[i - 1] or df['close'].iat[i - 1] > df['final_ub'].iat[i - 1] else df['final_ub'].iat[i - 1]
        df['final_lb'].iat[i] = df['basic_lb'].iat[i] if df['basic_lb'].iat[i] > df['final_lb'].iat[i - 1] or df['close'].iat[i - 1] < df['final_lb'].iat[i - 1] else df['final_lb'].iat[i - 1]
       
    # Set the Supertrend value
    df[st] = 0.00
    for i in range(period, len(df)):
        df[st].iat[i] = df['final_ub'].iat[i] if df[st].iat[i - 1] == df['final_ub'].iat[i - 1] and df['close'].iat[i] <= df['final_ub'].iat[i] else \
                        df['final_lb'].iat[i] if df[st].iat[i - 1] == df['final_ub'].iat[i - 1] and df['close'].iat[i] >  df['final_ub'].iat[i] else \
                        df['final_lb'].iat[i] if df[st].iat[i - 1] == df['final_lb'].iat[i - 1] and df['close'].iat[i] >= df['final_lb'].iat[i] else \
                        df['final_ub'].iat[i] if df[st].iat[i - 1] == df['final_lb'].iat[i - 1] and df['close'].iat[i] <  df['final_lb'].iat[i] else 0.00                  
    # Mark the trend direction up/down
    df[stx] = np.where((df[st] > 0.00), np.where((df['close'] < df[st]), 'down',  'up'), np.NaN)
    # Remove basic and final bands from the columns
    df.drop(['basic_ub', 'basic_lb', 'final_ub', 'final_lb'], inplace=True, axis=1)
    df.fillna(0, inplace=True)
    return df

resample_to_interval

Hi Wanted to understand how this is implemented and how can I consume this function.

This is what I am trying to do, any insights will be most appreciated.

So I want to start a trade based on EMA crossing over 50 going above 200 or 50 going bellow 200 (5m), however, I only want to do Long if ema 50 is over 200 and the price is above ema 50 on (4h) something like that.

I understand or I think I need to use the function resample_to_interval what does this do? I am passing it the current dataset, of 5m, and telling it to resample it as 15m and then give it back to me as a new data set?

In one of your examples MultiRSI.py, I see this implemented. And I also see the data is again remerged with resampled_merge, what is the need for that? When the resampling occurs are you resampling the dataset sent directly or creating a copy and giving it back to me.

Thanks any help would be appriciated.

Here is my custom stratagy
`
def populate_indicators(self, dataframe: DataFrame, metadata: dict) -> DataFrame:
from technical.util import resample_to_interval
from technical.util import resampled_merge

    # Custom code for sampling data on higher TF
    dataframe_htf = resample_to_interval(dataframe, self.cust_ticker_interval)

    #Get MACD values of both time frame 
    
    macd = ta.MACD(dataframe)
    dataframe['macd'] = macd['macd']
    dataframe['macdsignal'] = macd['macdsignal']
    dataframe['macdhist'] = macd['macdhist']

    macd = ta.MACD(dataframe_htf)
    dataframe['macd_htf'] = macd['macd']
    dataframe['macdsignal_htf'] = macd['macdsignal']
    dataframe['macdhist_htf'] = macd['macdhist']

    # RSI 
    dataframe['rsi'] = ta.RSI(dataframe)
    dataframe['rsi_htf'] = ta.RSI(dataframe_htf)

    # EMA - Exponential Moving Average """
    dataframe['ema8'] = ta.EMA(dataframe, timeperiod=8)
    dataframe['ema13'] = ta.EMA(dataframe, timeperiod=13)
    dataframe['ema21'] = ta.EMA(dataframe, timeperiod=21)
    dataframe['ema55'] = ta.EMA(dataframe, timeperiod=55)
    dataframe['ema120'] = ta.EMA(dataframe, timeperiod=120)
    dataframe['ema233'] = ta.EMA(dataframe, timeperiod=233)


    # EMA - Exponential Moving Average """
    dataframe['ema55_htf'] = ta.EMA(dataframe_htf, timeperiod=55)
    dataframe['ema120_htf'] = ta.EMA(dataframe_htf, timeperiod=120)
    dataframe['ema233_htf'] = ta.EMA(dataframe_htf, timeperiod=233)

`

How to use indicators that return a Dataframe / Series?

Hello,
I came across the trendline indicator and the fib retracement indicator, but I cannot figure out how to use them in relation to a Dataframe as the majority of the portrayed example are assigning a single value back to the dataframe object while those indicators return more complex data.

One assumption that I tried was to use panda to merge the dataframe and the result of the trend indicator to obtain a dataframe that has the respective columns aligned with the relative price row in this manner:

result = dataframe.merge(trend, how='cross')
so that I will obtain a dataframe composed as:
image
So that I then can use something along the line of dataframe['close'] > dataframe['Min Line'] as a guard in my strategy.

but understandably it makes the system go out of memory in backtesting and dies with error 137. Is there a better way to implement what I need to do?

Sorry if it's a stupid question, I've tried to understand it but this is my first encounter with Panda data structures.

resampled_merge uses future data

The nearest neighbor interpolation

resampled = resampled.resample(str(interval) + 'min').interpolate(method='nearest')

uses data that lies in the future (see image below, 06:30 uses 08:00 of df_long).

technical_resample

So I would guess that skipping the interpolation step (just merge the dataframes) and fill the NaNs with previous values would fix this issue.

Ichimoku strategy: use of chikou

Good morning, everyone,

I hope you're all right. I'm turning to you to answer a quick question about the use of the ichimoku package. I would like to integrate the ichimoku into my Freqtrade trading strategy, but I'm a bit of a beginner. I would like to see how I can use chikou span in my strategy and compare it to senkou_a and senkou_b 26 periods backwards.

In ichimoku's basic strategy, for a buy signal, the price at time T or chikou must be higher than the value of senkou_a and senkou_b 26 periods backwards. I would like to know how I can incorporate this into my strategy.

Is this correct?

(dataframe['chikou']>dataframe['senkou_a'].shift(-26)) &
(dataframe['chikou']>dataframe['senkou_b'].shift(-26))

Thanks

docker-compose error

Hi, I´ve encountered a problem trying to use the technical dependency with docker-compose

Processing triggers for libc-bin (2.28-10) ...
Traceback (most recent call last):
File "/usr/local/bin/pip", line 5, in
from pip._internal.cli.main import main
File "/usr/local/lib/python3.9/site-packages/pip/_internal/cli/main.py", line 8, in
from pip._internal.cli.autocompletion import autocomplete
File "/usr/local/lib/python3.9/site-packages/pip/_internal/cli/autocompletion.py", line 9, in
from pip._internal.cli.main_parser import create_main_parser
File "/usr/local/lib/python3.9/site-packages/pip/_internal/cli/main_parser.py", line 7, in
from pip._internal.cli import cmdoptions
File "/usr/local/lib/python3.9/site-packages/pip/_internal/cli/cmdoptions.py", line 27, in
from pip._internal.models.target_python import TargetPython
File "", line 1007, in _find_and_load
File "", line 986, in _find_and_load_unlocked
File "", line 680, in _load_unlocked
File "", line 786, in exec_module
File "", line 922, in get_code
File "", line 980, in get_data
OSError: [Errno 5] Input/output error
ERROR: Service 'freqtrade' failed to build : The command '/bin/sh -c apt-get update && apt-get -y install git && apt-get clean && pip install git+https://github.com/freqtrade/technical' returned a non-zero code: 1

vwma - improve efficiency

vwma is currently implemented using the below code.

Using apply() here seems unnecessary, and apply is NOT a vectorized function, but does loop

return df.apply(lambda x: x.close * x.volume, axis=1).rolling(window).sum() / df.volume.rolling(window).sum()

Resample vs Informative merge

Hi,
first time using github and quite new to python, sorry for any inconvenience.
Resample and informative pairs have different behaviour while merging back to the main dataframe (1m/5m example attached).
I read the explanation of why Informative pair is merged this way (freqtrade/freqtrade#4073) and I think it is correct, but logic seems different for resample. Should not be the same?
I don't get if I am missing something in resample logic.

Resample_vs_Informative_Merge.xlsx

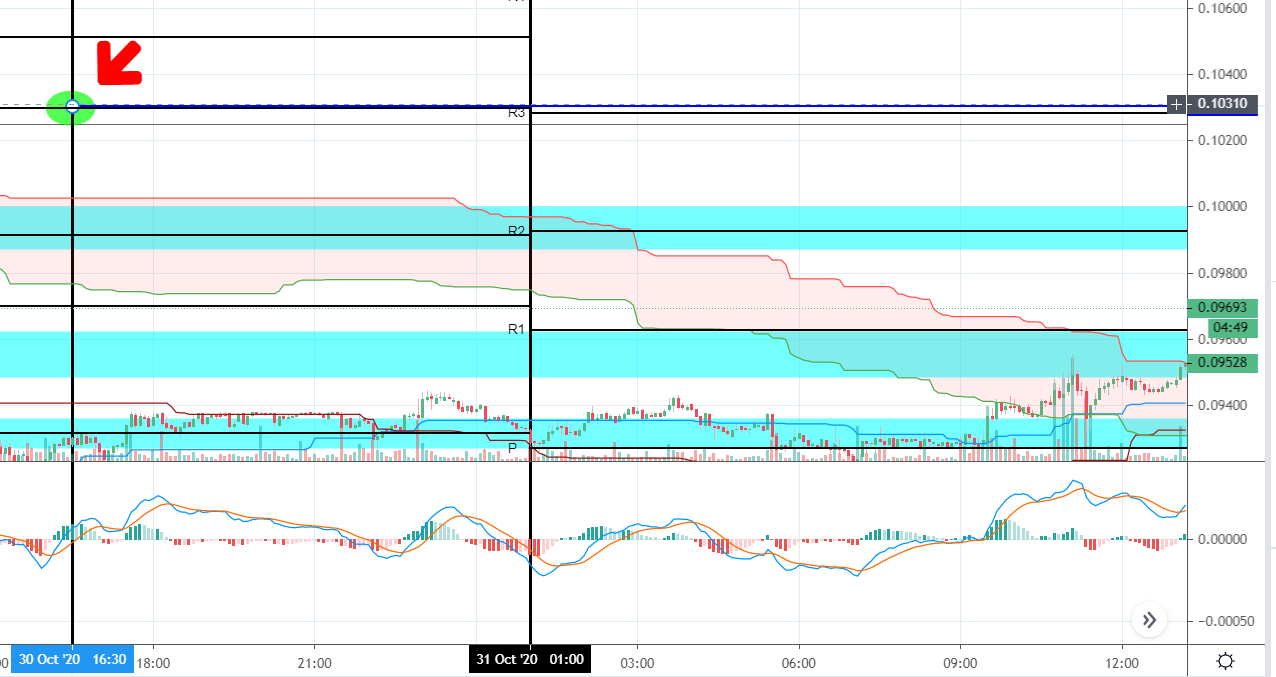
Pivot points

Hello I have got a problem trying to implement de Pivot Points Indicator, first of all sorry for my english.

Now, as we can see in trading view, the Indicator takes a value for R1, R2, R3, S1, S2, S3,... thats remains unchanged for a number of periods, for instance in this chart of 5 minutes timeframe (less than 15 minutes), is changed DAILY, is well explained in this link ''https://www.tradingview.com/support/solutions/43000521824-pivot-points-standard/''.
trading view

In my strategy, as a sell order I coded that, when the price close is above R2 its has to sell, the wierd thing is that almost always is selling even when the price is below R2 value, so I printed the value that the BOT was calculating for R2, and as we can see in this ADA/USDT chart the value for R2 was 0.10310 on 30 Oct 16:30, but the value that BOT was getting for R2 at that the exact time and exact date was 0.092989.
valor r2
valor r2 en bot

Also as I said before, the value for each suport and resistance level sould stay unchanged for 1 day, on every chart that is below 15min timeframes, and in the print of the dataframe.loc, the value for R2 is changed every 5 minutes, so it makes no sense for me, its not a support level anymore is more like a moving average.

Here is my code, hope you can help me, just to know if I did something wrong or for you to know if something must be fixed in the code of the indicator, thanks for your time.

pivots 1
pivots 2
pivots 3

docker-compose error

I´ve encountered a problem trying to use the technical dependency with docker-compose (I´m able to use it when running freqtrade without docker). When trying to backtest or run a custom strategy I get this message:

2020-12-29 13:56:12,112 - freqtrade.resolvers.iresolver - WARNING - Could not import /freqtrade/user_data/strategies/trend_strategy.py due to 'No module named 'technical.vendor''

I carefully followed the steps in the guide:

https://www.freqtrade.io/en/latest/docker_quickstart/#additional-dependencies-with-docker-compose

and also tryed from scratch 2 times, but so far I have not succeed. After verifying I can run freqtrade on the default image (docker-compose comands working fine), these are the steps I took to add technical dependency:

  1. Create the file with the installation steps Dockerfile.technical with the following instructions (copied from: https://github.com/freqtrade/freqtrade/blob/develop/docker/Dockerfile.technical ) :
FROM freqtradeorg/freqtrade:develop

RUN apt-get update \
    && apt-get -y install git \
    && apt-get clean \
    && pip install git+https://github.com/freqtrade/technical
  1. Modify the docker-compose.yml file as the stated in the guide. after that, my file looks like this:
---
version: '3'
services:
  freqtrade:
    #image: freqtradeorg/freqtrade:stable
    image: freqtradeorg/freqtrade:custom
    # image: freqtradeorg/freqtrade:develop
    # Use plotting image
    #image: freqtradeorg/freqtrade:stable_plot
    # Build step - only needed when additional dependencies are needed
    build:
      context: .
      dockerfile: "./Dockerfile.technical"
    restart: unless-stopped
    container_name: freqtrade
    volumes:
      - "./user_data:/freqtrade/user_data"
    # Default command used when running `docker compose up`
    command: >
      trade
      --logfile /freqtrade/user_data/logs/freqtrade.log
      --db-url sqlite:////freqtrade/user_data/tradesv3.sqlite
      --config /freqtrade/user_data/config.json
      --strategy SampleStrategy
  1. Run command docker-compose build, to build the new image.

After this steps freqtrade rus correctly, but I'm still not able to backtest or run strategies that require the technical dependency (from docker-compose). Please tell me if I´m missing something in my installation steps, I haven´t been able to find the problem

Thanks in advance for your time and for helping me

Do i run the instance double and how can kill one?

Hello everyone,

I changed my strategy and since i have this error log.

2021-02-03 16:20:05,842 - freqtrade.worker - INFO - Bot heartbeat. PID=1, version='2021.1', state='STOPPED' 2021-02-03 16:20:29,468 - telegram.ext.updater - ERROR - Error while getting Updates: Conflict: terminated by other getUpdates request; make sure that only one bot instance is running 2021-02-03 16:20:29,469 - telegram.ext.dispatcher - ERROR - No error handlers are registered, logging exception. Traceback (most recent call last): File "/root/.local/lib/python3.7/site-packages/telegram/ext/updater.py", line 465, in _network_loop_retry if not action_cb(): File "/root/.local/lib/python3.7/site-packages/telegram/ext/updater.py", line 420, in polling_action_cb allowed_updates=allowed_updates, File "<decorator-gen-31>", line 2, in get_updates File "/root/.local/lib/python3.7/site-packages/telegram/bot.py", line 135, in decorator result = func(*args, **kwargs) File "/root/.local/lib/python3.7/site-packages/telegram/bot.py", line 2639, in get_updates 'getUpdates', data, timeout=float(read_latency) + float(timeout), api_kwargs=api_kwargs File "/root/.local/lib/python3.7/site-packages/telegram/bot.py", line 245, in _post return self.request.post(f'{self.base_url}/{endpoint}', data=data, timeout=timeout) File "/root/.local/lib/python3.7/site-packages/telegram/utils/request.py", line 354, in post **urlopen_kwargs, File "/root/.local/lib/python3.7/site-packages/telegram/utils/request.py", line 276, in _request_wrapper raise Conflict(message) telegram.error.Conflict: Conflict: terminated by other getUpdates request; make sure that only one bot instance is running

when i do docker-compose ps i get this

Schermafbeelding 2021-02-03 om 17 40 11

do i have to kill the proces after i backtest something?
this is my first time using docker so i don't know much about it.

HELP

` def Ichimoku_Score(self, dataframe, conversion_line_period = 9, base_line_periods = 26, laggin_span = 52, displacement = 26):
df = dataframe.copy()

    # # Heikin Ashi Strategy
    heikinashi = qtpylib.heikinashi(df)
    df['ha_open'] = heikinashi['open']
    df['ha_close'] = heikinashi['close']
    df['ha_high'] = heikinashi['high']
    df['ha_low'] = heikinashi['low']
    
    df['tenkan'] = (df['ha_high'].rolling(window=conversion_line_period).max()+ df['ha_low'].rolling(window=conversion_line_period).min()) / 2
    df['kijun']  = (df['ha_high'].rolling(window=base_line_periods).max()+ df['ha_low'].rolling(window=base_line_periods).min()) / 2
    df['leading_senkou_a'] = (df['tenkan'] + df['kijun']) / 2
    df['leading_senkou_b'] = (df['ha_high'].rolling(window=laggin_span).max()+ df['ha_low'].rolling(window=laggin_span).min()) / 2
    df['senkou_span_a'] = df['leading_senkou_a'].shift(displacement)
    df['senkou_span_b'] = df['leading_senkou_b'].shift(displacement)
    df['chikou_span'] = df['ha_close'].shift(-displacement)
    
    # cloud_green = (senkou_span_a > senkou_span_b)
    # cloud_red = (senkou_span_b > senkou_span_a)


    def calcTkCross():
        
        if ((df['tenkan'] > df['kijun']) and (df['tenkan'] < df['kijun'])):
            Intersect=((df['tenkan'].shift(1) * (df['kijun'] - df['kijun'].shift(1)) - df['kijun'].shift(1) * (df['tenkan'] - df['tenkan'].shift(1))) / ((df['kijun'] - df['kijun'].shift(1)) - (df['tenkan'] - df['tenkan'].shift(1))))
            
            if (Intersect > df['senkou_span_a']) and (Intersect > df['senkou_span_b']):
                return 2
            elif (Intersect < df['senkou_span_a']) and (Intersect < df['senkou_span_b']):
                return 0.5
            else :
                return 1
            
        elif ((df['tenkan'] < df['kijun']) and (df['tenkan'] > df['kijun'])):
            Intersect=((df['tenkan'].shift(1) * (df['kijun'] - df['kijun'].shift(1)) - df['kijun'].shift(1) * (df['tenkan'] - df['tenkan'].shift(1))) / ((df['kijun'] - df['kijun'].shift(1)) - (df['tenkan'] - df['tenkan'].shift(1))))
            
            if (Intersect < df['senkou_span_a']) and (Intersect < df['senkou_span_b']):
                return -2
            elif (Intersect > df['senkou_span_a']) and (Intersect > df['senkou_span_b']):
                return -0.5
            else :
                return -1
        
        else :
            return 0

    return calcTkCross()`

File "/home/wupeng1211/freqtrade-strategies/user_data/strategies/Ichimoku.py", line 274, in calcTkCross
if ((df['tenkan'] > df['kijun']) and (df['tenkan'] < df['kijun'])):
File "/home/wupeng1211/freqtrade/.env/lib/python3.7/site-packages/pandas/core/generic.py", line 1330, in nonzero
f"The truth value of a {type(self).name} is ambiguous. "
ValueError: The truth value of a Series is ambiguous. Use a.empty, a.bool(), a.item(), a.any() or a.all().

Dependabot couldn't find the branch develop

Dependabot was set up to create pull requests against the branch develop, but couldn't find it.

If the branch has been permanently deleted you can update Dependabot's target branch in the .dependabot/config.yml file in this repo.

You can mention @dependabot in the comments below to contact the Dependabot team.

On performance of different implementations of indicators

...on our 'basic' function, SMA

Below, SMA20 was used on the 'standard' freqtrade dataframe with 500 (actually 499) rows, with ohlcv data).

Snippet used for measurements (I simply inserted it into populate_indicators() to be recalculated multiple times at each throttling):

        ################################################
        print("@@@ .")
        #from functools import partial
        import timeit
        from statistics import mean

        #l = lambda: ta.SMA(dataframe, 20) #1)
        #l = lambda: qtpylib.sma(dataframe['close'], 20) #2)
        #l = lambda: numpy.mean(numpy_rolling_window(dataframe['close'], 20), axis=-1) #3)
        l = lambda: dataframe['close'].rolling(window=20, min_periods=20).mean() #4)

        times = timeit.Timer(l).repeat(repeat=10, number=10000)
        print(f"@@@ .. mean={mean(times)}")
        ################################################
  1. some functions in technical use sma from pyti. Do not even want to measure it, the library seems to be no longer supported.
    1. (ta-lib) is fastest (right, no surpise). ~1 sec for 10000x10 calculations at my sample i5-4250U CPU @ 1.30GHz (4 core).
  • 2), 3) (both are qptylib's appoach) is ~1.5-2.5 times slower
    1. 'native pandas' ~5-8 times slower, 10000x10 calculations as measured with timeit above.

However:

  • pyti -- see above
  • qtpylib, it uses shamanic numpy strides (numpy.lib.stride_tricks.as_strided(data, shape=shape, strides=strides)) and produces the following deprecation (it should have been suppressed somewhere in qtpylib):
FutureWarning: Series.strides is deprecated and will be removed in a future version
  strides = data.strides + (data.strides[-1],)
  • native pandas is slower, but each indicator is calculated only once every throttling; for backtesting and hyperopt, even when calculated on longer series, it does not produce significant overhead, imho... Indicators are not calculated hundreds thousand times...

Memory leak problem in Ichimoku Indicator.

Memory usage will increase until it reaches 100%.
This is happening slowly. For example, it will increase by 15% every 10 minutes.
This problem causes the robot to be automatically killed by the operating system after about 45 minutes.
My strategy :

# --- Do not remove these libs ---
from freqtrade.strategy.interface import IStrategy
from typing import Dict, List
from functools import reduce
from pandas import DataFrame
# --------------------------------
import technical.indicators as ta


class icu(IStrategy):
    """

    author@: Gert Wohlgemuth

    idea:

        uptrend definition:
            MACD above MACD signal
            and CCI < -50

        downtrend definition:
            MACD below MACD signal
            and CCI > 100

    """

    # Minimal ROI designed for the strategy.
    # This attribute will be overridden if the config file contains "minimal_roi"
    minimal_roi = {
        "120":  0.03,
        "60":  0.06,
        "40":  0.08,
        "20":  0.1
    }

    # Optimal stoploss designed for the strategy
    # This attribute will be overridden if the config file contains "stoploss"
    stoploss = -0.1
    order_types = {
    "buy": "limit",
    "sell": "limit",
    "emergencysell": "market",
    "stoploss": "market",
    "stoploss_on_exchange": False,
    "stoploss_on_exchange_interval": 60,
    "stoploss_on_exchange_limit_ratio": 0.99,
    }
    # Optimal ticker interval for the strategy
    ticker_interval = '5m'

    def populate_indicators(self, dataframe: DataFrame, metadata: dict) -> DataFrame:
        # ichimoku
        ichi = ta.ichimoku(dataframe)
        dataframe['tenkan']=ichi['tenkan_sen']
        dataframe['kijun']=ichi['kijun_sen']
        dataframe['senkou_a']=ichi['senkou_span_a']
        dataframe['senkou_b']=ichi['senkou_span_b']
        dataframe['cloud_green']=ichi['cloud_green']
        dataframe['cloud_red']=ichi['cloud_red']

        return dataframe

    def populate_buy_trend(self, dataframe: DataFrame, metadata: dict) -> DataFrame:
        dataframe.loc[
            (
                (dataframe['tenkan'].shift(1)<dataframe['kijun'].shift(1)) &
                (dataframe['tenkan']>dataframe['kijun'])
                (dataframe['cloud_red']==True)
            ),
            'buy'] = 1
        return dataframe

    def populate_sell_trend(self, dataframe: DataFrame, metadata: dict) -> DataFrame:
        dataframe.loc[
            (
            ),
            'sell'] = 1
        return dataframe

How to use "Madrid Trend Squeeze"

Hi!

I have been peeking into the "Madrid Trend Squeeze" trade indicator, and I would really like to implement it in my strategy, but I really don't know how to start at all. How to call this indicator in the lib section / populate indicators / buy and sell trend. I'am clueless for now, can someone help me out? These technical indicators are really good, but frankly I don't know the way how to implement any of them, especially the "Madrid Trend Squeeze".
Thanks for any help!

MOST indicator

i am work to write this indicator....
https://tr.tradingview.com/v/28ZcW4nv/ MOST by Anıl ÖZEKŞİ
actually good filtering buy or sell ... her is the code...
my problem is
so slow the backtesting. where is the wrong or why my codes are so slow in the backtesting?

def MOST(dataframe , percent, length):
    import talib.abstract as ta
    emacol = 'ema_' + str(length) + '_' + str(percent)
    mostcol = 'most_' + str(length) + '_' + str(percent)
    dataframe[emacol] = ta.EMA( dataframe , timeperiod = length)
    dataframe[emacol] = dataframe[emacol].fillna(method="bfill")
    dataframe['tempema'] = 0.000000
    dataframe['trend'] = -1
    dataframe[mostcol] = 0.000000
    for i in range(1,len(dataframe[emacol])):
        if (dataframe['trend'][i-1] == 1) & (dataframe['tempema'][i-1] >= dataframe[emacol][i]):
            dataframe.loc[i,'tempema'] = dataframe.loc[i-1,'tempema']
        elif (dataframe['trend'][i-1] == 1) & (dataframe['tempema'][i-1] < dataframe[emacol][i]):
            dataframe.loc[i,'tempema'] = dataframe.loc[i,emacol]
        elif (dataframe['trend'][i-1] == -1) & (dataframe['tempema'][i-1] <= dataframe[emacol][i]):
            dataframe.loc[i,'tempema'] = dataframe.loc[i-1,'tempema']
        elif (dataframe['trend'][i-1] == -1) & (dataframe['tempema'][i-1] > dataframe[emacol][i]):
            dataframe.loc[i,'tempema'] = dataframe.loc[i,emacol]
        
        if (dataframe[emacol][i] >= dataframe[mostcol][i-1]) & (dataframe['trend'][i-1] == 1):
            dataframe.loc[i,'trend'] = 1
            dataframe.loc[i,mostcol] = dataframe['tempema'][i]*(1-percent)
        elif (dataframe[emacol][i] <= dataframe[mostcol][i-1]) & (dataframe['trend'][i-1] == -1):
            dataframe.loc[i,'trend'] = -1
            dataframe.loc[i,mostcol] = dataframe['tempema'][i]*(1+percent)
        elif (dataframe[emacol][i] >= dataframe[mostcol][i-1]) & (dataframe['trend'][i-1] == -1):
            dataframe.loc[i,'trend'] = 1
            dataframe.loc[i,mostcol] = dataframe['tempema'][i]*(1-percent)
        elif (dataframe[emacol][i] <= dataframe[mostcol][i-1]) & (dataframe['trend'][i-1] == 1):
            dataframe.loc[i,'trend'] = -1
            dataframe.loc[i,mostcol] = dataframe['tempema'][i]*(1+percent)
    return {
        emacol : dataframe[emacol] ,
        mostcol : dataframe[mostcol]
    }

Resample_to_interval dataframe

Hey guys,
I have checked modification in code for resample_to_interval. I modified my code according to commits here: freqtrade/freqtrade-strategies#63 and here: #59.

When I backtested strategy and print out my resample_indicators (plus_di, minus_di and roc in my case) and then compare printed message with binance chart I get results shifted by one candle.
Let me explain in more details on print screens.
Btw I am resampling 1h to 1d candles by using dataframe_long = resample_to_interval(dataframe, 1440) – I hope I got this right.

Here is a printed table from backtesting:
resampled

And here is print screened chart of the same coin on 1d timeframe from binance:
LTC_BTC

As you can see printed indicators tells me that there was res_plus_di, res_minus_di and res_roc at 17.7, 25.9 and -3% in 1/10/2020, respectively. When you check the chart you can see these values at the candle from 1/09/2020. So shifted by one into the past.
I do not know if this is a purpose, mistake or I did code something wrong.

Please could you advise how to shift these values to their proper candle?

Reimplement Bollinger bands

Bollinger bands should not rely on pyti - which calculates the same SMA (and stddev, for that matter) multiple times.

affected function: bollinger_bands.

Vortex Indicator - written by myself

Hi!
I've written Python code for Vortex Indicator. Since I'm only a newbie, could you check that code? I can't get almost any profit when backtesting.

     def vortex_indicator_plus(window = 14):

            df = dataframe.copy()
            try:
                df['tr1'] = (df['high']- df['low'])
                df['tr2'] = (df['high']- df['close'].shift(1))
                df['tr3'] = (df['low'] - df['close'].shift(1))
                df['true_range'] = df[['tr1', 'tr2', 'tr3']].values.max(1)
            except ValueError:
                return np.nan
            min_periods = window
            df['trn'] = df['true_range'].rolling(window, min_periods=min_periods).sum()
            df['vmp'] = np.abs(df['high'] - df['low'].shift(1))
            df['vmm'] = np.abs(df['low'] - df['high'].shift(1))
            vip = df['vmp'].rolling(window, min_periods=min_periods).sum() / df['trn']
            vin = df['vmm'].rolling(window, min_periods=min_periods).sum() / df['trn']

            return vip
def vortex_indicator_minus(window=14):

            df = dataframe.copy()
            try:
                df['tr1'] = (df['high'] - df['low'])
                df['tr2'] = (df['high'] - df['close'].shift(1))
                df['tr3'] = (df['low'] - df['close'].shift(1))
                df['true_range'] = df[['tr1', 'tr2', 'tr3']].values.max(1)
            except ValueError:
                return np.nan
            min_periods = window
            df['trn'] = df['true_range'].rolling(window, min_periods=min_periods).sum()
            df['vmp'] = np.abs(df['high'] - df['low'].shift(1))
            df['vmm'] = np.abs(df['low'] - df['high'].shift(1))
            vip = df['vmp'].rolling(window, min_periods=min_periods).sum() / df['trn']
            vin = df['vmm'].rolling(window, min_periods=min_periods).sum() / df['trn']
            return vin

Thank you very much!

ichimoku .shift error

  1. Subject)
    profit according to the backtest report,
    However, he does not trade during the live test.
    That's why he made the wrong calculation because of chikouspan and didn't trade during the live test.
    i don't know what the solution is

(dataframe['chikou']>dataframe['close'].shift(60)) instead of (dataframe['close']>dataframe['close'].shift(60))
the test results are very different. However, both codes should give the same result.
`

from freqtrade.strategy.interface import IStrategy
from typing import Dict, List
from functools import reduce
from pandas import DataFrame

import talib.abstract as ta
import freqtrade.vendor.qtpylib.indicators as qtpylib
from technical.indicators import ichimoku

class ichimoku(IStrategy):
   
    minimal_roi = {
        "0": 1
    }
    stoploss = -0.1

    trailing_stop = True
    trailing_stop_positive = 0.15
    trailing_stop_positive_offset = 0.20
    trailing_only_offset_is_reached = True

    
    # Optimal ticker interval for the strategy
    ticker_interval = '30m'

    def populate_indicators(self, dataframe: DataFrame, metadata: dict) -> DataFrame:
        
        ichi=ichimoku(dataframe)
        dataframe['tenkan']=ichi['tenkan_sen']
        dataframe['kijun']=ichi['kijun_sen']
        dataframe['senkou_a']=ichi['senkou_span_a']
        dataframe['senkou_b']=ichi['senkou_span_b']
        dataframe['cloud_green']=ichi['cloud_green']
        dataframe['cloud_red']=ichi['cloud_red']
        dataframe['chikou']=ichi['chikou_span']
        return dataframe

    def populate_buy_trend(self, dataframe: DataFrame, metadata: dict) -> DataFrame:
        dataframe.loc[
            (
                

                (qtpylib.crossed_above(dataframe['tenkan'],dataframe['kijun'] )) &
                (dataframe['chikou']>dataframe['close'].shift(60))
            ),
            'buy'] = 1
        return dataframe

    def populate_sell_trend(self, dataframe: DataFrame, metadata: dict) -> DataFrame:
        dataframe.loc[
            (
                (qtpylib.crossed_above(dataframe['kijun'],dataframe['tenkan'] ))&
                (dataframe['chikou']<dataframe['close'].shift(60))
            ),
            'sell'] = 1
        return dataframe
  1. subject)
    Also, is the following code correct for the chikouspan condition above the cloud?
    according to this day; chikouspan 60 candles behind, cloud 60 candles ahead.
    There are 120 candles among them

(dataframe['chikou']>dataframe['senkou_a'].shift(120))& (dataframe['chikou']>dataframe['senkou_b'].shift(120))

  1. Subject)
    With the command ".shift (displacement)" in the code in "indicators.py"; is the cloud shifting to the left?
    Normally the cloud shifts to the right
    df['senkou_span_b'] = ((high_52 + low_52) / 2).shift(displacement)

chikouspan = shifting the current price along the x candle to the left.
However, "shift (-displacement)" will go to the right.
df['chikou_span'] = df['close'].shift(-displacement)

  1. Subject)
    These two codes should give the same result. But when I test the codes separately, the backtest results are different

(dataframe['tenkan'].shift(1)<dataframe['kijun'].shift(1)) & (dataframe['tenkan']>dataframe['kijun'])

(qtpylib.crossed_above(dataframe['tenkan'],dataframe['kijun'] ))

Note: I'm just learning python with udemy courses.

volume weigted macd indicator

hi i use this indicator.. anyone should helpfull.. here is the tradingview's link
https://tr.tradingview.com/script/wVe6AfGA-VOLUME-WEIGHTED-MACD-V2-VWMACDV2-BY-KIVAN%C3%87-fr3762/

def vwmacd(dataframe, fastperiod=12, slowperiod=26, signalperiod=9):
# //author: KIVANC @fr3762 on twitter
# https://tr.tradingview.com/script/wVe6AfGA-VOLUME-WEIGHTED-MACD-V2-VWMACDV2-BY-KIVAN%C3%87-fr3762/
# study("VOLUME WEIGHTED MACD V2", shorttitle="VWMACDV2")
# fastperiod = input(12,title="fastperiod",type=integer,minval=1,maxval=500)
# slowperiod = input(26,title="slowperiod",type=integer,minval=1,maxval=500)
# signalperiod = input(9,title="signalperiod",type=integer,minval=1,maxval=500)
# fastMA = ema(volume*close, fastperiod)/ema(volume, fastperiod)
# slowMA = ema(volume*close, slowperiod)/ema(volume, slowperiod)
# vwmacd = fastMA - slowMA
# signal = ema(vwmacd, signalperiod)
# hist= vwmacd - signal
# plot(vwmacd, color=blue, linewidth=2)
# plot(signal, color=red, linewidth=2)
# plot(hist, color=green, linewidth=4, style=histogram)
# plot(0, color=black)
    import talib.abstract as ta
    df = dataframe.copy()
    df["fastMA"] = ta.EMA(df["volume"]*df["close"], fastperiod) / ta.EMA(df["volume"], fastperiod)
    df["slowMA"] = ta.EMA(df["volume"]*df["close"], slowperiod) / ta.EMA(df["volume"], slowperiod)
    df["vwmacd"] = df["fastMA"] - df["slowMA"]
    df["signal"] = ta.EMA(df["vwmacd"], signalperiod)
    df["hist"] = df["vwmacd"] - df["signal"]
    df = df.drop(
        columns=['fastMA', 'slowMA', 'high', 'low', 'close', 'open']
    )
#return columns vwmacd,signal,hist
    return df

Ichimoku indicator

I am interested in using the Ichimoku indicator but it looks like it's not yet available in the package. Do you know when it will be available?

Also, I am novice at python. I know how to figure things out but I'm sure it takes me quite a bit longer to resolve issues than it does most developers. You mentioned that you would like to some help with adding more indicators. It's something I would like to help with although I am sure I would need some guidance.

Thanks

consensus indicator used in strategy

Hi,
my brother and I have been working on consensus based strategy. Buy signals if hyperopted are nice. The problem we have encountered is heavy bot lag on rpi4, atom NAS and pc as well. During live trading about 2 - 5 minute delay was observed between bot logs and binance order placing. Sometimes orders weren't placed at all, ROI was not triggered and stoplimit orders were not cancled and reopened after 60s on binance to allow for trailing.
At first we had process_only_new_candles=false, but tested with =True and at least on atom NAS bot was placing acting quite ok, except for first 2 minutes of each candle, when indicators and scores were calculated.
On rpi4 each freqtrade instance in docker uses 100% of CPU time regardless of process_only_new_candles setting.

here is strategy file:

pragma pylint: disable=missing-docstring, invalid-name, pointless-string-statement

--- Do not remove these libs ---

import numpy as np # noqa
import pandas as pd # noqa
from pandas import DataFrame

from freqtrade.strategy.interface import IStrategy

--------------------------------

Add your lib to import here

import talib.abstract as ta
import freqtrade.vendor.qtpylib.indicators as qtpylib

from technical.consensus import Consensus

class strategijaconsensus(IStrategy):
"""
This is a strategy template to get you started.
More information in https://github.com/freqtrade/freqtrade/blob/develop/docs/bot-optimization.md

You can:
    :return: a Dataframe with all mandatory indicators for the strategies
- Rename the class name (Do not forget to update class_name)
- Add any methods you want to build your strategy
- Add any lib you need to build your strategy

You must keep:
- the lib in the section "Do not remove these libs"
- the prototype for the methods: minimal_roi, stoploss, populate_indicators, populate_buy_trend,
populate_sell_trend, hyperopt_space, buy_strategy_generator
"""
# Strategy interface version - allow new iterations of the strategy interface.
# Check the documentation or the Sample strategy to get the latest version.
INTERFACE_VERSION = 2

# Minimal ROI designed for the strategy.
# This attribute will be overridden if the config file contains "minimal_roi".
minimal_roi = {
    "0": 0.10607,
    "88": 0.06485,
    "242": 0.0211,
    "777": 0
}

# Optimal stoploss designed for the strategy.
# This attribute will be overridden if the config file contains "stoploss".
stoploss = -0.0203

# Trailing stoploss
trailing_stop = True
trailing_only_offset_is_reached = False
trailing_stop_positive = 0.01004
trailing_stop_positive_offset = 0.01115  # Disabled / not configured

# Optimal timeframe for the strategy.
timeframe = '30m'

# Run "populate_indicators()" only for new candle.
process_only_new_candles = True

# These values can be overridden in the "ask_strategy" section in the config.
use_sell_signal = True
sell_profit_only = False
ignore_roi_if_buy_signal = False

# Number of candles the strategy requires before producing valid signals
startup_candle_count: int = 30

# Optional order type mapping.
order_types = {
    'buy': 'limit',
    'sell': 'limit',
    'emergencysell': 'market',
    'forcesell': 'market',
    'stoploss': 'market',
    'stoploss_on_exchange': True,
    'stoploss_on_exchange_interval': 60,
    'stoploss_on_exchange_limit_ratio': 1.0
}

# Optional order time in force.
order_time_in_force = {
    'buy': 'gtc',
    'sell': 'gtc'
}

plot_config = {
    # Main plot indicators (Moving averages, ...)
    'main_plot': {
        'tema': {},
        'sar': {'color': 'white'},
    },
    'subplots': {
        # Subplots - each dict defines one additional plot
        "MACD": {
            'macd': {'color': 'blue'},
            'macdsignal': {'color': 'orange'},
        },
        "RSI": {
            'rsi': {'color': 'red'},
        }
    }
}
def informative_pairs(self):
    """
    Define additional, informative pair/interval combinations to be cached from the exchange.
    These pair/interval combinations are non-tradeable, unless they are part
    of the whitelist as well.
    For more information, please consult the documentation
    :return: List of tuples in the format (pair, interval)
        Sample: return [("ETH/USDT", "5m"),
                        ("BTC/USDT", "15m"),
                        ]
    """
    return []

def populate_indicators(self, dataframe: DataFrame, metadata: dict) -> DataFrame:
    """
    Adds several different TA indicators to the given DataFrame

    Performance Note: For the best performance be frugal on the number of indicators
    you are using. Let uncomment only the indicator you are using in your strategies
    or your hyperopt configuration, otherwise you will waste your memory and CPU usage.
    :param dataframe: Dataframe with data from the exchange
    :param metadata: Additional information, like the currently traded pair
    :return: a Dataframe with all mandatory indicators for the strategies
    """
    # Consensus strategy
    # add c.evaluate_indicator bellow to include it in the consensus score (look at
    # consensus.py in freqtrade technical)
    # add custom indicator with c.evaluate_consensus(prefix=<indicator name>)
    c = Consensus(dataframe)
    c.evaluate_rsi()
    c.evaluate_stoch()
    c.evaluate_macd_cross_over()
    c.evaluate_macd()
    c.evaluate_hull()
    c.evaluate_vwma()
    c.evaluate_tema(period=12)
    c.evaluate_ema(period=24)
    c.evaluate_sma(period=12)
    c.evaluate_laguerre()
    c.evaluate_osc()
    c.evaluate_cmf()
    c.evaluate_cci()
    c.evaluate_cmo()
    c.evaluate_ichimoku()
    c.evaluate_ultimate_oscilator()
    c.evaluate_williams()
    c.evaluate_momentum()
    c.evaluate_adx()
    dataframe['consensus_buy'] = c.score()['buy']
    dataframe['consensus_sell'] = c.score()['sell']


    return dataframe

def populate_buy_trend(self, dataframe: DataFrame, metadata: dict) -> DataFrame:
    """
    Based on TA indicators, populates the buy signal for the given dataframe
    :param dataframe: DataFrame populated with indicators
    :param metadata: Additional information, like the currently traded pair
    :return: DataFrame with buy column
    """
    dataframe.loc[
        (
            (dataframe['consensus_buy'] > 34) &
            (dataframe['volume'] > 0)  # Make sure Volume is not 0
        ),
        'buy'] = 1

    return dataframe

def populate_sell_trend(self, dataframe: DataFrame, metadata: dict) -> DataFrame:
    """
    Based on TA indicators, populates the sell signal for the given dataframe
    :param dataframe: DataFrame populated with indicators
    :param metadata: Additional information, like the currently traded pair
    :return: DataFrame with buy column
    """
    dataframe.loc[
        (
            (dataframe['consensus_sell'] > 88) &
            (dataframe['volume'] > 0)  # Make sure Volume is not 0
        ),
        'sell'] = 1
    return dataframe

Recommend Projects

  • React photo React

    A declarative, efficient, and flexible JavaScript library for building user interfaces.

  • Vue.js photo Vue.js

    🖖 Vue.js is a progressive, incrementally-adoptable JavaScript framework for building UI on the web.

  • Typescript photo Typescript

    TypeScript is a superset of JavaScript that compiles to clean JavaScript output.

  • TensorFlow photo TensorFlow

    An Open Source Machine Learning Framework for Everyone

  • Django photo Django

    The Web framework for perfectionists with deadlines.

  • D3 photo D3

    Bring data to life with SVG, Canvas and HTML. 📊📈🎉

Recommend Topics

  • javascript

    JavaScript (JS) is a lightweight interpreted programming language with first-class functions.

  • web

    Some thing interesting about web. New door for the world.

  • server

    A server is a program made to process requests and deliver data to clients.

  • Machine learning

    Machine learning is a way of modeling and interpreting data that allows a piece of software to respond intelligently.

  • Game

    Some thing interesting about game, make everyone happy.

Recommend Org

  • Facebook photo Facebook

    We are working to build community through open source technology. NB: members must have two-factor auth.

  • Microsoft photo Microsoft

    Open source projects and samples from Microsoft.

  • Google photo Google

    Google ❤️ Open Source for everyone.

  • D3 photo D3

    Data-Driven Documents codes.