GithubHelp home page GithubHelp logo

hipages / php-fpm_exporter Goto Github PK

View Code? Open in Web Editor NEW
593.0 11.0 119.0 693 KB

A prometheus exporter for PHP-FPM.

License: Apache License 2.0

Go 92.99% Dockerfile 1.88% Makefile 1.72% Shell 3.40%
prometheus prometheus-exporter php-fpm golang

php-fpm_exporter's Introduction

php-fpm_exporter

Test Go Report Card GoDoc Quality Gate Status Docker Pulls Average time to resolve an issue Percentage of issues still open Open Source Helpers All Contributors

A prometheus exporter for PHP-FPM. The exporter connects directly to PHP-FPM and exports the metrics via HTTP.

A webserver such as NGINX or Apache is NOT needed!

Table of Contents

Features

  • Export single or multiple pools
  • Export to CLI as text or JSON
  • Connects directly to PHP-FPM via TCP or Socket
  • Maps environment variables to CLI options
  • Fix for PHP-FPM metrics oddities
  • Grafana Dashboard for Kubernetes

Usage

php-fpm_exporter is released as binary and docker image. It uses sensible defaults which usually avoids the need to use command parameters or environment variables.

php-fpm_exporter supports 2 commands, get and server. The get command allows to retrieve information from PHP-FPM without running as a server and exposing an endpoint. The server command runs the server required for prometheus to retrieve the statistics.

Options and defaults

Option Description Environment variable Default value
--web.listen-address Address on which to expose metrics and web interface. PHP_FPM_WEB_LISTEN_ADDRESS :9253
--web.telemetry-path Path under which to expose metrics. PHP_FPM_WEB_TELEMETRY_PATH /metrics
--phpfpm.scrape-uri FastCGI address, e.g. unix:///tmp/php.sock;/status or tcp://127.0.0.1:9000/status PHP_FPM_SCRAPE_URI tcp://127.0.0.1:9000/status
--phpfpm.fix-process-count Enable to calculate process numbers via php-fpm_exporter since PHP-FPM sporadically reports wrong active/idle/total process numbers. PHP_FPM_FIX_PROCESS_COUNT false
--log.level Only log messages with the given severity or above. Valid levels: [debug, info, warn, error, fatal] (default "error") PHP_FPM_LOG_LEVEL info

Why --phpfpm.fix-process-count?

php-fpm_exporter implements an option to "fix" the reported metrics based on the provided processes list by PHP-FPM.

We have seen PHP-FPM provide metrics (e.g. active processes) which don't match reality. Specially active processes being larger than max_children and the actual number of running processes on the host. Looking briefly at the source code of PHP-FPM it appears a scoreboard is being kept and the values are increased/decreased once an action is executed. The metric active processes is also an accumulation of multiple states (e.g. Reading headers, Getting request information, Running). Which shouldn't matter and active processes should still be equal or lower to max_children.

--phpfpm.fix-process-count will emulate PHP-FPMs implementation including the accumulation of multiple states.

If you like to have a more granular reporting please use phpfpm_process_state.

CLI Examples

  • Retrieve information from PHP-FPM running on 127.0.0.1:9000 with status endpoint being /status

    php-fpm_exporter get
    
  • Retrieve information from PHP-FPM running on 127.0.0.1:9000 and 127.0.0.1:9001

    php-fpm_exporter get --phpfpm.scrape-uri tcp://127.0.0.1:9000/status,tcp://127.0.0.1:9001/status
    
  • Run as server with 2 pools:

    php-fpm_exporter server --phpfpm.scrape-uri tcp://127.0.0.1:9000/status,tcp://127.0.0.1:9001/status
    
  • Run as server and enable process count fix via environment variable:

    PHP_FPM_FIX_PROCESS_COUNT=1 go run main.go server --web.listen-address ":12345" --log.level=debug
    

Docker Examples

  • Run docker manually

    docker pull hipages/php-fpm_exporter
    docker run -it --rm -e PHP_FPM_SCRAPE_URI="tcp://127.0.0.1:9000/status,tcp://127.0.0.1:9001/status" hipages/php-fpm_exporter
    
  • Run the docker-compose example

    git clone [email protected]:hipages/php-fpm_exporter.git
    cd php-fpm_exporter/test
    docker-compose -p php-fpm_exporter up
    

    You can now access the following links:

    asciicast

Kubernetes Example

TBD

Metrics collected

# HELP phpfpm_accepted_connections The number of requests accepted by the pool.
# TYPE phpfpm_accepted_connections counter
# HELP phpfpm_active_processes The number of active processes.
# TYPE phpfpm_active_processes gauge
# HELP phpfpm_idle_processes The number of idle processes.
# TYPE phpfpm_idle_processes gauge
# HELP phpfpm_listen_queue The number of requests in the queue of pending connections.
# TYPE phpfpm_listen_queue gauge
# HELP phpfpm_listen_queue_length The size of the socket queue of pending connections.
# TYPE phpfpm_listen_queue_length gauge
# HELP phpfpm_max_active_processes The maximum number of active processes since FPM has started.
# TYPE phpfpm_max_active_processes counter
# HELP phpfpm_max_children_reached The number of times, the process limit has been reached, when pm tries to start more children (works only for pm 'dynamic' and 'ondemand').
# TYPE phpfpm_max_children_reached counter
# HELP phpfpm_max_listen_queue The maximum number of requests in the queue of pending connections since FPM has started.
# TYPE phpfpm_max_listen_queue counter
# HELP phpfpm_process_last_request_cpu The %cpu the last request consumed.
# TYPE phpfpm_process_last_request_cpu gauge
# HELP phpfpm_process_last_request_memory The max amount of memory the last request consumed.
# TYPE phpfpm_process_last_request_memory gauge
# HELP phpfpm_process_request_duration The duration in microseconds of the requests.
# TYPE phpfpm_process_request_duration gauge
# HELP phpfpm_process_requests The number of requests the process has served.
# TYPE phpfpm_process_requests counter
# HELP phpfpm_process_state The state of the process (Idle, Running, ...).
# TYPE phpfpm_process_state gauge
# HELP phpfpm_scrape_failures The number of failures scraping from PHP-FPM.
# TYPE phpfpm_scrape_failures counter
# HELP phpfpm_slow_requests The number of requests that exceeded your 'request_slowlog_timeout' value.
# TYPE phpfpm_slow_requests counter
# HELP phpfpm_start_since The number of seconds since FPM has started.
# TYPE phpfpm_start_since counter
# HELP phpfpm_total_processes The number of idle + active processes.
# TYPE phpfpm_total_processes gauge
# HELP phpfpm_up Could PHP-FPM be reached?
# TYPE phpfpm_up gauge

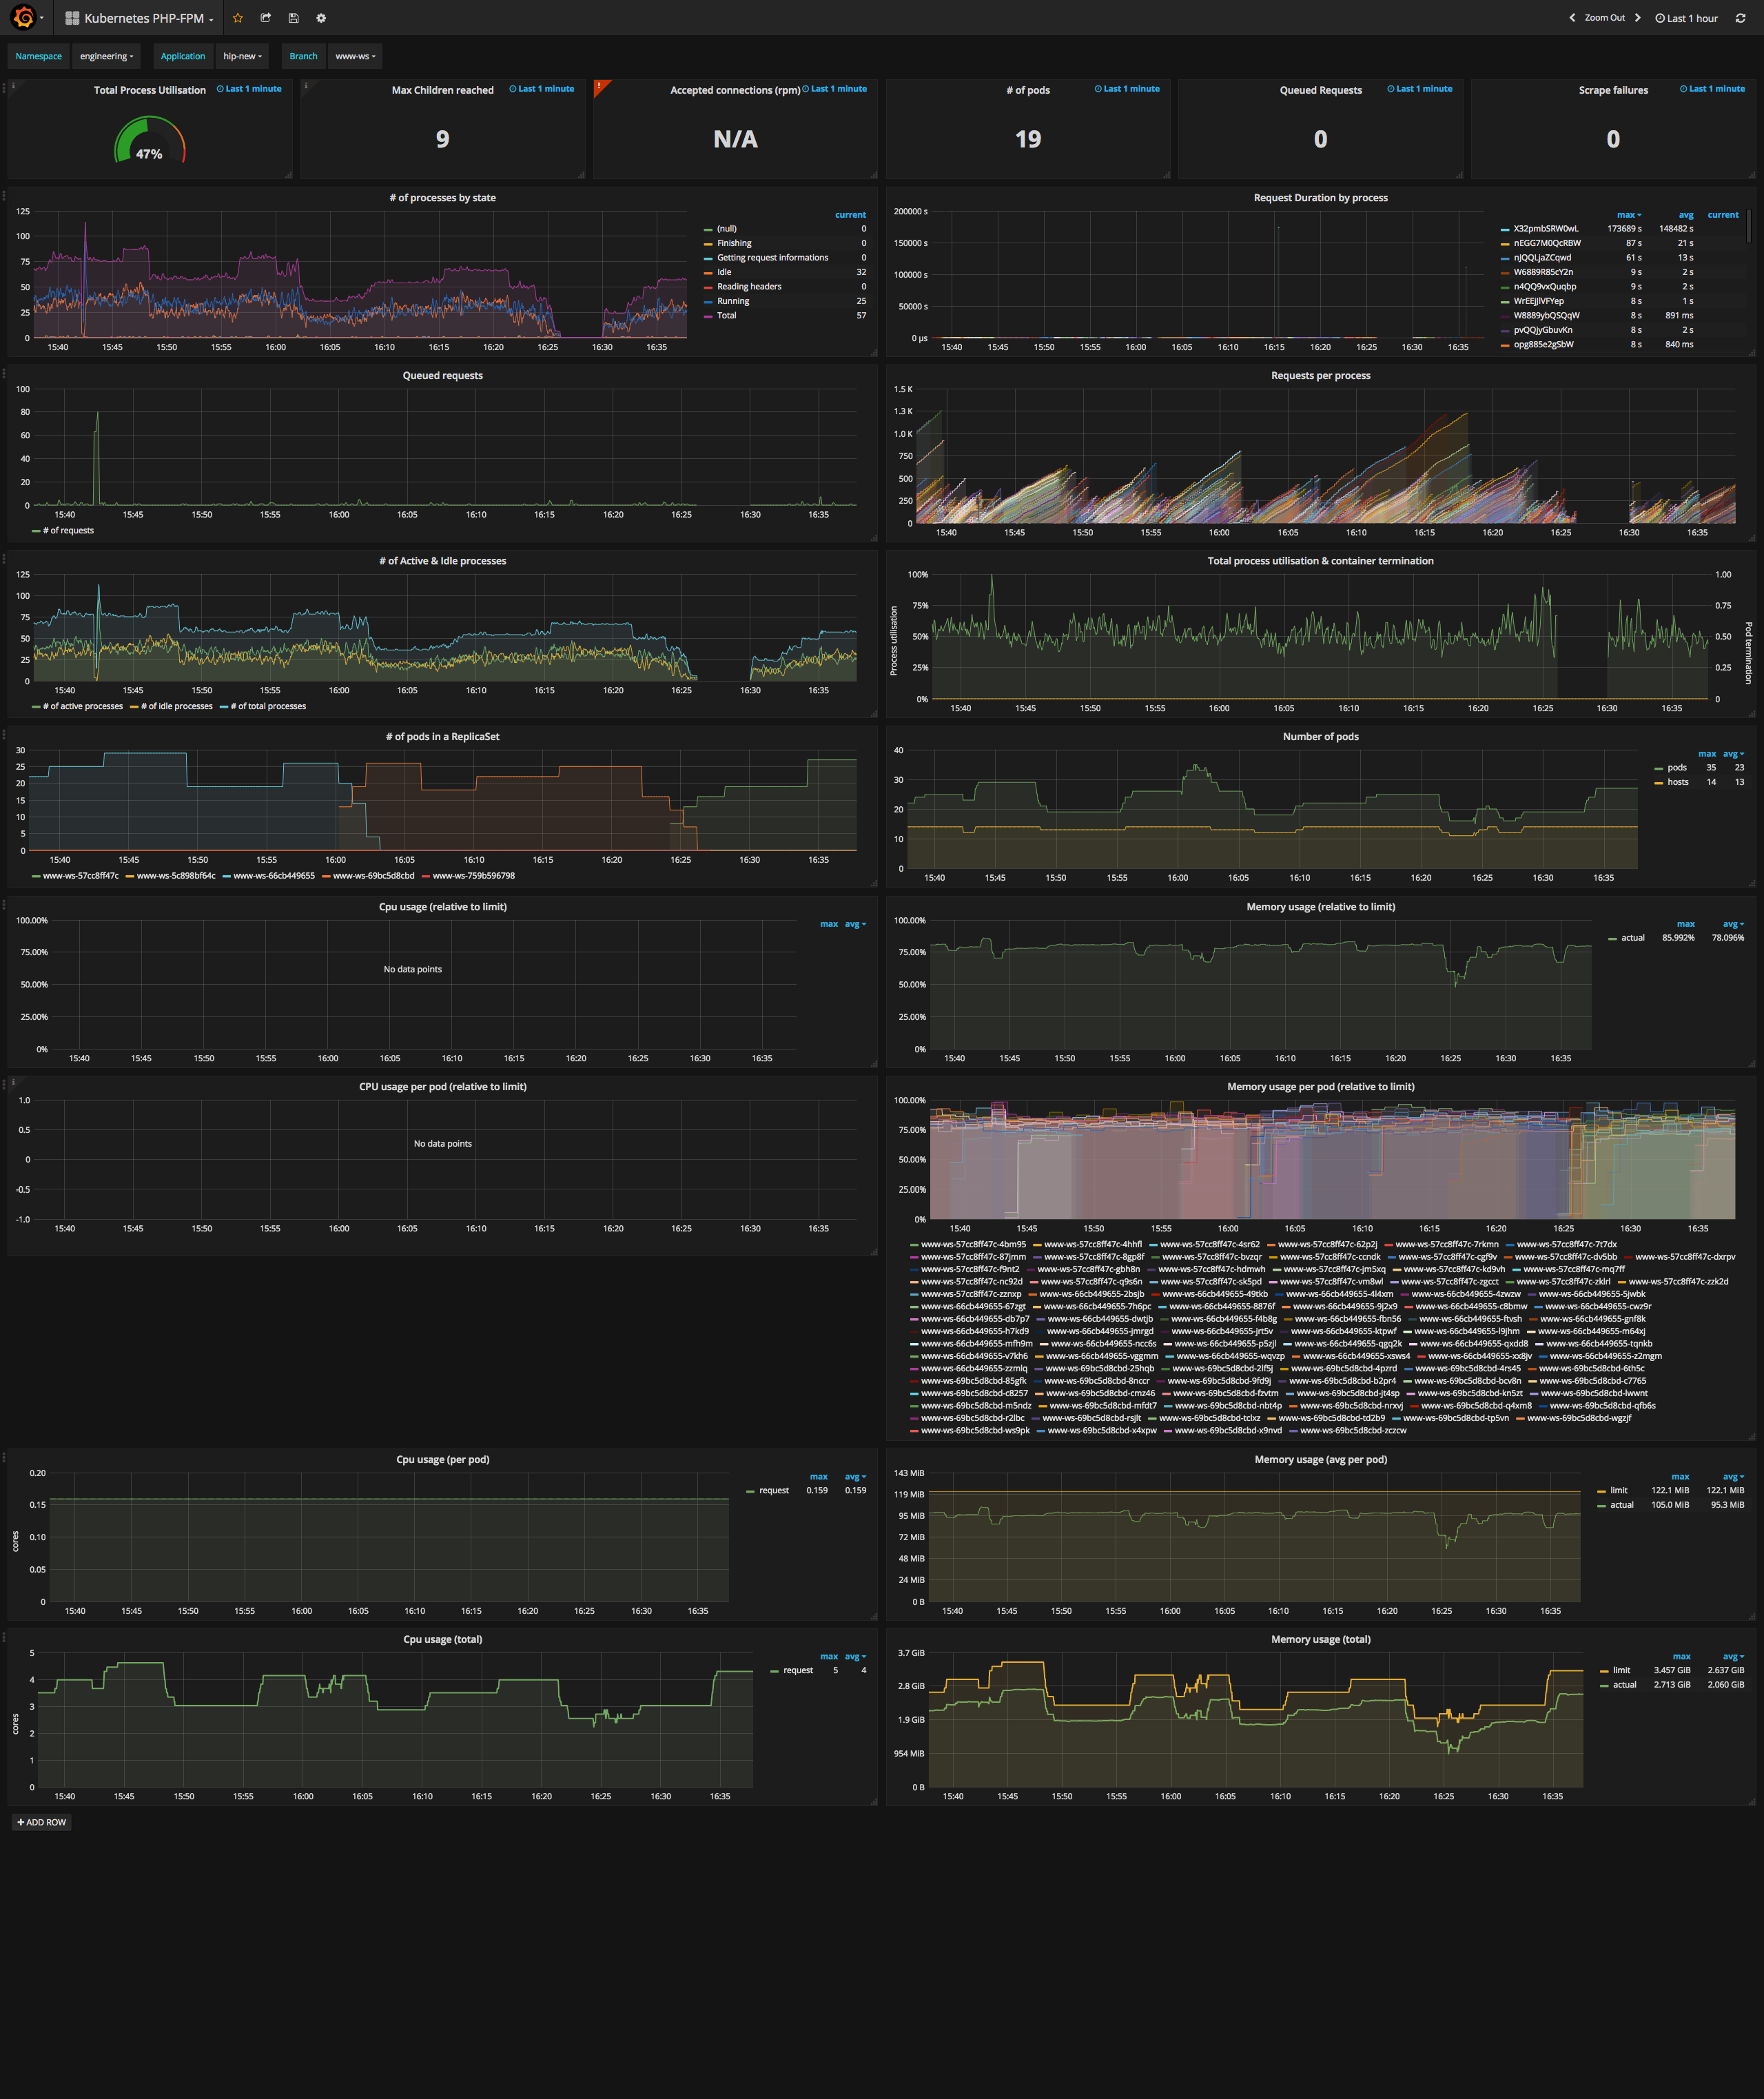
Grafana Dasbhoard for Kubernetes

The Grafana dashboard can be found here. There is also a more generic version here.

FAQ

  • How to update "Metrics collected"?

    Copy&paste the output from:

    curl http://127.0.0.1:12345/metrics | grep phpfpm | grep "#"
    

Development

E2E Tests

The E2E tests are based on docker-compose and bats-core. Install the required components, e.g. via brew on MacOS:

brew tap kaos/shell
brew install docker-compose bats-core kaos/shell/bats-assert kaos/shell/bats-support

After the components are installed run the E2E tests:

make test-e2e

Contributing

Contributions are greatly appreciated. The maintainers actively manage the issues list, and try to highlight issues suitable for newcomers. The project follows the typical GitHub pull request model. See " How to Contribute to Open Source " for more details. Before starting any work, please either comment on an existing issue, or file a new one.

Contributors

Thanks goes to these wonderful people (emoji key):


Enrico Stahn

💬 💻 📖 🚧 ⚠️

Stanislav Antic

💻

herb

💻

Smoked Cheese

🐛 💻

Alexander

💻

Stan Xing

💻

itcsoft54

💻

John S Long

🚇

Daniel O'Callaghan

💻

Simon Stücher

🐛

André Sterba

💻

This project follows the all-contributors specification. Contributions of any kind welcome!

Stargazers over time

Stargazers over time

Alternatives

php-fpm_exporter's People

Contributors

adduc avatar allcontributors[bot] avatar andresterba avatar cuppett avatar danielocallaghan avatar dependabot-preview[bot] avatar dependabot[bot] avatar estahn avatar fisherking avatar itcsoft54 avatar kierenevans avatar lapo-luchini avatar nyoroon avatar renovate-bot avatar renovate[bot] avatar sas1024 avatar sirantd avatar stchr avatar xoor avatar

Stargazers

 avatar  avatar  avatar  avatar  avatar  avatar  avatar  avatar  avatar  avatar  avatar  avatar  avatar  avatar  avatar  avatar  avatar  avatar  avatar  avatar  avatar  avatar  avatar  avatar  avatar  avatar  avatar  avatar  avatar  avatar  avatar  avatar  avatar  avatar  avatar  avatar  avatar  avatar  avatar  avatar  avatar  avatar  avatar  avatar  avatar  avatar  avatar  avatar  avatar  avatar  avatar  avatar  avatar  avatar  avatar  avatar  avatar  avatar  avatar  avatar  avatar  avatar  avatar  avatar  avatar  avatar  avatar  avatar  avatar  avatar  avatar  avatar  avatar  avatar  avatar  avatar  avatar  avatar  avatar  avatar  avatar  avatar  avatar  avatar  avatar  avatar  avatar  avatar  avatar  avatar  avatar  avatar  avatar  avatar  avatar  avatar  avatar  avatar  avatar  avatar

Watchers

 avatar  avatar  avatar  avatar  avatar  avatar  avatar  avatar  avatar  avatar  avatar

php-fpm_exporter's Issues

Two pools in the same php-fpm socket

Hello, how are you ?

Is there anyway to get metrics about two or more pools that are running in the same php-fpm socket ?

I'm running like this:

./php-fpm_exporter server --phpfpm.scrape-uri 'unix:///var/run/php/php7.1-fpm-cliente-magento.sock;/status' --phpfpm.fix-process-count

I've setup two pools in this socket, but I'm getting metrics just about one pool.

Thanks.

Expose metric `process duration`

As seen in #10 PHP-FPMs process duration reporting is faulty at times. To monitor the effects of long-running processes and request_terminate_timeout this metric will be added.

The automated release is failing 🚨

🚨 The automated release from the master branch failed. 🚨

I recommend you give this issue a high priority, so other packages depending on you could benefit from your bug fixes and new features.

You can find below the list of errors reported by semantic-release. Each one of them has to be resolved in order to automatically publish your package. I’m sure you can resolve this 💪.

Errors are usually caused by a misconfiguration or an authentication problem. With each error reported below you will find explanation and guidance to help you to resolve it.

Once all the errors are resolved, semantic-release will release your package the next time you push a commit to the master branch. You can also manually restart the failed CI job that runs semantic-release.

If you are not sure how to resolve this, here is some links that can help you:

If those don’t help, or if this issue is reporting something you think isn’t right, you can always ask the humans behind semantic-release.


Missing package.json file.

A package.json file at the root of your project is required to release on npm.

Please follow the npm guideline to create a valid package.json file.


Good luck with your project ✨

Your semantic-release bot 📦🚀

adding more pools getting 500 error

Hi,

i have added two pools using server command and i get 500 error.
server returned error: HTTP/1.1 500 Internal Server Error

command:

php-fpm_exporter server --phpfpm.scrape-uri tcp://10.100.63.316:9002/upstream-php71-status,tcp://10.100.124.49:9002/upstream-php71-status

Note adding 1 pool works fine.

Exporter scrape failed

Hello, I'm having a problem
Exporter doesn't get the metrics (Scrape failed). I think the reason is my config doesn't fit with my server
I created file config in order to convenient for set up

#config.sh
#!/bin/bash
#PHP-FPM Environment Variables
PHP_FPM_WEB_LISTEN_ADDRESS="10.60.32.187:21201"
PHP_FPM_WEB_TELEMETRY_PATH="/metrics"
PHP_FPM_SCRAPE_URI=tcp://127.0.0.1:9000/status
PHP_FPM_FIX_PROCESS_COUNT=true
PHP_FPM_LOG_LEVEL=debug

After running exporter, exporter doesnt get the data, Pool is empty

# HELP phpfpm_scrape_failures The number of failures scraping from PHP-FPM.
# TYPE phpfpm_scrape_failures counter
phpfpm_scrape_failures{pool="",scrape_uri="tcp://127.0.0.1:9000/status"} 1
# HELP phpfpm_up Could PHP-FPM be reached?
# TYPE phpfpm_up gauge
phpfpm_up{pool="",scrape_uri="tcp://127.0.0.1:9000/status"} 0

I doubt about variables PHP_FPM_SCRAPE_URI was set up wrong, not fit vs system. (I get FastCGI address in file php-fpm.conf)

; The address on which to accept FastCGI requests.
; Valid syntaxes are:
;   'ip.add.re.ss:port'    - to listen on a TCP socket to a specific IPv4 address on
;                            a specific port;
;   '[ip:6:addr:ess]:port' - to listen on a TCP socket to a specific IPv6 address on
;                            a specific port;
;   'port'                 - to listen on a TCP socket to all IPv4 addresses on a
;                            specific port;
;   '[::]:port'            - to listen on a TCP socket to all addresses
;                            (IPv6 and IPv4-mapped) on a specific port;
;   '/path/to/unix/socket' - to listen on a unix socket.
; Note: This value is mandatory.
listen = 127.0.0.1:9000

I look forward to receiving the help of everyone. Thank you!

feature: should support option to disable go_collector mertics and disable phpfpm process metrics

Sorry for writing a issue again...

  • First:

When I run the program and visit /metrics, I found they includes many go_collector metrics. This has nothing to do with php_fpm and can not be disabled. Mybe someone think it is helpful to debug exporter self. But I feel they are noise and take up a lot of space. So may be should have a flag to control whether this behavior is enabled.

➜ curl http://localhost:9253/metrics                   
# HELP go_gc_duration_seconds A summary of the pause duration of garbage collection cycles.
# TYPE go_gc_duration_seconds summary
go_gc_duration_seconds{quantile="0"} 0
go_gc_duration_seconds{quantile="0.25"} 0
go_gc_duration_seconds{quantile="0.5"} 0
go_gc_duration_seconds{quantile="0.75"} 0
go_gc_duration_seconds{quantile="1"} 0
go_gc_duration_seconds_sum 0
go_gc_duration_seconds_count 0
# HELP go_goroutines Number of goroutines that currently exist.
# TYPE go_goroutines gauge

...
  • Second:

The exporter expose phpfpm every process metrics in detail. But I think each container will produce very many processes a day. So even if this information is collected, it cannot be displayed in detail in the dashboard. I don't think these make sense. May be should have an option to disable to scrape process state. For example, this is my config for phpfpm pool:

pm = dynamic
pm.start_servers = 12
pm.max_children = 100
pm.process_idle_timeout = 10s
pm.min_spare_servers = 5
pm.max_spare_servers = 20

The number of processes will change automatically based on load. If keep this behavior, too many pid will be produced and collected.

Can't connect to unix socket file

I am having a bad time trying to run it connecting to the unix socket file.

The log whe I try to scrape:

exporter_1    | time="2019-06-18T17:25:47Z" level=error msg="dial unix :: connect: no such file or directory"

I am using version 1.0.0 and I have already checked #19 but with no success.

To reproduce it I have forked the project and pushed the changes to different branch so if everything runs fine I can submit a pull request with the unix socket file example.

The test is available here: https://github.com/wsilva/php-fpm_exporter/tree/unix-socket-test/test just docker-compose up or docker-compose up -d and check the logs

To check the changes I made from the version 1.0.0:

git diff v1.0.0..unix-socket-test

Please help, I have no idea about what I am missing.

Report actual PID

We currently reporting a hash based on process StartTime and PID as PID. The reason behind this is to uniquely identify processes across multiple containers and on container restarts.

As this might be confusing to some we will change this as follow:

  • Rename label pid for all phpfpm_process_* to hash
  • Label phpfpm_process_* metrics with pid and hash

Expose PHP-FPM Pool metrics

In order to drill further down how PHP-FPM behaves on Kubernetes it would be good to look at the following metrics:

  • Memory consumption per process
  • Age per process
  • Requests served per process

Error scraping PHP-FPM: invalid character 'c' after object key:value pair

From time to time, and usually two times in a row, we get the following error:

time="2018-05-23T04:52:38+02:00" level=debug msg="Pool[unix:///dev/shm/.php-fpm-www.socket;/php-fpm-www_status]: {\"pool\":\"www\",\"process manager\":\"dynamic\",\"start time\":1524128546,\"start since\":2915412,\"accepted conn\":609721,\"listen queue\":0,\"max listen queue\":0,\"listen queue len\":0,\"idle processes\":17,\"active processes\":2,\"total processes\":19,\"max active processes\":17,\"max children reached\":0,\"slow requests\":6, \"processes\":[{\"pid\":3915,\"state\":\"Idle\",\"start time\":1527039619,\"start since\":4339,\"requests\":314,\"request duration\":37475,\"request method\":\"GET\",\"request uri\":\"/vbseo.php\",\"content length\":0,\"user\":\"-\",\"script\":\"/www/myforum.com/vbseo.php\",\"last request cpu\":80.05,\"last request memory\":6291456},{\"pid\":3872,\"state\":\"Idle\",\"start time\":1527039607,\"start since\":4351,\"requests\":315,\"request duration\":30692,\"request method\":\"GET\",\"request uri\":\"/showthread.php?t=56371&page=14&p=525978\",\"content length\":0,\"user\":\"-\",\"script\":\"/www/myforum.com/vbseo.php\",\"last request cpu\":65.16,\"last request memory\":6291456},{\"pid\":2712,\"state\":\"Idle\",\"start time\":1527039447,\"start since\":4511,\"requests\":325,\"request duration\":75745,\"request method\":\"GET\",\"request uri\":\"/vbseo.php\",\"content length\":0,\"user\":\"-\",\"script\":\"/www/myforum.com/vbseo.php\",\"last request cpu\":79.21,\"last request memory\":8388608},{\"pid\":786,\"state\":\"Idle\",\"start time\":1527039189,\"start since\":4769,\"requests\":341,\"request duration\":61293,\"request method\":\"GET\",\"request uri\":\"/member.php?tab=activitystream&type=user&u=48390\",\"content length\":0,\"user\":\"-\",\"script\":\"/www/myforum.com/vbseo.php\",\"last request cpu\":81.58,\"last request memory\":8388608},{\"pid\":3471,\"state\":\"Idle\",\"start time\":1527039557,\"start since\":4401,\"requests\":319,\"request duration\":24029,\"request method\":\"GET\",\"request uri\":\"/css.php?userid=109621&cssuid=0&d=1526688000&td=ltr&styleid=0&sheet=userprofile.css\",\"content length\":0,\"user\":\"-\",\"script\":\"/www/myforum.com/vbseo.php\",\"last request cpu\":83.23,\"last request memory\":5505024},{\"pid\":5560,\"state\":\"Idle\",\"start time\":1527039843,\"start since\":4115,\"requests\":299,\"request duration\":145588,\"request method\":\"GET\",\"request uri\":\"/index.php\",\"content length\":0,\"user\":\"-\",\"script\":\"/www/myforum.com/vbseo.php\",\"last request cpu\":75.56,\"last request memory\":9437184},{\"pid\":14203,\"state\":\"Idle\",\"start time\":1527022056,\"start since\":21902,\"requests\":1852,\"request duration\":223628,\"request method\":\"GET\",\"request uri\":\"/vbseo.php?pp=40\\\",\"content length\":0,\"user\":\"-\",\"script\":\"/www/myforum.com/vbseo.php\",\"last request cpu\":40.25,\"last request memory\":7602176},{\"pid\":13435,\"state\":\"Idle\",\"start time\":1527036435,\"start since\":7523,\"requests\":574,\"request duration\":25887,\"request method\":\"GET\",\"request uri\":\"/attachment.php?attachmentid=92642\",\"content length\":0,\"user\":\"-\",\"script\":\"/www/myforum.com/vbseo.php\",\"last request cpu\":77.26,\"last request memory\":5242880},{\"pid\":16724,\"state\":\"Idle\",\"start time\":1527036888,\"start since\":7070,\"requests\":534,\"request duration\":24909,\"request method\":\"GET\",\"request uri\":\"/css.php?userid=57961&cssuid=0&d=1525436596&td=ltr&styleid=0&sheet=userprofile.css\",\"content length\":0,\"user\":\"-\",\"script\":\"/www/myforum.com/vbseo.php\",\"last request cpu\":80.29,\"last request memory\":5505024},{\"pid\":20246,\"state\":\"Idle\",\"start time\":1527037377,\"start since\":6581,\"requests\":483,\"request duration\":81230,\"request method\":\"GET\",\"request uri\":\"/css.php?styleid=7&langid=1&d=1498640725&td=ltr&sheet=activitystream.css,sidebar.css,forumbits.css,postbit.css,postbit-lite.css,showthread.css,member.css,user,57961\",\"content length\":0,\"user\":\"-\",\"script\":\"/www/myforum.com/vbseo.php\",\"last request cpu\":36.93,\"last request memory\":5767168},{\"pid\":11343,\"state\":\"Running\",\"start time\":1527026174,\"start since\":17784,\"requests\":1358,\"request duration\":131,\"request method\":\"GET\",\"request uri\":\"/php-fpm-www_status?json&full\",\"content length\":0,\"user\":\"-\",\"script\":\"-\",\"last request cpu\":0.00,\"last request memory\":0},{\"pid\":1124,\"state\":\"Idle\",\"start time\":1527043730,\"start since\":228,\"requests\":17,\"request duration\":288,\"request method\":\"GET\",\"request uri\":\"/php-fpm-www_status?json&full\",\"content length\":0,\"user\":\"-\",\"script\":\"-\",\"last request cpu\":0.00,\"last request memory\":262144},{\"pid\":1555,\"state\":\"Running\",\"start time\":1527029298,\"start since\":14660,\"requests\":1071,\"request duration\":76318,\"request method\":\"GET\",\"request uri\":\"/vbseo.php\",\"content length\":0,\"user\":\"-\",\"script\":\"/www/myforum.com/vbseo.php\",\"last request cpu\":0.00,\"last request memory\":0},{\"pid\":21234,\"state\":\"Idle\",\"start time\":1527027536,\"start since\":16422,\"requests\":1226,\"request duration\":106054,\"request method\":\"GET\",\"request uri\":\"/index.php\",\"content length\":0,\"user\":\"-\",\"script\":\"/www/myforum.com/vbseo.php\",\"last request cpu\":84.86,\"last request memory\":8388608},{\"pid\":2496,\"state\":\"Idle\",\"start time\":1527024938,\"start since\":19020,\"requests\":1516,\"request duration\":28053,\"request method\":\"GET\",\"request uri\":\"/css.php?styleid=7&langid=1&d=1498640725&td=ltr&sheet=activitystream.css,sidebar.css,forumbits.css,postbit.css,postbit-lite.css,showthread.css,member.css,user,109621\",\"content length\":0,\"user\":\"-\",\"script\":\"/www/myforum.com/vbseo.php\",\"last request cpu\":71.29,\"last request memory\":6029312},{\"pid\":1803,\"state\":\"Idle\",\"start time\":1527024845,\"start since\":19113,\"requests\":1523,\"request duration\":87234,\"request method\":\"GET\",\"request uri\":\"/vbseo.php\",\"content length\":0,\"user\":\"-\",\"script\":\"/www/myforum.com/vbseo.php\",\"last request cpu\":91.71,\"last request memory\":7340032},{\"pid\":28318,\"state\":\"Idle\",\"start time\":1527038495,\"start since\":5463,\"requests\":394,\"request duration\":328685,\"request method\":\"GET\",\"request uri\":\"/vbseo.php\",\"content length\":0,\"user\":\"-\",\"script\":\"/www/myforum.com/vbseo.php\",\"last request cpu\":57.81,\"last request memory\":12582912},{\"pid\":15603,\"state\":\"Idle\",\"start time\":1527022259,\"start since\":21699,\"requests\":1830,\"request duration\":106650,\"request method\":\"GET\",\"request uri\":\"/member.php?u=58736&tab=likes_received\",\"content length\":0,\"user\":\"-\",\"script\":\"/www/myforum.com/vbseo.php\",\"last request cpu\":56.26,\"last request memory\":8388608},{\"pid\":6557,\"state\":\"Idle\",\"start time\":1527025507,\"start since\":18451,\"requests\":1430,\"request duration\":65876,\"request method\":\"GET\",\"request uri\":\"/member.php?u=28953&tab=aboutme\",\"content length\":0,\"user\":\"-\",\"script\":\"/www/myforum.com/vbseo.php\",\"last request cpu\":91.08,\"last request memory\":8388608}]}"
time="2018-05-23T04:52:38+02:00" level=error msg="invalid character 'c' after object key:value pair"
time="2018-05-23T04:52:38+02:00" level=debug msg="Updated 1 pool(s) in 1.965012ms"
time="2018-05-23T04:52:38+02:00" level=error msg="Error scraping PHP-FPM: invalid character 'c' after object key:value pair"

And a few times we got this error (we don't have the full debug line, because debug wasn't enabled then):

time="2018-05-21T13:21:39+02:00" level=error msg="Error scraping PHP-FPM: invalid character '%' after object key:value pair"

Looking at the json, I would say that it is correct, so I have no idea what could be the issue.

Grafana Dashboard does not filter/get variable "Branch" - Kubernetes environment

Hi all!

I installed an container "php-fpm_exporter" as sidecar in my Kubernetes Deployment for my php application. The /metrics expose correctly and send to prometheus server.

selecao_223

I added grafana dashboard, but the variable "Branch" does not appear correctly, show only "None".

Grafana Version: grafana/grafana:5.0.0

selecao_222

This is query for get variable Branch: label_values(phpfpm_up{kubernetes_namespace="$namespace",app="$app"},hip_new)

selecao_221

Anybody can help me, any idea?

Thanks!

High cardinality from `pid_hash` label

Hi 👋

Thanks for sharing this exporter, I really appreciate the insight it's given us.

I just wanted to create an issue because I've noticed that the default setup will add the pid_hash label. In our setup where we have 5 replicas of an application with a fixed 128 process count, that leads to 640 series. And when we redeploy every few hours... that's a cardinality explosion waiting to happen!

I just wondered if this is something that should possibly be documented or turned off by default, and added with a flag. I could look at adding this if you think there's merit?

Add a metric to count scrape failures

Add a metric to count scrape failures. In cases, we fail to scrape PHP-FPM for metrics (e.g. due to too many requests) we should expose this situation.

feature: add option to control whether scraping go_collector mertics is disabled

When I run the program and visit /metrics, I found they includes many go_collector metrics. This has nothing to do with php_fpm and can not be disabled. Mybe someone think it is helpful to debug exporter self. But I feel they are noise and take up a lot of space. So may be should have a flag to control whether this behavior is enabled.

➜ curl http://localhost:9253/metrics                   
# HELP go_gc_duration_seconds A summary of the pause duration of garbage collection cycles.
# TYPE go_gc_duration_seconds summary
go_gc_duration_seconds{quantile="0"} 0
go_gc_duration_seconds{quantile="0.25"} 0
go_gc_duration_seconds{quantile="0.5"} 0
go_gc_duration_seconds{quantile="0.75"} 0
go_gc_duration_seconds{quantile="1"} 0
go_gc_duration_seconds_sum 0
go_gc_duration_seconds_count 0
# HELP go_goroutines Number of goroutines that currently exist.
# TYPE go_goroutines gauge

...

ERRO[0000] invalid character 'N' looking for beginning of value

Hello,

I can't scrape on a unix socket (running commands as root) :

php-fpm_exporter get --phpfpm.scrape-uri unix:///run/php/php7.1-fpm-www.sock;/status --log.level debug
> ERRO[0000] invalid character 'N' looking for beginning of value
Address: unix:///run/php/php7.1-fpm-www.sock
Pool:
Start time: Mon, 01 Jan 0001 00:00:00 +0000
Start since: 0
Accepted connections: 0
Listen Queue: 0
Max Listen Queue: 0
Listen Queue Length: 0
Idle Processes: 0
Active Processes: 0
Total Processes: 0
Max active processes: 0
Max children reached: 0
Slow requests: 0

bash: /status: Aucun fichier ou dossier de ce type

where there is no pb when using a fci port :

php-fpm_exporter get --phpfpm.scrape-uri tcp://127.0.0.1:9000/status
Address: tcp://127.0.0.1:9000/status
Pool: www
Start time: Mon, 22 Oct 2018 00:48:02 +0200
Start since: 30772
Accepted connections: 13
Listen Queue: 0
Max Listen Queue: 0
Listen Queue Length: 128
Idle Processes: 2
Active Processes: 1
Total Processes: 3
Max active processes: 2
Max children reached: 0
Slow requests: 0

Can't figure what's going on.

Using with k8s

Dear, first of all. You guys did a really nice job here ! Thanks for making it available.

I was hoping you could give me some pointers on how I best use this exporter in k8s.

I have an application that has the following setup:

  • A k8s service pointing towards a deployment
  • A k8s deployment
  • Each of these deployment's pods runs a php-fpm and a nginx container.

Using this exporter, should I add the exporter to every pod or do I run only 1 instance of the exporter and somehow (automatically when scaling up / down) point it towards every php-fpm instance.

I was thinking of running the exporter per pod.

But i'm not sure this is the right way to go ahead - any pointers would be appreciated

Can not connect to unix socket file

 # ./php-fpm_exporter_0.4.1_linux_amd64 server --web.listen-address localhost:9101 --phpfpm.scrape-uri unix:///var/run/php71-fpm.sock
INFO[0000] Starting server on localhost:9101 with path /metrics

then test using curl output

ERRO[0002] dial unix :: connect: no such file or directory
ERRO[0002] Error scraping PHP-FPM: dial unix :: connect: no such file or directory

just because uri.Hostname() and uri.Port() is empty when address is unix socket file path at phpfpm/phpfpm.go Line160

I will send a pull request for this issue later.

why not catch SIGTERM signal?

First, thanks for your contributions,this project is very perfect. But i hava a issue why SIGTERM signal are not captured in the code?

Int fact, in many management tools,they will send SIGTERM signal to notify process to shutdown, such as docker stop or kubectl delete pod and so on.

Can SIGTERM signal processing be add? I will be willing to submit a PR.

https://github.com/hipages/php-fpm_exporter/blob/master/cmd/server.go#L98

		// We'll accept graceful shutdowns when quit via SIGINT (Ctrl+C)
		// SIGKILL, SIGQUIT or SIGTERM (Ctrl+/) will not be caught.
		signal.Notify(c, os.Interrupt)

feature: add an option to control whether collecting phpfpm process state metrics

The exporter expose phpfpm every process metrics in detail. But I think each container will produce very many processes a day. So even if this information is collected, it cannot be displayed in detail in the dashboard. I don't think these make sense. May be should have an option to disable to scrape process state. For example, this is my config for phpfpm pool:

pm = dynamic
pm.start_servers = 12
pm.max_children = 100
pm.process_idle_timeout = 10s
pm.min_spare_servers = 5
pm.max_spare_servers = 20

The number of processes will change automatically based on load. If keep this behavior, too many pid will be produced and collected.

Exporter do not work from docker container with host socket

I have php7.2-fpm on /run/php/php7.2-fpm-www.sock

test command works just fine

SCRIPT_NAME=/status SCRIPT_FILENAME=/status REQUEST_METHOD=GET QUERY_STRING=full REMOTE_ADDR=127.0.0.1 cgi-fcgi -bind -connect /run/php/php7.2-fpm.sock

image

tried a couple different approaches to run exporter from docker, but failed

using volume + docker-container up

version: "3"
services:
  exporter:
    image: hipages/php-fpm_exporter:0.5.3
    ports:
      - "9253:9253"
    environment:
      PHP_FPM_SCRAPE_URI: "unix:///run/php/php7.2-fpm.sock"
      PHP_FPM_LOG_LEVEL: "debug"
    volumes:
      - /run/php/php7.2-fpm.sock:/run/php/php7.2-fpm.sock

got
image

cant find any socket with network mode host

version: "3"
services:
  exporter:
    image: hipages/php-fpm_exporter:0.5.3
    network_mode: "host"
    ports:
      - "9253:9253"
    environment:
      PHP_FPM_SCRAPE_URI: "unix:///run/php/php7.2-fpm.sock"
      PHP_FPM_LOG_LEVEL: "debug"

image

any ideas how could it be fixed?

json: cannot unmarshal number

time="2018-02-27T04:00:26Z" level=error msg="json: cannot unmarshal number 18446744073709550774 into Go struct field PoolProcess.request duration of type int64"

time="2018-02-27T04:00:26Z" level=error msg="Error scraping PHP-FPM: json: cannot unmarshal number 18446744073709550774 into Go struct field PoolProcess.request duration of type int64"

Error scraping PHP-FPM: unexpected EOF

I want to monitor my php-fpm but shows the following errors, really need your help.

PHP versions from 5.6 to 7 are all shown in this errors.
pm.status_path = /status

php-fpm_exporter get --phpfpm.scrape-uri tcp://127.0.0.1:9000/status --log.level debug
ERRO[0000] unexpected EOF
DEBU[0000] Updated 1 pool(s) in 1.242031ms
Address: tcp://127.0.0.1:9000/status
Pool:
Start time: Mon, 01 Jan 0001 00:00:00 +0000
Start since: 0
Accepted connections: 0
Listen Queue: 0
Max Listen Queue: 0
Listen Queue Length: 0
Idle Processes: 0
Active Processes: 0
Total Processes: 0
Max active processes: 0
Max children reached: 0
Slow requests: 0

php-fpm_exporter server --phpfpm.scrape-uri "tcp://127.0.0.1:9000/status" --log.level debug
INFO[0000] Starting server on :9253 with path /metrics
ERRO[0018] unexpected EOF
DEBU[0018] Updated 1 pool(s) in 838.074µs
ERRO[0018] Error scraping PHP-FPM: unexpected EOF
ERRO[0046] unexpected EOF

Using http protocol instead of tcp

First of all, thanks for your time and for developing this exporter for the open-source community.

I wish to use php-fpm_exporter alongside my application container by a docker-compose file. My PHP pool status is accessible by http://application/status page, but the exporter can not pull the metrics from this endpoint. The request to the mentioned endpoint will be proxied by Nginx to the fastcgi 127.0.0.1:9000.

location ~ ^/(status)$ {
            fastcgi_param SCRIPT_FILENAME $document_root$fastcgi_script_name;
            fastcgi_index index.php;
            include fastcgi_params;
            fastcgi_pass 127.0.0.1:9000;
    }

I guess there is something wrong with the protocol (that in my case is http) but your examples are all using tcp. When I try to see the exporter container logs, it shows the following error (I tried with the tcp protocol but didn't work either and the phpfpm_up was still 0) :

$ docker-compose logs php-fpm_exporter   

php-fpm_exporter_1  | time="2020-05-16T19:18:26Z" level=info msg="Starting server on :9253 with path /metrics"
php-fpm_exporter_1  | time="2020-05-16T19:18:31Z" level=error msg="dial http: unknown network http"
php-fpm_exporter_1  | time="2020-05-16T19:18:31Z" level=debug msg="Updated 1 pool(s) in 7.307171ms"
php-fpm_exporter_1  | time="2020-05-16T19:18:31Z" level=error msg="Error scraping PHP-FPM: dial http: unknown network http"

My docker-compose.yml file:

  application:
   image: my-application:latest
    ports:
      - 3000:80

  php-fpm_exporter:
    image: hipages/php-fpm_exporter
    depends_on:
      - application
    environment:
      - PHP_FPM_SCRAPE_URI=http://application:80/status
      - PHP_FPM_LOG_LEVEL=debug
    ports:
    - 9253:9253

phpfpm_process_request_duration value too high

My expr for my alarm looks like this:

round(avg by (service,namespace,pool) (phpfpm_process_request_duration))     > 10000

I have three php fpm application, the first one is serving live traffic the other two applications are not live yet. It looks like the phpfpm_process_request_duration value works just fine for the firstapplication (real user traffic is handled here). The other applications just run idle but their phpfpm_process_request_duration value is rising steadily. But in reality their response time is also quite fast. Do I interpret the metric wrong?

Can not Connect latest version using socket

Getting this issue while connect using socket

root@php:/opt/phpexporter1.0.0# ./php-fpm_exporter server --phpfpm.scrape-uri unix:///var/run/php5-fpm.sock;/status

INFO[0000] Starting server on :9253 with path /metrics
ERRO[0012] Pool[unix:///var/run/php5-fpm.sock]: Access denied.
ERRO[0012] invalid character 'A' looking for beginning of value
ERRO[0012] Error scraping PHP-FPM: invalid character 'A' looking for beginning of value```

Error while connecting using linux socket

Hi, I'm trying to colect php-fpm metrics using this command: php-fpm_exporter get --phpfpm.scrape-uri unix:/var/run/php/php7.2-fpm.sock;/status

Unfortunately, I get the following error:
ERRO[0000] malformed MIME header line: Access to the script '' has been denied (see security.limit_extensions)
Is there any way to use this software without removing the security.limit_extensions option on the php-fpm configuration, since it may be very dangerous?

Unknown states and Inconsistent processes error message

time="2018-02-27T03:54:25Z" level=error msg="Inconsistent active and idle processes reported. Set `--fix-process-count` to have this calculated by php-fpm_exporter instead."
time="2018-02-27T03:55:24Z" level=error msg="Inconsistent active and idle processes reported. Set `--fix-process-count` to have this calculated by php-fpm_exporter instead."
time="2018-02-27T03:56:25Z" level=error msg="Unknown process state 'Finishing'"
time="2018-02-27T03:56:25Z" level=error msg="Unknown process state 'Reading headers'"

malformed MIME header line: Primary script unknown

I've wanted to add this exporter to have FPM metrics, however it would seem that either I have configured the fpm incorrectly, or the internal CGI client does not send some data.

When trying to scrape the metrics I get:

php-fpm-exporter_1  | time="2018-03-16T13:08:04Z" level=error msg="malformed MIME header line: Primary script unknown"
php-fpm-exporter_1  | time="2018-03-16T13:08:04Z" level=debug msg="Updated 1 pool(s) in 2.017823ms"
php-fpm-exporter_1  | time="2018-03-16T13:08:04Z" level=error msg="Error scraping PHP-FPM: malformed MIME header line: Primary script unknown"

My files:
api.conf (pool file)

[api]
user = www-data
group = www-data

listen = 127.0.0.1:9000

pm = dynamic
pm.max_children = 20
pm.start_servers = 4
pm.min_spare_servers = 2
pm.max_spare_servers = 6

pm.status_path = /fpm-status

access.log = /dev/null

docker.conf (another "pool" file)

[global]
daemonize = no
error_log = /proc/self/fd/2

[api]
; if we send this to /proc/self/fd/1, it never appears
; access.log = /proc/self/fd/2  ; stahp flooding log!

clear_env = no

; Ensure worker stdout and stderr are sent to the main error log.
catch_workers_output = yes
listen = [::]:9000

php.fpm.conf:

[global]
include=etc/php-fpm.d/*.conf

When I use nginx, I can see the status page correctly:

location ~ ^/fpm-status$ {
    access_log off;
    allow 127.0.0.1;
    allow 10.0.0.0/8;
    allow 172.16.0.0/12;
    deny all;
    fastcgi_param SCRIPT_FILENAME $document_root$fastcgi_script_name;
    include fastcgi_params;
    fastcgi_pass php:9000;
  }

Unable to use configuration file

I spied in the help output of the program that it seems to support a configuration file. So I tried to set phpfpm.scrape-uri through this configuration file (both in the default location ~/.php-fpm_exporter.yaml and in a custom location via --config), however in the end I was unable to pass the configuration to the exporter that way, even though the file does seem to be found (output: “Using config file: /home/j5lx/.php-fpm_exporter.yaml”). I tried various syntaxes:

  • phpfpm:
      - scrape_uri: unix:///run/php-fpm/php-fpm.sock;/status
  • phpfpm.scrape_uri: unix:///run/php-fpm/php-fpm.sock;/status
  • PHP_FPM_SCRAPE_URI: unix:///run/php-fpm/php-fpm.sock;/status

…but to no avail. Supplying the uri via the PHP_FPM_SCRAPE_URI environment variable, however, did work. Is there some secret syntax that I just can’t figure out or is the configuration file perhaps not entirely wired up to the rest of the program?

I’m using version 1.1.1.

Kubernetes example and Grafana dashboard

First of all, thanks for the exporter 🎉
It works perfect in my setup!

As there is currently no documentation how to get started within k8s I have created a simple example.

I have also adjusted the Grafana dashboard a bit as some parts did not work (some queries used container_name instead of container).
I am not so sure if this is specific to my setup or something changed with Prometheus/Exporters/Grafana.

If this is just broken at the moment is there any way I can contribute to the dashboard?

RFE/Question: Using unique worker ID inplace of `pidhash` label

Hi, thank you for the project. We can see that in #8, we started using pid_hash derived from PID and start time of the process. This will lead to a prometheus metric explosion (as per the caution in https://prometheus.io/docs/practices/naming/#labels). Could we instead use something like a "worker id" as a label instead? That way, we only have a finite number of label values. Happy to contribute a PR as well.

Additional labels can be used to distinguish between multiple different instances of an application or across applications.

The automated release is failing 🚨

🚨 The automated release from the master branch failed. 🚨

I recommend you give this issue a high priority, so other packages depending on you could benefit from your bug fixes and new features.

You can find below the list of errors reported by semantic-release. Each one of them has to be resolved in order to automatically publish your package. I’m sure you can resolve this 💪.

Errors are usually caused by a misconfiguration or an authentication problem. With each error reported below you will find explanation and guidance to help you to resolve it.

Once all the errors are resolved, semantic-release will release your package the next time you push a commit to the master branch. You can also manually restart the failed CI job that runs semantic-release.

If you are not sure how to resolve this, here is some links that can help you:

If those don’t help, or if this issue is reporting something you think isn’t right, you can always ask the humans behind semantic-release.


The push permission to the Git repository is required.

semantic-release cannot push the version tag to the branch master on remote Git repository with URL https://github.com/hipages/php-fpm_exporter.

Please refer to the authentication configuration documentation to configure the Git credentials on your CI environment and make sure the repositoryUrl is configured with a valid Git URL.


Good luck with your project ✨

Your semantic-release bot 📦🚀

Dependabot can't resolve your Go dependency files

Dependabot can't resolve your Go dependency files.

As a result, Dependabot couldn't update your dependencies.

The error Dependabot encountered was:

go: gopkg.in/[email protected]: unrecognized import path "gopkg.in/ini.v1" (parse https://gopkg.in/ini.v1?go-get=1: no go-import meta tags ())

If you think the above is an error on Dependabot's side please don't hesitate to get in touch - we'll do whatever we can to fix it.

View the update logs.

json: cannot unmarshal number

I get constantly this message from exporter:

time="2018-06-07T13:10:12+02:00" level=error msg="json: cannot unmarshal number 18446744073709551507 into Go struct field PoolProcess.request duration of type int64"
time="2018-06-07T13:10:12+02:00" level=error msg="Error scraping PHP-FPM: json: cannot unmarshal number 18446744073709551507 into Go struct field PoolProcess.request duration of type int64"

I have tried upgrading php and php-fpm. It persist from 5.5 to 7.0 versions of PHP. I also tried setting request_terminate_timeout = 300 but that didn't help.

It's same problem as in issue: issue-10.

Example json which can't be processed:

        {
            "content length": 360,
            "last request cpu": 0.0,
            "last request memory": 0,
            "pid": 11444,
            "request duration": 18446744073709550700,
            "request method": "POST",
            "request uri": "/index.php",
            "requests": 452,
            "script": "/www/bar.foo.com/www/index.php",
            "start since": 220,
            "start time": 1528375280,
            "state": "Running",
            "user": "-"
        },

fcgi: invalid header version

When I call

php-fpm_exporter get --phpfpm.scrape-uri tcp://127.0.0.1:49112/status

I get this:

ERRO[0000] fcgi: invalid header version
Address:             	tcp://127.0.0.1:49112/status
Pool:
Start time:          	Mon, 01 Jan 0001 00:00:00 +0000
Start since:         	0
Accepted connections:	0
Listen Queue:        	0
Max Listen Queue:    	0
Listen Queue Length: 	0
Idle Processes:      	0
Active Processes:    	0
Total Processes:     	0
Max active processes:	0
Max children reached:	0
Slow requests:       	0

I have nginx reverse-proxying in front of php-fpm. Does php-fpm_exporter need to connect directly to php-fpm?

Recommend Projects

  • React photo React

    A declarative, efficient, and flexible JavaScript library for building user interfaces.

  • Vue.js photo Vue.js

    🖖 Vue.js is a progressive, incrementally-adoptable JavaScript framework for building UI on the web.

  • Typescript photo Typescript

    TypeScript is a superset of JavaScript that compiles to clean JavaScript output.

  • TensorFlow photo TensorFlow

    An Open Source Machine Learning Framework for Everyone

  • Django photo Django

    The Web framework for perfectionists with deadlines.

  • D3 photo D3

    Bring data to life with SVG, Canvas and HTML. 📊📈🎉

Recommend Topics

  • javascript

    JavaScript (JS) is a lightweight interpreted programming language with first-class functions.

  • web

    Some thing interesting about web. New door for the world.

  • server

    A server is a program made to process requests and deliver data to clients.

  • Machine learning

    Machine learning is a way of modeling and interpreting data that allows a piece of software to respond intelligently.

  • Game

    Some thing interesting about game, make everyone happy.

Recommend Org

  • Facebook photo Facebook

    We are working to build community through open source technology. NB: members must have two-factor auth.

  • Microsoft photo Microsoft

    Open source projects and samples from Microsoft.

  • Google photo Google

    Google ❤️ Open Source for everyone.

  • D3 photo D3

    Data-Driven Documents codes.