GithubHelp home page GithubHelp logo

ig248 / kerashistoryplot Goto Github PK

View Code? Open in Web Editor NEW
1.0 1.0 2.0 199 KB

Plots training losses and metrics in Jupyter while training your `keras` model.

License: MIT License

Makefile 0.67% Python 12.70% Jupyter Notebook 86.63%

kerashistoryplot's Introduction

PyPI version Build Status Coverage Status

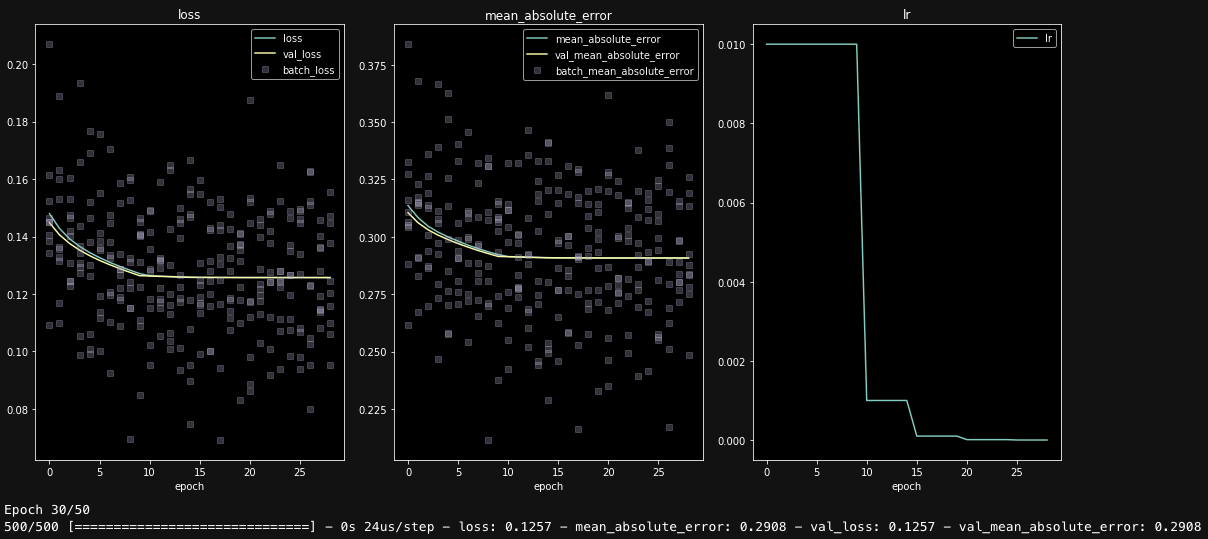
History plot for Keras model training

history plot with batches

Plots training losses and metrics in Jupyter while training your keras model.

This project started as an attempt to extend livelossplot, but I realized that a rewrite was easier. Key improvements are:

  • keeps full history, including losses for each batch in each epoch
  • plots scatter of batch losses
  • plots arbitrary log entries, such a lr (learning rate)
  • simplifies codebase extendibility

Basic Usage

Install package from source:

pip install git+https://github.com/ig248/kerashistoryplot

Or from PyPi:

pip install kerashistoryplot

Import function:

from livehistoryplot.callbacks import PlotHistory

Use in callbacks:

model.fit(
    X, y,
    epochs=20,
    callbacks=[
        ReduceLROnPlateau(),
        PlotHistory(batches=True, n_cols=3, figsize=(15, 7))
    ]
)

More Examples

See notebooks/

Tests

Run

make dev-install
make test

References

Original livelossplot: https://github.com/stared/livelossplot

kerashistoryplot's People

Contributors

ig248 avatar

Stargazers

 avatar

Watchers

 avatar

Forkers

zdenis208 ali-tny

kerashistoryplot's Issues

Recommend Projects

  • React photo React

    A declarative, efficient, and flexible JavaScript library for building user interfaces.

  • Vue.js photo Vue.js

    ๐Ÿ–– Vue.js is a progressive, incrementally-adoptable JavaScript framework for building UI on the web.

  • Typescript photo Typescript

    TypeScript is a superset of JavaScript that compiles to clean JavaScript output.

  • TensorFlow photo TensorFlow

    An Open Source Machine Learning Framework for Everyone

  • Django photo Django

    The Web framework for perfectionists with deadlines.

  • D3 photo D3

    Bring data to life with SVG, Canvas and HTML. ๐Ÿ“Š๐Ÿ“ˆ๐ŸŽ‰

Recommend Topics

  • javascript

    JavaScript (JS) is a lightweight interpreted programming language with first-class functions.

  • web

    Some thing interesting about web. New door for the world.

  • server

    A server is a program made to process requests and deliver data to clients.

  • Machine learning

    Machine learning is a way of modeling and interpreting data that allows a piece of software to respond intelligently.

  • Game

    Some thing interesting about game, make everyone happy.

Recommend Org

  • Facebook photo Facebook

    We are working to build community through open source technology. NB: members must have two-factor auth.

  • Microsoft photo Microsoft

    Open source projects and samples from Microsoft.

  • Google photo Google

    Google โค๏ธ Open Source for everyone.

  • D3 photo D3

    Data-Driven Documents codes.