- Based on forked version of https://github.com/blehman/maperator poc.
- Building blocks:
- Time-series plots with d3.
- Tweet map display with leaflet.
- Tweet timeline with Twitter widget.
- Driven by JSON dataset generated with EventBinner.
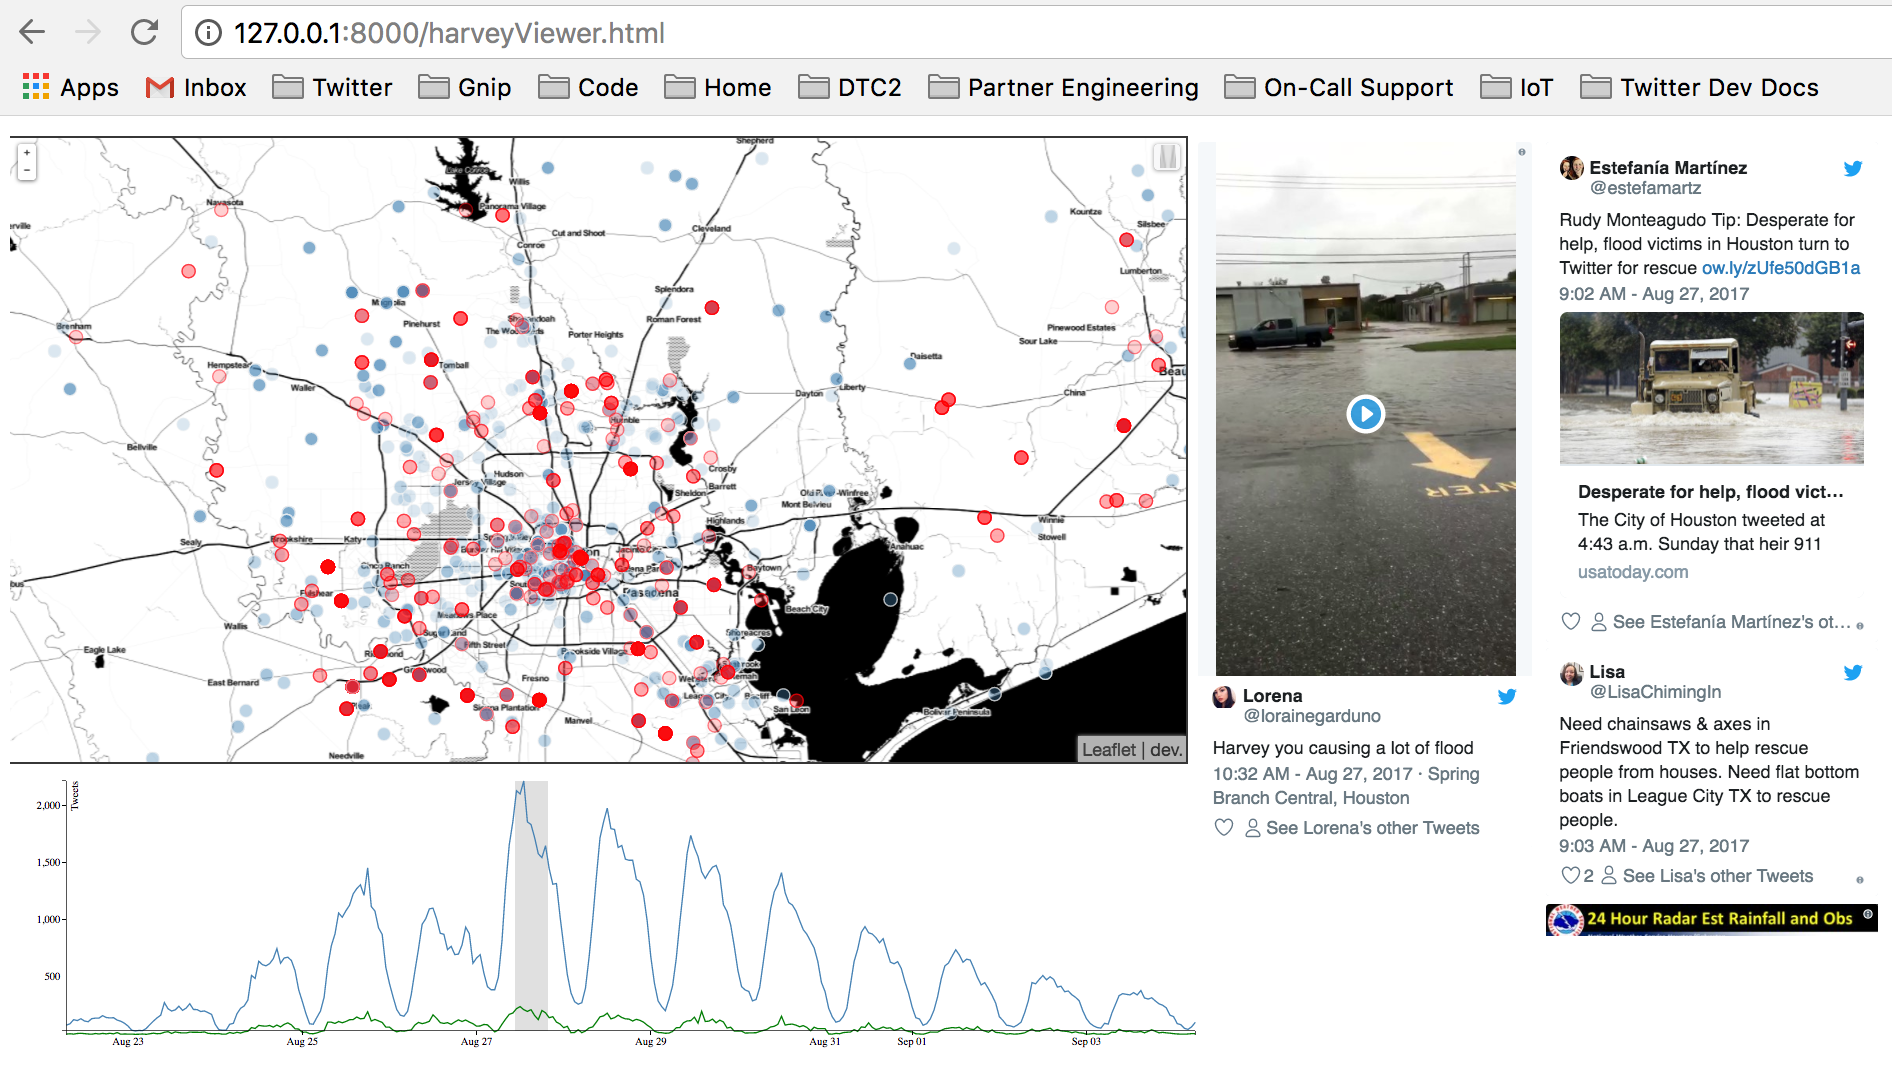
Browser-based explorer of Twitter events.
- d3 "brush" controls to tour the Event timeline.
- Map circle icons show geo-tagged Tweets (with Media)
- Red circles indicate Tweets within currently selected time period.
- Light blue cirlces indicate Tweets posted up until currently selected time period.
- Move "brush" to end of event to see Tweet "heat map" of entire event.
- Far right Tweet timeline shows first 10 "very important Tweets" (VITs) for selected time period.
- VITs are curated in database, then exported by EventBinner.
Run locally: python -m http.server