justglowing / minisom Goto Github PK
View Code? Open in Web Editor NEW:red_circle: MiniSom is a minimalistic implementation of the Self Organizing Maps
License: MIT License
:red_circle: MiniSom is a minimalistic implementation of the Self Organizing Maps
License: MIT License


Getting "nan" returned when I attempt to run som.quantization_error(data) returns "nan".
I thought the issue may have been related to numpy's linalg.norm function, but I have ensured the data being passed to minisom are a numpy float array:
| 0 | 1 | 2 | 3 | 4 | |
|---|---|---|---|---|---|
| 426.0 | -2403.0 | -63.0 | -177.0 | 14.036022 | 361.0 |
| 388.0 | -2458.0 | -8.0 | -50.0 | 14.478539 | 359.0 |
| 405.0 | -2432.0 | 31.0 | -19.0 | 13.921394 | 360.0 |
| 440.0 | -2348.0 | 87.0 | -95.0 | 14.062276 | 361.0 |
| 436.0 | -2259.0 | 219.0 | 9.0 | 13.603740 | 357.0 |
# set SOM parameters
som = MiniSom(x = x, y = y, input_len = input_length, sigma = sigma, learning_rate = learning_rate, random_seed = random_seed)
# train the SOM
start_time = time.time()
som.train_random(np_data, iterations)
elapsed_time = time.time() - start_time
print("Training time: {}".format(elapsed_time))
Based on my reading of the quantization_error function:
def quantization_error(self, data):
    `"""Returns the quantization error computed as the average

    distance between each input sample and its best matching unit."""

    self._check_input_len(data)

    error = 0

    for x in data:

        error += fast_norm(x-self._weights[self.winner(x)])

    return error/len(data) `
I've checked my data length (1,932,042), and weights:
[[[ 0.40056419 -0.70753778 0.19731155 0.36732157 -0.00220417
-0.40629643]
[-0.36671443 0.31642472 -0.4018778 -0.49997736 0.22512673
0.55066391]
[-0.74021007 0.01819334 0.46649405 0.16791178 0.33090403
-0.31056323]
...
Which are seem to be as expected.
The only thing I can think of is that my winning nodes are not correct.
Any help much appreciated.
I have a question about the interpretability of the quantization error.
How can we know that the SOM is reliable ? does the quantization error need to be lower than a certain value ?
For exemple, in my case, i have a quantization errror of 7.0 which is quite high in comparison to the exemple given in the documentation. Does that mean my som is not reliable ?
Please note $subject. Can u please briefly explain it
Is it possible to add progress support for train_batch(...) and train_random(...) methods? For instance using the tqdm library?
It seems there´s some formating error in verbose routine.
I happens sometimes:

Hi,
I'm using the interneuron distance matrix computed by the function distance_map, and saw in the comments of the function that the distance returned should be the normalized mean.
Yet, I don't see the computation of the mean of the distances. It seems that the code only sums up distances and then apply normalization. By doing so, the neurons located on the sides and having thus only 3 neighbors will have a lower distance (less additions and no averaging).
To illustrate this, I attach a MID matrix that shows smaller (darker) distances on the sides, and the corresponding neural network in 2D (dimensionality reduction provided by MDS from scikit-learn).


After averaging, I obtain the following MID matrix:

A common implementation of the algorithm is often using hexagonal grids instead of square or orthogonal providing interesting results. Is it possible to do something like this with minisom?
Line 51 of minisom.py:
self.weights = array([v/linalg.norm(v) for v in self.weights]) # normalizationEach v is a matrix representing a whole row in the SOM map. It has "SOM-width" rows, and "input_len" columns. And linalg.norm(v) calculates the Frobenius Norm of that matrix. I wonder what's the point of normalizing this whole matrix, instead of just normalizing each element vector in the SOM map.
Thanks !
Hi,
I just found there is a inconsistency statement for the verbose output of the train method.
Line 347 states that if verbose is true, the status of the training will be printed at each iteration. But in line 361, the status is only printed after all iterations. I guess the code between 361-363 should be indented.
Thanks
Hello.
I'm trying to use MiniSOM for my work, but I encountered some strangeness with learning curves.
Simple example: let's take learning curves example from your tutorials and run it with a different number of iterations: 10000, 20000 and 30000.
import numpy as np
from sklearn import preprocessing
import matplotlib.pyplot as plt
from matplotlib.gridspec import GridSpec
import os
import sys

data = np.genfromtxt('iris.csv', delimiter=',', usecols=(0, 1, 2, 3))
# data normalization
scaler = preprocessing.MinMaxScaler()
data = scaler.fit_transform(data)

max_iter = [10000,20000,30000]

for num_iter in max_iter:
    som = MiniSom(7, 7, 4, sigma=1., learning_rate=0.5,
                  neighborhood_function='gaussian', random_seed=10)
    som.pca_weights_init(data)

    q_error_pca_init = []
    iter_x = []
    for i in range(num_iter):
        percent = 100*(i+1)/num_iter
        rand_i = np.random.randint(len(data))
        som.update(data[rand_i], som.winner(data[rand_i]), i, num_iter)
        if (i+1) % 100 == 0:
            error = som.quantization_error(data)
            q_error_pca_init.append(error)
            iter_x.append(i)
            sys.stdout.write(f'\riteration={i:2d} status={percent:0.2f}% error={error}')

    lcurve=np.vstack((iter_x,q_error_pca_init)).T
    np.savetxt('test_10/lcurve'+str(num_iter)+'.txt',lcurve)
And now let's plot our learning curves in one plot:

And here we see this strange behavior: the more we have iterations, the slower is our convergence...
What am I doing wrong?
Hi,
There are a function to show the elements of each neuron (the words in the case of textmining ) rather than the marks ?
Thanks
Hi, thanks for the library! Is there a way of integrating this code with GridSearch to find the optimal parameters to minimize the quantization error?
I am using Self Organizing Map to predict anomalies. I am planning to ise miniSOM library for that. I am new to ML. I am having some doubts. I would be really grateful if you could help me to find the answers. My questions are:
Is that possible to define the cluster type while training the SOM?
Is it possible to calculate the accuracy of the trained miniSOM? Is there any inbuilt method for that?
Is miniSOM support k-fold cross validation?
Thanks in advance
Hi,
To get the DemocracyIndex example working I had to drop the last row from democracy_index (democracy_index = democracy_index[:-1]) which is a repeat of the header row in the Wikipedia table
Minisom also didn't like neighborhood_function which I replaced with decay_function (hope that's the same).
But now I get
File "C:mypath...\minisom2.py", line 221, in update
eta = self._decay_function(self._learning_rate, t, max_iteration)
TypeError: 'str' object is not callable
when executing som.train_random(X, 1000)
Any advice?
I'm hoping to apply minisom to a few very large datasets. These are on the order of 10e6 - 50e6 instances with 6 dimensions. The data are normalized, and are all floats.
The training time is no problem, typically <10min. However, I'm implementing a function to optimize sigma and the learning rate by minimizing the quantization error, but at present, the calculation time for the quantization error is so long (>24hrs) that an iterative approach is not feasible.
If there is anything I can do to improve the calculation time for the quantization error that would be great, otherwise I may have to use a different metric.
I should note that I am using map sizes of sqrt(5*sqrt(instances)) as recommended in: Rojas, Ignacio, Gonzalo Joya, and Andreu Catala, eds. Advances in Computational Intelligence: 13th International Work-Conference on Artificial Neural Networks, IWANN 2015, Palma de Mallorca, Spain, June 10-12, 2015. Proceedings. Vol. 9094. Springer, 2015.
So for a dataset with 7,069,696 instances the map is 115 x 115 (13225 nodes).
Hello, I just wanted to know what is the purpose of Class TestMiniSom in your code?
The documentation for pca_weights_init says that it initializes weights to span the first 2 principal components. Yet from the code it looks like it actually uses the last 2 principal components. Is this the intended behaviour? (I believe it is a mistake).
Specifically, here you use argsort, which will sort the eigenvalues from least to greatest. Then here you take the first and second values, which would be the least and second least principal components. At least in my experience, the first n principal components are the ones with the n greatest eigenvalues (not least), which is why I believe this is a mistake.
This would have escaped your unit tests here because you tested only in 2D.
If it is a mistake, it could be fixed by changing 0, 1 to [-1, -2] here. I can submit a PR if you would like.
Please note the $subject.
Lets say I have two columns in my training dataset like x and y. I want to train the SOM with that two values.So AFAIK, Weight vectors should be the same length as the input vectors (in my case its two), which are dynamically updated based on the values of the measurement vectors in the training data. So each neurone's weight should have two values( for an instance: neurone in 0,1 co-ordinate will have weights as [x,y]). So during the training period, each neurones in the som should be trained using those two vectors. So my question is, Is that possible to achieve this using miniSOM library?
My next question is, If I can do the training using above mentioned method, during the prediction period, if I want to get the winner coordinate for the input sample data using winner(x) method can I pass two values? because I want to predict the winner node using two values as I mentioned earlier x and y
Encountering a Key Error: 0 when trying to initialize weights.
Hopefully I'm just misunderstanding what kind of data can be passed to the random_weights_init.
Any help much appreciated.
Shape:
(21196800, 6)
Header:
3x3_high-pass 5x5_high-pass Scharr_X Scharr_Y Std_dev Original
0 426.0 -2403.0 -63.0 -177.0 14.036022 361.0
1 388.0 -2458.0 -8.0 -50.0 14.478539 359.0
2 405.0 -2432.0 31.0 -19.0 13.921394 360.0
3 440.0 -2348.0 87.0 -95.0 14.062276 361.0
4 436.0 -2259.0 219.0 9.0 13.603740 357.0
data = pd.read_csv("C:/Mars/output.txt", names = ["3x3_high-pass", "5x5_high-pass", "Scharr_X", "Scharr_Y", "Std dev", "Original"], index_col = False, low_memory = True, na_values = 0.0, na_filter = True)
som_grid_rows = 10
som_grid_columns = 10
iterations = 500
sigma = 1
learning_rate = 1
som = MiniSom(x = som_grid_rows, y = som_grid_columns, input_len = data.shape[1], sigma = sigma, learning_rate = learning_rate)
som.random_weights_init(data)
starting_weights = som.get_weights().copy()
start_time = time.time()
som.train(data, iterations)
elapsed_time = time.time() - start_time
print(elapsed_time)
KeyError Traceback (most recent call last)
C:\Program Files\ArcGIS\Pro\bin\Python\envs\arcgispro-py3\lib\site-packages\pandas\core\indexes\base.py in get_loc(self, key, method, tolerance)
2656 try:
-> 2657 return self._engine.get_loc(key)
2658 except KeyError:
pandas/_libs/index.pyx in pandas._libs.index.IndexEngine.get_loc()
pandas/_libs/index.pyx in pandas._libs.index.IndexEngine.get_loc()
pandas/_libs/hashtable_class_helper.pxi in pandas._libs.hashtable.PyObjectHashTable.get_item()
pandas/_libs/hashtable_class_helper.pxi in pandas._libs.hashtable.PyObjectHashTable.get_item()
KeyError: 0
During handling of the above exception, another exception occurred:
KeyError Traceback (most recent call last)
in
14
15 # initialize weights
---> 16 som.random_weights_init(data)
17
18 # save the starting weights
C:\Program Files\ArcGIS\Pro\bin\Python\envs\arcgispro-py3\lib\site-packages\minisom.py in random_weights_init(self, data)
270 """Initializes the weights of the SOM
271 picking random samples from data."""
--> 272 self._check_input_len(data)
273 it = nditer(self._activation_map, flags=['multi_index'])
274 while not it.finished:
C:\Program Files\ArcGIS\Pro\bin\Python\envs\arcgispro-py3\lib\site-packages\minisom.py in _check_input_len(self, data)
224 def _check_input_len(self, data):
225 """Checks that the data in input is of the correct shape."""
--> 226 data_len = len(data[0])
227 if self._input_len != data_len:
228 msg = 'Received %d features, expected %d.' % (data_len,
C:\Program Files\ArcGIS\Pro\bin\Python\envs\arcgispro-py3\lib\site-packages\pandas\core\frame.py in getitem(self, key)
2925 if self.columns.nlevels > 1:
2926 return self._getitem_multilevel(key)
-> 2927 indexer = self.columns.get_loc(key)
2928 if is_integer(indexer):
2929 indexer = [indexer]
C:\Program Files\ArcGIS\Pro\bin\Python\envs\arcgispro-py3\lib\site-packages\pandas\core\indexes\base.py in get_loc(self, key, method, tolerance)
2657 return self._engine.get_loc(key)
2658 except KeyError:
-> 2659 return self._engine.get_loc(self._maybe_cast_indexer(key))
2660 indexer = self.get_indexer([key], method=method, tolerance=tolerance)
2661 if indexer.ndim > 1 or indexer.size > 1:
pandas/_libs/index.pyx in pandas._libs.index.IndexEngine.get_loc()
pandas/_libs/index.pyx in pandas._libs.index.IndexEngine.get_loc()
pandas/_libs/hashtable_class_helper.pxi in pandas._libs.hashtable.PyObjectHashTable.get_item()
pandas/_libs/hashtable_class_helper.pxi in pandas._libs.hashtable.PyObjectHashTable.get_item()
KeyError: 0
I found the training result is different though using the same data set and same setting.
Is there a way to control the randomness (like random.seed(1)) to get the same result?
Thanks.
Hi,
Is there any way I can get the final weights between neurons in the input layer and neurons in the output layer?
I have a question regarding the bubble neighborhood function and how to interpret the value of sigma. Take the following SOM, for example:
som = MiniSom(x = 4, y = 3, input_len = 1000, sigma = 3, learning_rate = 0.05, neighborhood_function = "bubble")
This triggers a warning since sigma >= y, and minisom.py does note that sigma should be an odd integer for the bubble neighborhood function but I'm not entirely sure why. Is sigma for the bubble function just the radius from the winning node? E.g., if instead I set sigma = 1, would that mean just the immediately neighboring nodes of the winner are updated? After sigma decreases to less than 1, is only the winning node updated?
Thanks so much for any clarification you can provide!
Hi,
I guess there are some initialization errors in train_random() as the attached image.
Regards,
amjr

After training the SOM using minisom library, if this som model can predict a potential cluster from a new instance of data? Like for example, the trained SOM I have two clusters. Now am gonna do the prediction with new data instances. I need to output the cluster type of the new input data. Is there any inbuilt methods available in the minisom to predict/output the cluster type?
When running example_digits.py following warning is printed on console:
Warning (from warnings module):
  File "C:\Python34\lib\site-packages\matplotlib\axes\_subplots.py", line 69
    mplDeprecation)
MatplotlibDeprecationWarning: The use of 0 (which ends up being the _last_ sub-plot) is deprecated in 1.4 and will raise an error in 1.5
Can we assign our own weight to MiniSom? i want to use some Optimizing Algorithm to optimize the initial weight.
Hi,
Is there any way I can get the cluster number to which each datapoint in that dataset belongs to?
Possible to build plot like this ?
Can anyone please post an example in https://github.com/JustGlowing/minisom/tree/master/examples
Reference: https://www.r-bloggers.com/self-organising-maps-for-customer-segmentation-using-r/

Propose a Hamming distance technique to calculate binary values including example of application.
Once the SOM has been trained, is it possible to fit data to the SOM? I haven't found anything like this in the examples.
I am using MEG dataset with two labels 1 and 0. Is it possible to perform testing of trained dataset and calculate the classification accuracy score using miniSOM?
Hi, wonderful code, but I'm wondering why we have to normalize the weights all the time?
https://stackoverflow.com/questions/13687256/is-it-right-to-normalize-data-and-or-weight-vectors-in-a-som
I think it will be cool if we can decide whether to perform weights normalizing.
I'm trying to use a MiniSOM as a data pre-processing tool. I've scaled my data, 33 features and 40,516 records, and trained a 202-by-202 MiniSOM with it.
I'm trying to extract a numeric representation of each record's location on the map so I can append it to my data set and feed it to another model. Is there a command to printout each records's coordinates on the map?
Thank's in advance for your help, most of the examples I've found are focused on generating graphical output
I am trying to run statement: from minisom import MiniSom
But I get syntax error: progress = f'\r [ {0:{len(str(m))}} / {m} ] {0:3.0f}% - ? it/s' in minisom.py.
Is there any pre-requisite that I am missing.
Hi,
When I tried to import minisom, I got this syntax error:
from minisom import MiniSom
File "/Library/Frameworks/Python.framework/Versions/2.7/lib/python2.7/site-packages/minisom.py", line 23
progress = f'\r [ {0:{len(str(m))}} / {m} ] {0:3.0f}% ? it/s'
^
SyntaxError: invalid syntax
I installed minisom via 'pip install minisom' and I am using Python 2.7.12.
Any idea?
Thanks!
In function "quantization_error", it is computed as power((self.quantization(data) - data), 2).mean() making the mean between components instead of the average for all samples.
You can reproduce the issue using data as one-sample array.
Hi All,
I just installed minisom 2.1.6 from the PyPi repository into a fresh Anaconda Python 3.5.6 environment on a Kubuntu 19.04 box and run into the following issue:
(base) gykovacs@gykovacs-desktop:~$ conda activate p35
(p35) gykovacs@gykovacs-desktop:~$ python --version
Python 3.5.6 :: Anaconda, Inc.

(p35) gykovacs@gykovacs-desktop:~$ python
Python 3.5.6 |Anaconda, Inc.| (default, Aug 26 2018, 21:41:56)
[GCC 7.3.0] on linux
Type "help", "copyright", "credits" or "license" for more information.
>>> quit()

(p35) gykovacs@gykovacs-desktop:~$ pip install minisom
Collecting minisom
Installing collected packages: minisom
Successfully installed minisom-2.1.6
You are using pip version 10.0.1, however version 19.1.1 is available.
You should consider upgrading via the 'pip install --upgrade pip' command.

(p35) gykovacs@gykovacs-desktop:~$ python
Python 3.5.6 |Anaconda, Inc.| (default, Aug 26 2018, 21:41:56)
[GCC 7.3.0] on linux
Type "help", "copyright", "credits" or "license" for more information.
>>> import minisom
Traceback (most recent call last):
  File "<stdin>", line 1, in <module>
  File "/home/gykovacs/anaconda3/envs/p35/lib/python3.5/site-packages/minisom.py", line 23
    progress = f'\r [ {0:{len(str(m))}} / {m} ] {0:3.0f}% - ? it/s'
                                                                  ^
SyntaxError: invalid syntax
>>>
This example is great. Could you please also upload the same example under python 3?
Thanks
Hi,
I just found out about Minisom so my apologies if I am missing something obvious.
I have been trying to reproduce the following example:
http://www.pymvpa.org/examples/som.html
Here is my attempt using Minisom:
#Training inputs for RGBcolors
colors = np.array(
     [[0., 0., 0.],
      [0., 0., 1.],
      [0., 0., 0.5],
      [0.125, 0.529, 1.0],
      [0.33, 0.4, 0.67],
      [0.6, 0.5, 1.0],
      [0., 1., 0.],
      [1., 0., 0.],
      [0., 1., 1.],
      [1., 0., 1.],
      [1., 1., 0.],
      [1., 1., 1.],
      [.33, .33, .33],
      [.5, .5, .5],
      [.66, .66, .66]])
color_names = \
    ['black', 'blue', 'darkblue', 'skyblue',
     'greyblue', 'lilac', 'green', 'red',
     'cyan', 'violet', 'yellow', 'white',
     'darkgrey', 'mediumgrey', 'lightgrey']

from minisom import MiniSom
som = MiniSom(20, 30, 3, sigma=0.3, learning_rate=0.3)
som.train_random(colors, 4000, verbose=True)
I am trying to visualize things,
Not that the weights have a -1, 1 range. Is that normal?
import matplotlib.pyplot as plt

im = plt.imshow(abs(som.get_weights()), interpolation='none')
output image do not show any clustering, just look like noise.
What am I doing wrong?
Thanks!
Hi,
I am not able to serialise the trained som using python pickle module. I am trying to do the following:
som = MiniSom(4,4,40,sigma=.8,learning_rate=0.5)
som.train_random(Training_data,2000) # random training
output_som = open('som.pickle', 'wb')
pickle.dump(som, output_som, -1)
output_som.close()
I get the following error:
PicklingError: Can't pickle <type 'instancemethod'>: it's not found as builtin.instancemethod
Regards,
Vijay Raajaa G S
How can I generate the clustering results using minisom i.e. which data point belongs to which cluster? For eg: In the case of the Iris data set, I want to generate a file wherein each data point gets classified to a particular type (a cluster# in case of clustering).
How can I achieve this using minisom?
I would be highly grateful to you for your kind help. Thanks in advance.
i'm trying to use my own set of images for this example but it keeps giving me the following error when training:
non-broadcastable output operand with shape (64,) doesn't match the broadcast shape (1,64)
i have tried reshaping each image to a vector and appending it to the data array. i'm quite lost with this and haven't been able to find much of a solution for it.
Hi,
Looking at the code, it seems that there is no difference between the train_random and train_batch methods:
def train_random(self, data, num_iteration, verbose=False):
    self.train(data, num_iteration, random_order=False, verbose=verbose)

def train_batch(self, data, num_iteration, verbose=False):
    self.train(data, num_iteration, random_order=False, verbose=verbose)
I think train_random should call the train method with random_order=True, right?
Hi,
I want to see the change of the output while the SOM is learning. Is it possible to call fit again (to continue training) after it already fitted to some data? I've just tried with some data to do this but there's no significant change between the fits. What can be wrong?
Thanks.
Is there an example or guideline on how to achieve feture selection on high-dimensional data with minisom?
If I try to setup.py file, it gives me the following error
warnings.warn(msg)
usage: setup.py [global_opts] cmd1 [cmd1_opts] [cmd2 [cmd2_opts] ...]
or: setup.py --help [cmd1 cmd2 ...]
or: setup.py --help-commands
or: setup.py cmd --help
error: no commands supplied
Can you please guide me how to install your package?
Hi! Thank you very much for sharing this library.
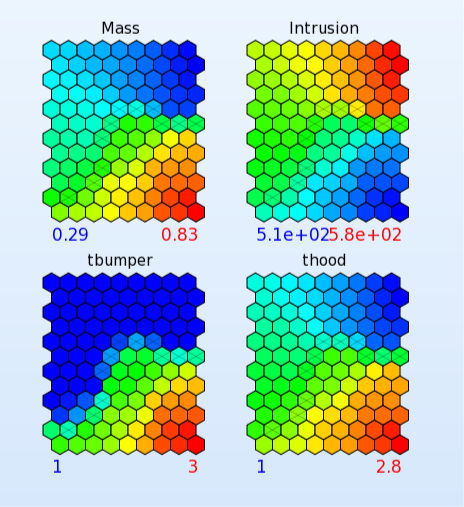
I would like to use SOM to identify correlations between variables. Let's say, I have an output Y and three variables X1, X2, X3. I train a SOM with features X1, X2, X3, Y and then I would like to plot over the SOM graph the quantities X1, X2, X3, Y (as an heatmap for example). In this way, I could graphically find if there are some relationship between my variables.
Like this example: https://www.lsoptsupport.com/examples/optimization/multiobjective/self-organizing-maps/multiobjective-34.png
How can I do that?
Because I found some problems:
Another question is: if I change the value of sigma I have completely different outputs. How can I choose the optimal sigma value? With which criterion should I choose it?
Thank you very much, I will give you a star in advance,
Regards,
Ario
I have a small question about the source code of minisom.py.
In line 270
norm = fast_norm(self._weights[it.multi_index])
The variable "norm" is never used in the function of "random_weights_init".
In line 271
self._weights[it.multi_index] = self._weights[it.multi_index]
The variables are the same on both sides of "=". What's the point of assigning a variable to the same variable.
A declarative, efficient, and flexible JavaScript library for building user interfaces.
🖖 Vue.js is a progressive, incrementally-adoptable JavaScript framework for building UI on the web.
TypeScript is a superset of JavaScript that compiles to clean JavaScript output.
An Open Source Machine Learning Framework for Everyone
The Web framework for perfectionists with deadlines.
A PHP framework for web artisans
Bring data to life with SVG, Canvas and HTML. 📊📈🎉
JavaScript (JS) is a lightweight interpreted programming language with first-class functions.
Some thing interesting about web. New door for the world.
A server is a program made to process requests and deliver data to clients.
Machine learning is a way of modeling and interpreting data that allows a piece of software to respond intelligently.
Some thing interesting about visualization, use data art
Some thing interesting about game, make everyone happy.
We are working to build community through open source technology. NB: members must have two-factor auth.
Open source projects and samples from Microsoft.
Google ❤️ Open Source for everyone.
Alibaba Open Source for everyone
Data-Driven Documents codes.
China tencent open source team.