Comments (17)
 kvos
commented on June 12, 2024
kvos
commented on June 12, 2024
hi @AISWARYA7866 , what is the size of your polygon? it seems to be really massive, spanning 4-5 degrees in latitude. As mentioned on the README your polygon should be smaller than 100 square km, if larger split it into smaller ones.
PS you can also run your script directly in Spyder
from coastsat.
 AISWARYA7866
commented on June 12, 2024
AISWARYA7866
commented on June 12, 2024
Hai Killan, when i reduced the size of the polygon i got the images. But
it takes long time to map the shorelines .Only 33 percentage of the
mapping process is completed yet now ( it takes more than 3 hrs to complete
33 percentage of the mapping process).Actually how long it takes to map
the shoreline?These are the coordinates which i used ..
[[[75.51194444, 11.66416667],
[75.58527778, 11.66555556],
[75.62166667, 11.58666667],
[75.55083333, 11.57388889],
[75.51194444, 11.66416667]]]
location :chombola beach ,kozhikode
dates = ['2017-12-01', '2018-01-01']
please check the same and mention if there is any error.
…On Wed, Dec 18, 2019 at 2:28 PM Kilian Vos ***@***.***> wrote:
hi @AISWARYA7866 <https://github.com/AISWARYA7866> , what is the size of
your polygon? it seems to be really massive, spanning 4-5 degrees in
latitude. As mentioned on the README your polygon should be smaller than
100 square km, if larger split it into smaller ones.
PS you can also run your script directly in Spyder
—
You are receiving this because you were mentioned.
Reply to this email directly, view it on GitHub
<#62?email_source=notifications&email_token=AOBS56ZZHXT5CRISZ2Q3RCLQZHQ2PA5CNFSM4J4FUYA2YY3PNVWWK3TUL52HS4DFVREXG43VMVBW63LNMVXHJKTDN5WW2ZLOORPWSZGOEHFM65A#issuecomment-566939508>,
or unsubscribe
<https://github.com/notifications/unsubscribe-auth/AOBS56YCV3R6H7RIMW7DNW3QZHQ2PANCNFSM4J4FUYAQ>
.
from coastsat.
kvos
commented on June 12, 2024
what is the area of your polygon? you're probably still downloading the images not mapping the shorelines, try to make it smaller to speed up things
from coastsat.
AISWARYA7866
commented on June 12, 2024
<img width="662" alt="new 1" src="https://user-images.githubusercontent.com/58928891/71336606-deeda280-256d-11ea-9fe2-f5065c23c42f.PNG">
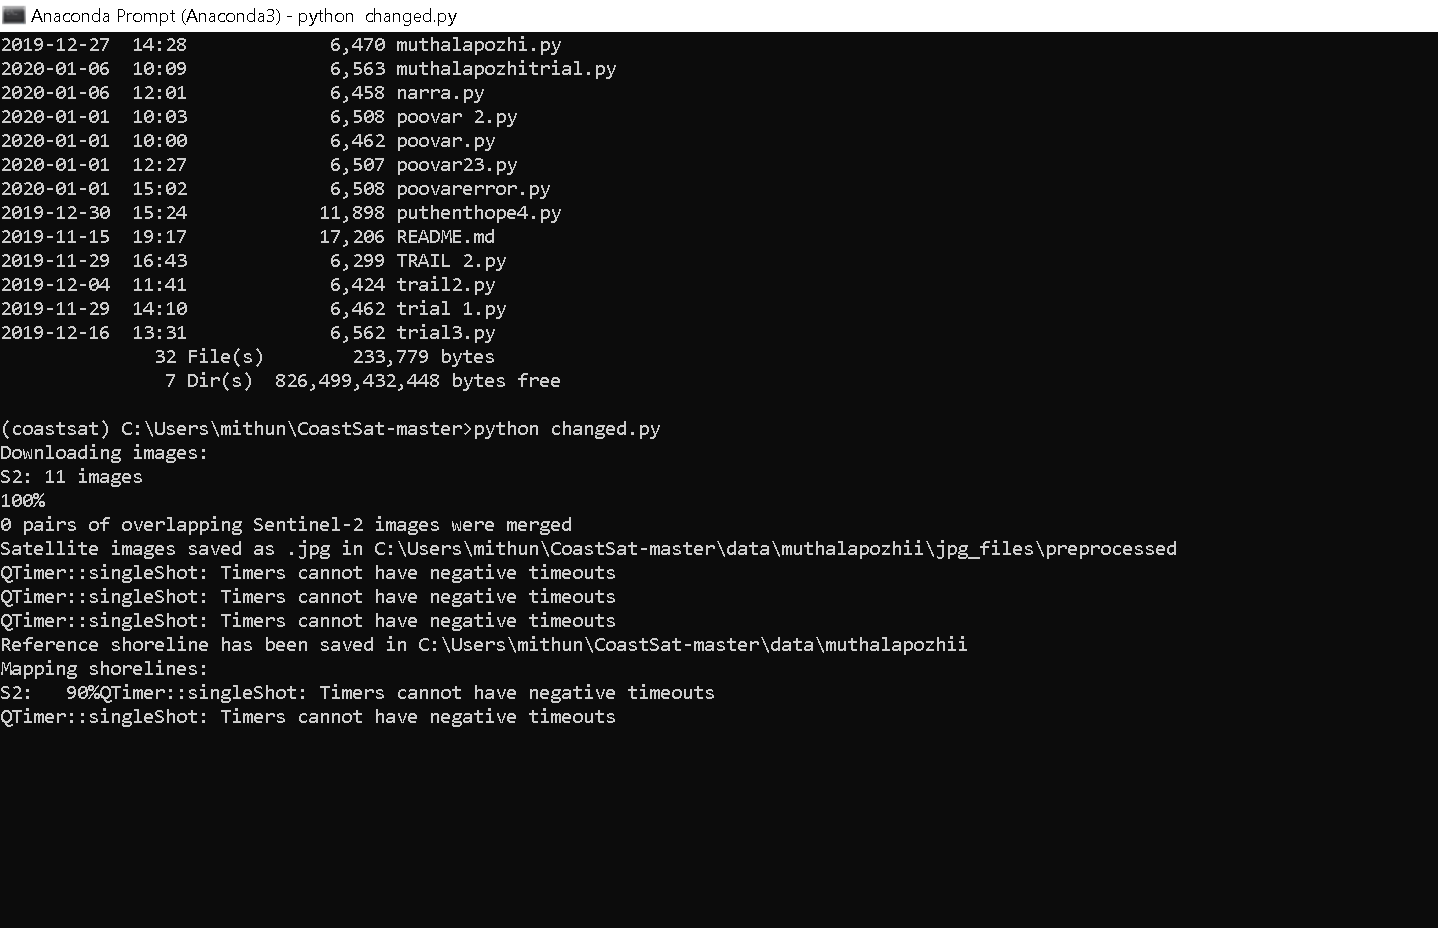
The area of the selected polygon is 80 square km (length 10km ,breadth
8km). We are trying process the sentinel images during 01st Dec 2017 to
01st January 2018 as a trail. there are 6 images and 6 images are already
downloaded.Please refer to the screen shot. The shoreline mapping procedure
is being done for 33% and stopped with error 'timers cannot have
negative timeouts'.
Please let me know how to solve this issue.
Thank you
--
Aishwarya
…
On Thu, Dec 19, 2019 at 10:12 PM Kilian Vos ***@***.***> wrote:
what is the area of your polygon? you're probably still downloading the
images not mapping the shorelines, try to make it smaller to speed up things
—
You are receiving this because you were mentioned.
Reply to this email directly, view it on GitHub
<#62?email_source=notifications&email_token=AOBS567W2YAJGOHXC3PIBY3QZOP53A5CNFSM4J4FUYA2YY3PNVWWK3TUL52HS4DFVREXG43VMVBW63LNMVXHJKTDN5WW2ZLOORPWSZGOEHKGHJA#issuecomment-567567268>,
or unsubscribe
<https://github.com/notifications/unsubscribe-auth/AOBS56ZKCDD2T74XKSB27CLQZOP53ANCNFSM4J4FUYAQ>
.
from coastsat.
AISWARYA7866
commented on June 12, 2024
Hai killan,
I have used the keyboard arrows instead of clicking on keep/skip, then also the shoreline mapping procedure is being done for 90% and stopped with error 'timers cannot have negative timeout'.Please let me know how to solve this issue.
from coastsat.
kvos
commented on June 12, 2024
yes it's normal to use the keyboard for keep/skip. I've never seen this error, can you share your changed.py script so I can try it out
from coastsat.
AISWARYA7866
commented on June 12, 2024
Hai killan,
This is my script


from coastsat.
kvos
commented on June 12, 2024
can you please copy/paste the code instead of screenshots, thx
from coastsat.
AISWARYA7866
commented on June 12, 2024
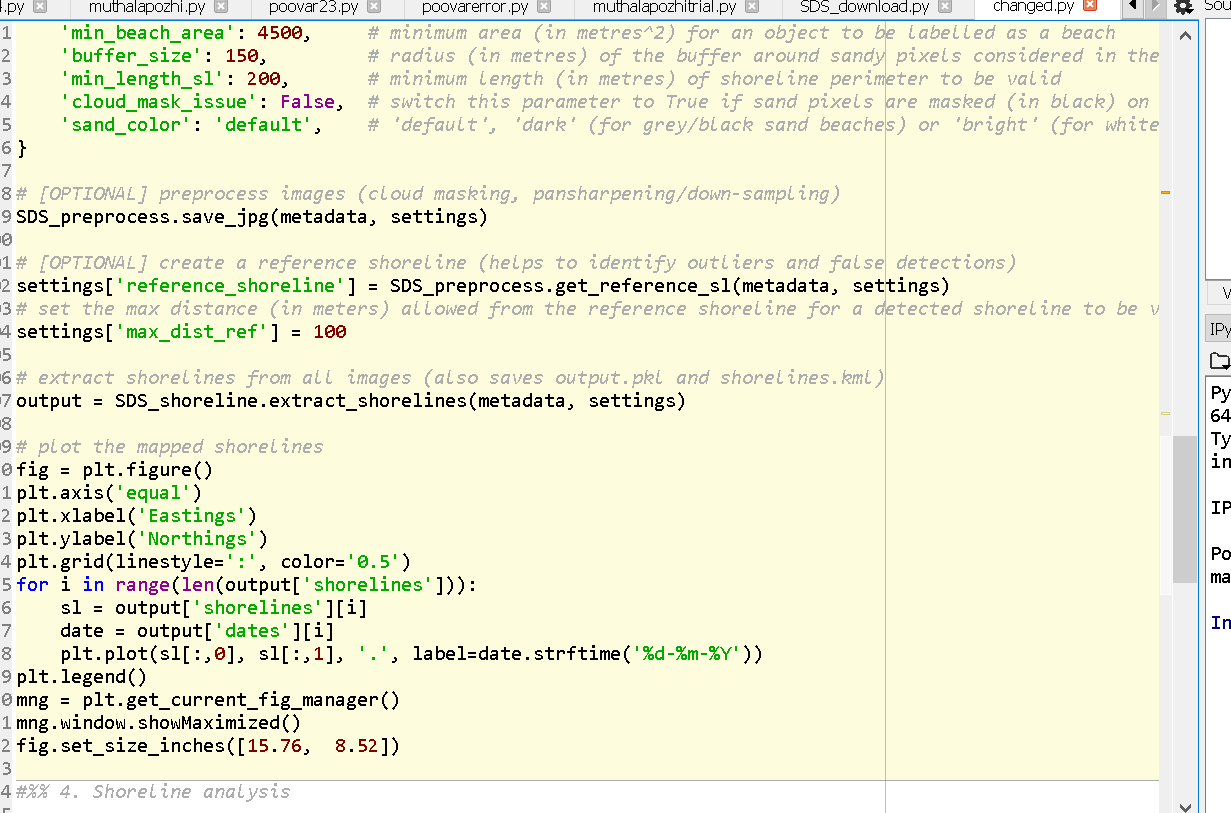
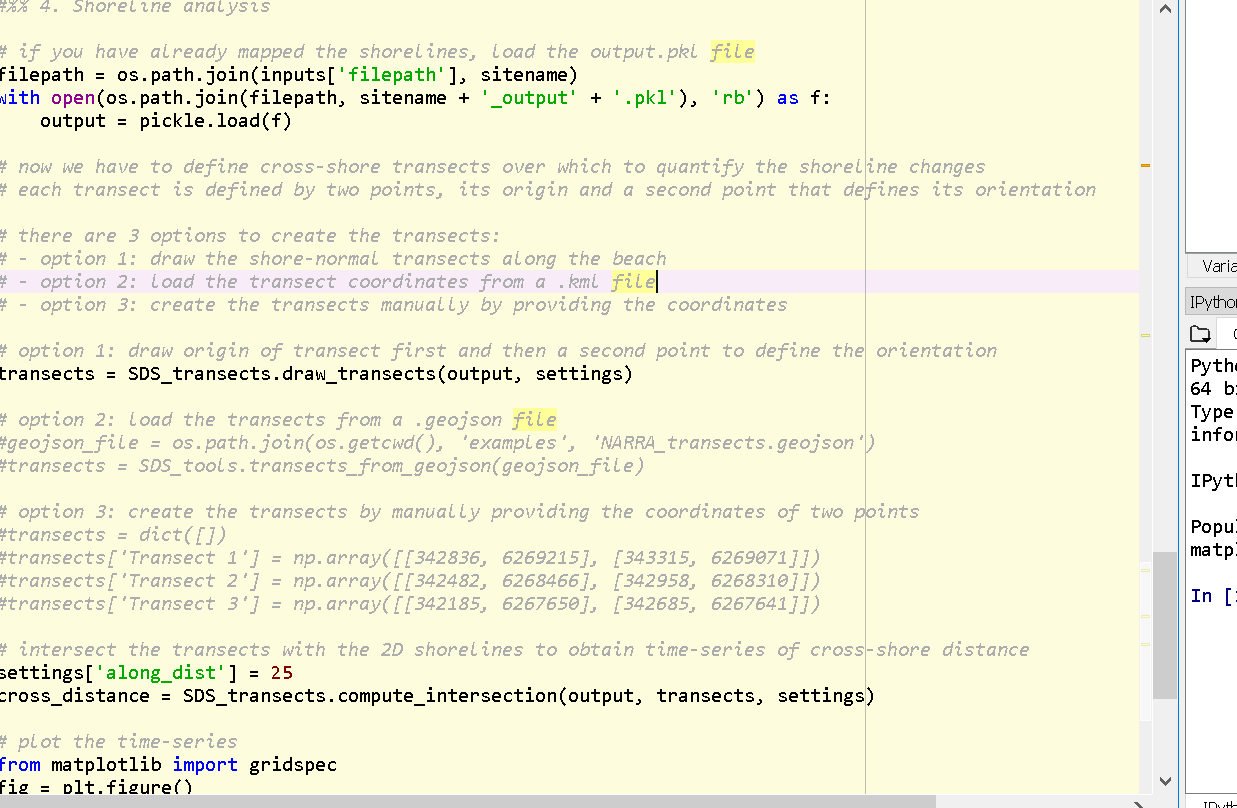
Hai kilian,
I have only changed the dates, polygon, sitename and epsg code.
import os#
import numpy as np
import pickle
import warnings
warnings.filterwarnings("ignore")
import matplotlib.pyplot as plt
from coastsat import SDS_download, SDS_preprocess, SDS_shoreline, SDS_tools, SDS_transects
polygon = [[[76.75805556, 8.63389167],
[76.79750000, 8.65536667],
[76.85166667, 8.58764167],
[76.81305556, 8.56238611],
[76.75805556, 8.63389167]]]
dates = ['2019-09-01', '2019-10-01']
sat_list = ['S2']
sitename = 'muthalapozhii'
filepath_data = os.path.join(os.getcwd(), 'data')
inputs = {
'polygon': polygon,
'dates': dates,
'sat_list': sat_list,
'sitename': sitename,
'filepath': filepath_data
}
metadata = SDS_download.retrieve_images(inputs)
metadata = SDS_download.get_metadata(inputs)
settings = {
# general parameters:
'cloud_thresh': 0.5, # threshold on maximum cloud cover
'output_epsg': 32643, # epsg code of spatial reference system desired for the output
# quality control:
'check_detection': True, # if True, shows each shoreline detection to the user for validation
'save_figure': True, # if True, saves a figure showing the mapped shoreline for each image
'inputs': inputs,

'min_beach_area': 4500,     # minimum area (in metres^2) for an object to be labelled as a beach
'buffer_size': 150,         # radius (in metres) of the buffer around sandy pixels considered in the shoreline detection
'min_length_sl': 200,       # minimum length (in metres) of shoreline perimeter to be valid
'cloud_mask_issue': False,  # switch this parameter to True if sand pixels are masked (in black) on many images
'sand_color': 'default',    # 'default', 'dark' (for grey/black sand beaches) or 'bright' (for white sand beaches)
}
SDS_preprocess.save_jpg(metadata, settings)
settings['reference_shoreline'] = SDS_preprocess.get_reference_sl(metadata, settings)
settings['max_dist_ref'] = 100
output = SDS_shoreline.extract_shorelines(metadata, settings)
fig = plt.figure()
plt.axis('equal')
plt.xlabel('Eastings')
plt.ylabel('Northings')
plt.grid(linestyle=':', color='0.5')
for i in range(len(output['shorelines'])):
sl = output['shorelines'][i]
date = output['dates'][i]
plt.plot(sl[:,0], sl[:,1], '.', label=date.strftime('%d-%m-%Y'))
plt.legend()
mng = plt.get_current_fig_manager()
mng.window.showMaximized()
fig.set_size_inches([15.76, 8.52])
filepath = os.path.join(inputs['filepath'], sitename)
with open(os.path.join(filepath, sitename + '_output' + '.pkl'), 'rb') as f:
output = pickle.load(f)
transects = SDS_transects.draw_transects(output, settings)
settings['along_dist'] = 25
cross_distance = SDS_transects.compute_intersection(output, transects, settings)
from matplotlib import gridspec
fig = plt.figure()
gs = gridspec.GridSpec(len(cross_distance),1)
gs.update(left=0.05, right=0.95, bottom=0.05, top=0.95, hspace=0.05)
for i,key in enumerate(cross_distance.keys()):
if np.all(np.isnan(cross_distance[key])):
continue
ax = fig.add_subplot(gs[i,0])
ax.grid(linestyle=':', color='0.5')
ax.set_ylim([-50,50])
ax.plot(output['dates'], cross_distance[key]- np.nanmedian(cross_distance[key]), '-^', markersize=6)
ax.set_ylabel('distance [m]', fontsize=12)
ax.text(0.5,0.95,'Transect ' + key, bbox=dict(boxstyle="square", ec='k',fc='w'), ha='center',
va='top', transform=ax.transAxes, fontsize=14)
mng = plt.get_current_fig_manager()
mng.window.showMaximized()
fig.set_size_inches([15.76, 8.52])
from coastsat.
kvos
commented on June 12, 2024
it worked for me...the QTimer warnings just because you are running it directly from the command line, if you run it in spyder it doesn't show up...
from the 11 images, only 1 had less than 50% cloud cover:

I actually realised that there is an issue with the merging of S2 overlapping images, I have fixed this problem in the /development branch, download that branch and try again, you should get more images. With the development branch I got 5 images merged:

from coastsat.
AISWARYA7866
commented on June 12, 2024
Hai kilian,
when i set the axis limit to [-80,80] , fig 2 is not responding why this happens.These are the coordinates which i used ..
polygon =[[[76.81305556, 8.56238611],
[76.85166667, 8.58764167],
[76.94277778, 8.48084167],
[76.86555556, 8.48718889],
[76.81305556, 8.56238611]]]
dates = ['2016-09-01', '2019-12-01']
sat_list = ['S2']
sitename = 'puthenthope'
output_epsg: 32643
from coastsat.
kvos
commented on June 12, 2024
can you please send the full script to I can try it out? or are you working on a fork of coastsat that I can access?
from coastsat.
AISWARYA7866
commented on June 12, 2024
import os#
import numpy as np
import pickle
import warnings
warnings.filterwarnings("ignore")
import matplotlib.pyplot as plt
from coastsat import SDS_download, SDS_preprocess, SDS_shoreline, SDS_tools, SDS_transects
polygon = [[[76.81305556, 8.56238611],
[76.85166667, 8.58764167],
[76.94277778, 8.48084167],
[76.86555556, 8.48718889],
[76.81305556, 8.56238611]]]
dates = ['2016-09-01', '2019-12-01']
sat_list = ['S2']
sitename = 'puthenthope'
filepath_data = os.path.join(os.getcwd(), 'data')
inputs = {
'polygon': polygon,
'dates': dates,
'sat_list': sat_list,
'sitename': sitename,
'filepath': filepath_data
}
metadata = SDS_download.retrieve_images(inputs)
metadata = SDS_download.get_metadata(inputs)
settings = {
cloud_thresh': 0.5,
'output_epsg': 32643,
'check_detection': True,
'save_figure': True,
'inputs': inputs
'min_beach_area': 4500,
'buffer_size': 150,
'min_length_sl': 200,
'cloud_mask_issue': False,
'sand_color': 'default',
}
SDS_preprocess.save_jpg(metadata, settings)
settings['reference_shoreline'] = SDS_preprocess.get_reference_sl(metadata, settings)
settings['max_dist_ref'] = 100
output = SDS_shoreline.extract_shorelines(metadata, settings)
fig = plt.figure()
plt.axis('equal')
plt.xlabel('Eastings')
plt.ylabel('Northings')
plt.grid(linestyle=':', color='0.5')
for i in range(len(output['shorelines'])):
sl = output['shorelines'][i]
date = output['dates'][i]
plt.plot(sl[:,0], sl[:,1], '.', label=date.strftime('%d-%m-%Y'))
plt.legend()
mng = plt.get_current_fig_manager()
mng.window.showMaximized()
fig.set_size_inches([15.76, 8.52])
filepath = os.path.join(inputs['filepath'], sitename)
with open(os.path.join(filepath, sitename + '_output' + '.pkl'), 'rb') as f:
output = pickle.load(f)
transects = SDS_transects.draw_transects(output, settings)
settings['along_dist'] = 25
cross_distance = SDS_transects.compute_intersection(output, transects, settings)
from matplotlib import gridspec
fig = plt.figure()
gs = gridspec.GridSpec(len(cross_distance),1)
gs.update(left=0.05, right=0.95, bottom=0.05, top=0.95, hspace=0.05)
for i,key in enumerate(cross_distance.keys()):
if np.all(np.isnan(cross_distance[key])):
continue
ax = fig.add_subplot(gs[i,0])
ax.grid(linestyle=':', color='0.5')
ax.set_ylim([-80,80])
ax.plot(output['dates'], cross_distance[key]- np.nanmedian(cross_distance[key]), '-^', markersize=6)
ax.set_ylabel('distance [m]', fontsize=12)
ax.text(0.5,0.95,'Transect ' + key, bbox=dict(boxstyle="square", ec='k',fc='w'), ha='center',
va='top', transform=ax.transAxes, fontsize=14)
mng = plt.get_current_fig_manager()
mng.window.showMaximized()
fig.set_size_inches([15.76, 8.52])
sat_list = ['S2']
sitename = 'puthenthope'
filepath_data = os.path.join(os.getcwd(), 'data')
inputs = {
'polygon': polygon,
'dates': dates,
'sat_list': sat_list,
'sitename': sitename,
'filepath': filepath_data
}
metadata = SDS_download.retrieve_images(inputs)
metadata = SDS_download.get_metadata(inputs)
settings = {
'cloud_thresh': 0.5,
'output_epsg': 32643,
'check_detection': True,
'save_figure': True,
'inputs': inputs,
'min_beach_area': 4500,
'buffer_size': 150,
'min_length_sl': 200,
'cloud_mask_issue': False,
'sand_color': 'default',
SDS_preprocess.save_jpg(metadata, settings)
settings['reference_shoreline'] = SDS_preprocess.get_reference_sl(metadata, settings)
settings['max_dist_ref'] = 100
output = SDS_shoreline.extract_shorelines(metadata, settings)
fig = plt.figure()
plt.axis('equal')
plt.xlabel('Eastings')
plt.ylabel('Northings')
plt.grid(linestyle=':', color='0.5')
for i in range(len(output['shorelines'])):
sl = output['shorelines'][i]
date = output['dates'][i]
plt.plot(sl[:,0], sl[:,1], '.', label=date.strftime('%d-%m-%Y'))
plt.legend()
mng = plt.get_current_fig_manager()
mng.window.showMaximized()
fig.set_size_inches([15.76, 8.52])
filepath = os.path.join(inputs['filepath'], sitename)
with open(os.path.join(filepath, sitename + '_output' + '.pkl'), 'rb') as f:
output = pickle.load(f)
transects = SDS_transects.draw_transects(output, settings)
settings['along_dist'] = 25
cross_distance = SDS_transects.compute_intersection(output, transects, settings)
from matplotlib import gridspec
fig = plt.figure()
gs = gridspec.GridSpec(len(cross_distance),1)
gs.update(left=0.05, right=0.95, bottom=0.05, top=0.95, hspace=0.05)
for i,key in enumerate(cross_distance.keys()):
if np.all(np.isnan(cross_distance[key])):
continue
ax = fig.add_subplot(gs[i,0])
ax.grid(linestyle=':', color='0.5')
ax.set_ylim([-25,75])
ax.plot(output['dates'], cross_distance[key]- np.nanmedian(cross_distance[key]), '-^', markersize=6)
ax.set_ylabel('distance [m]', fontsize=12)
ax.text(0.5,0.95,'Transect ' + key, bbox=dict(boxstyle="square", ec='k',fc='w'), ha='center',
va='top', transform=ax.transAxes, fontsize=14)
mng = plt.get_current_fig_manager()
mng.window.showMaximized()
fig.set_size_inches([15.76, 8.52])
from coastsat.
kvos
commented on June 12, 2024
I tried your code and got this for the time-series (I didn't run the entire dataset, just a few images, and I didn't use a reference shoreline):

So maybe the issue is with your reference shoreline, make sure you zoom in when you digitise it (you can delete points by right-click) and set the max_dist_ref accordingly.
I also recommend you make your polygon smaller, it takes forever to process such large images
from coastsat.
AISWARYA7866
commented on June 12, 2024
Hai Kilian,
i got stuck with the problem in tidal correction so can you give me an explanation about how you applied the tidal correction, and also how you generated tidally corrected figure.Hope you will reply soon. thank you
Aiswarya
from coastsat.
kvos
commented on June 12, 2024
hi @AISWARYA7866 , tidal correction is explained in the publications, basically you have to do the following:
- compute the intersections with the shorelines along the transects
- get the tide level corresponding to each date in output['dates']
- get an estimate of the beach face slope at each transect
- compute: tide level/beach face slope
- add this to the time-series that you obtained in step 1
from coastsat.
AISWARYA7866
commented on June 12, 2024
Hai kilian
here i have selected 5 transect locations as shown below , but i got result only for 2 transects why this happen so can you explain?


from coastsat.
Related Issues (20)
- IndexError: list index out of range - when plotting seasonal averages and long term trends HOT 2
- Doesn't plot final seasonal and monthly trend figures HOT 1
- After opening the clash proxy software, some errors message appears HOT 1
- Tidal Correction data error:''value' must be an instance of str or bytes, not a float' HOT 7
- Quick question about water level correction HOT 1
- Problem with GEE HOT 2
- white water border in pixel classification HOT 11
- Axis limits cannot be NaN or Inf HOT 1
- CoastSAT seasonal and monthly average graphs HOT 8
- tidal correction plus setup and runup correction! HOT 2
- fail to digitize a reference shoreline HOT 2
- KeyError: 'dimensions' when retrieving S2 imagery HOT 12
- Spyder: QWidget: Must construct a Qapplication before a Qwidget. HOT 4
- Downloading question and reference shoreline question HOT 3
- Sentinel-2 images failed to download HOT 3
- CoastSat running on Colab: error with the pyfes package HOT 1
- L7 scanline error HOT 6
- Error about SDS_download.retrieve_images(inputs) HOT 1
- Coastsat to work for small atoll island of Tuvalu HOT 1
- Images not downloading HOT 5
Recommend Projects
-
 React
React
A declarative, efficient, and flexible JavaScript library for building user interfaces.
-
Vue.js
🖖 Vue.js is a progressive, incrementally-adoptable JavaScript framework for building UI on the web.
-
 Typescript
TypeScript is a superset of JavaScript that compiles to clean JavaScript output.
-
TensorFlow
An Open Source Machine Learning Framework for Everyone
-
Django
The Web framework for perfectionists with deadlines.
-
 Laravel
A PHP framework for web artisans
-
D3
Bring data to life with SVG, Canvas and HTML. 📊📈🎉
-
Recommend Topics
-
javascript
JavaScript (JS) is a lightweight interpreted programming language with first-class functions.
-
web
Some thing interesting about web. New door for the world.
-
server
A server is a program made to process requests and deliver data to clients.
-
Machine learning
Machine learning is a way of modeling and interpreting data that allows a piece of software to respond intelligently.
-
Visualization
Some thing interesting about visualization, use data art
-
Game
Some thing interesting about game, make everyone happy.
Recommend Org
-
Facebook
We are working to build community through open source technology. NB: members must have two-factor auth.
-
Microsoft
Open source projects and samples from Microsoft.
-
Google
Google ❤️ Open Source for everyone.
-
Alibaba
Alibaba Open Source for everyone
-
D3
Data-Driven Documents codes.
-
Tencent
China tencent open source team.
from coastsat.