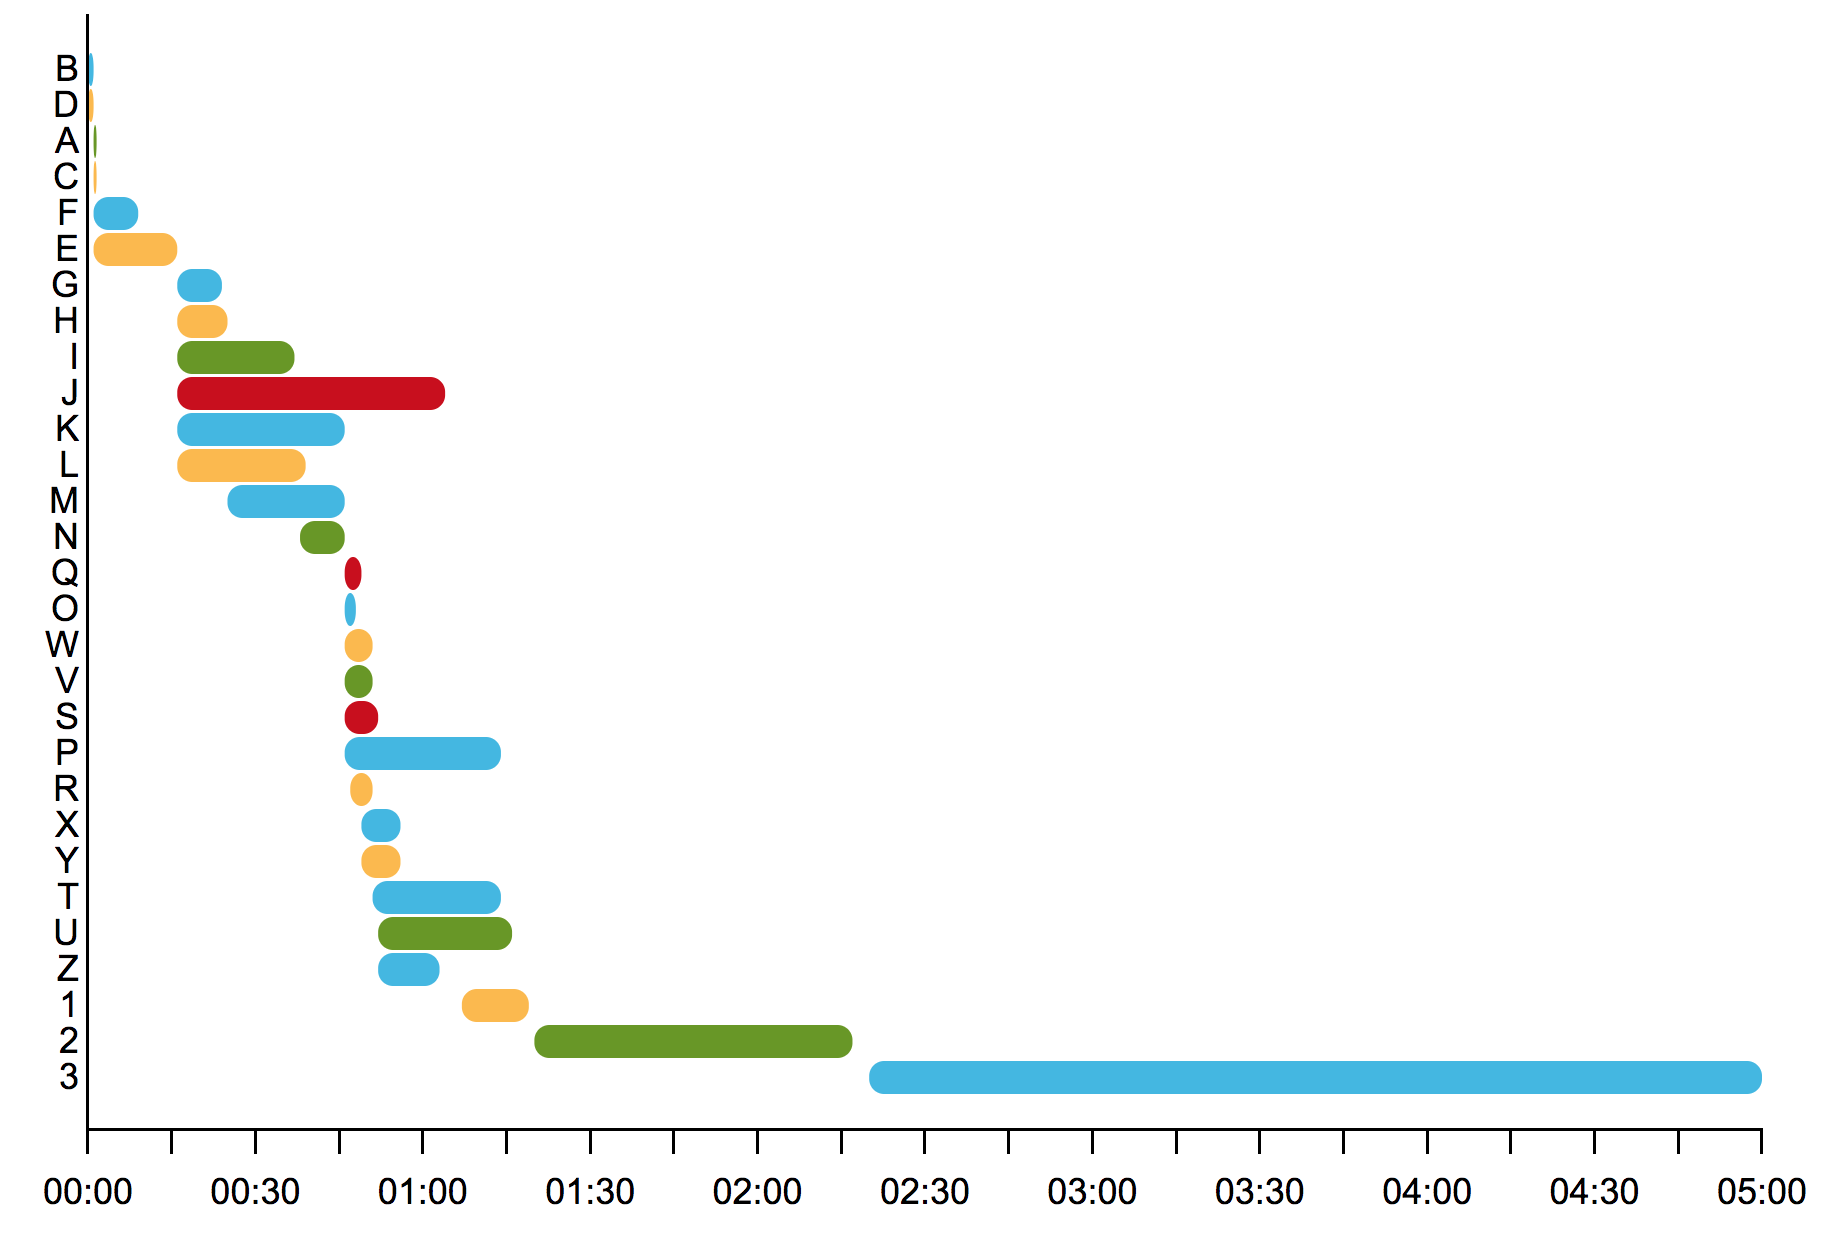
Xcode build times visualization per target
[sudo] gem install xcode-build-timesIn order to gather target build times, run the following command. This will add script build phases named "Timing START" and "Timing END" for EACH target in EACH project at specified path.
xcode-build-times install ~/Projects/<My_slowly_building_project>/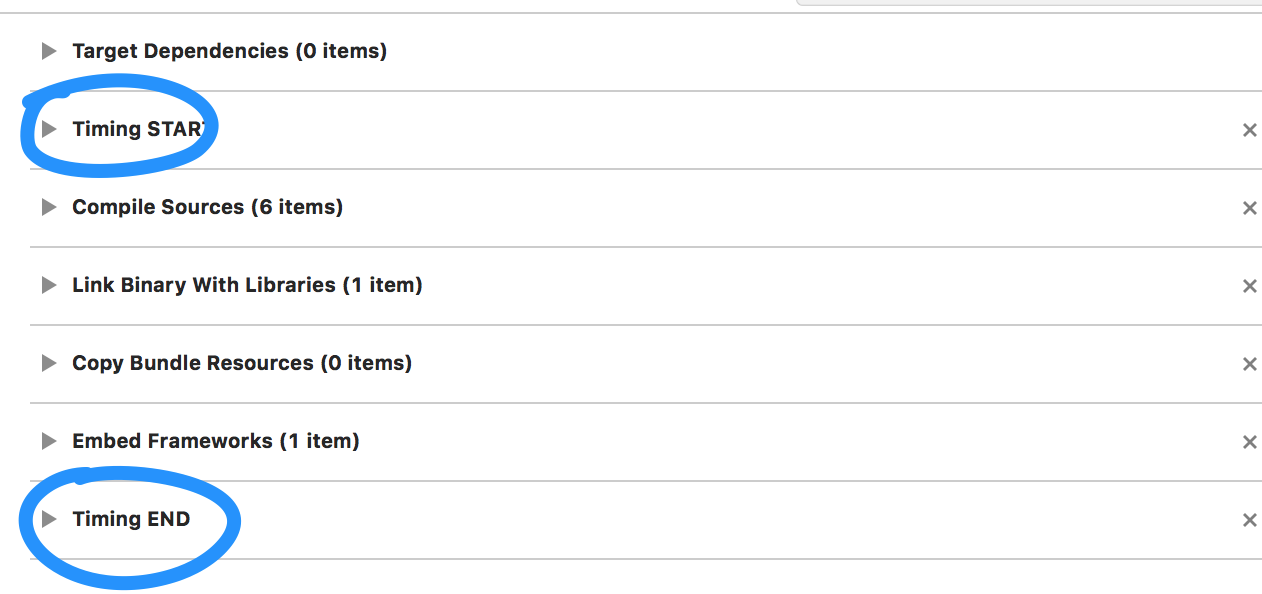
Once you've run the install command above, all build events will be saved to ~/.timings.xcode file every time you build your project.
NOTE: You can override this default setting by passing --events-file parameter on installation script
...
{"date":"2018-09-19T22:52:04.1537386724", "taskName":"A", "event":"start"},
{"date":"2018-09-19T22:53:01.1537386781", "taskName":"A", "event":"end"},
{"date":"2018-09-19T22:53:04.1537386784", "taskName":"B", "event":"start"},
{"date":"2018-09-19T22:55:53.1537386953", "taskName":"V", "event":"end"},
...Once desired build is done, it's time to dump raw events in place we need in order to render them. This can be done by running:
xcode-build-times generate [--events-file <path>]NOTE: You can use a different timings file by passing --events-file parameter
It's time to see results. Just open xcode-build-times-chart/gantt.html.
Once you are done benchmarking your project and want to remove the "Timing START' / "Timing END" build phases from your projects, just run:
xcode-build-times uninstall ~/Projects/<My_slowly_building_project>/(You can also delete your events file and the xcode-build-times-chart/ containing your reports)
d3js - JavaScript library for manipulating documents based on data
xcodeproj - Create and modify Xcode projects from Ruby.
d3js-gantt - Gantt chart for d3js by @dk8996
If something doesn't work - please fix it