Comments (12)
 rCarto
commented on May 28, 2024
rCarto
commented on May 28, 2024
Hello,
-
I think this blur is due to the re-projection of the map. Tiles are displayed in OSM and downloaded via
maptilesin EPSG:3857 projection.
Ifx(inget_tiles()) uses another coordinates reference system then a projection is applied to match the CRS ofxand the tiles are kind of resampled in the process.
The solution to obtain a non-blurred image is to use EPSG:3857 as input forget_tiles(). -
The export process can also alter the tiles quality. If you want to obtain exactly the same image you'll have to export the map using the tiles dimensions:
library(maptiles)
library(sf)
#> Linking to GEOS 3.7.1, GDAL 3.1.2, PROJ 7.1.0
zone_4326 <- st_as_sfc(st_bbox(c(xmin = 14.63128, xmax = 15.20052,
                                 ymin = 54.93529, ymax = 55.31899),
                               crs = 4326))
zone_3857 <- st_transform(zone_4326, 3857)
tiles_3857 <- get_tiles(x = zone_3857, zoom = 11)
dim(tiles_3857)
#> [1] 1280 1024    3
png("export.png", width = 1024, height = 1280)
plot_tiles(tiles_3857)
dev.off()
#> png
#>   2
Created on 2021-03-30 by the reprex package (v1.0.0)

from maptiles.
 oloverm
commented on May 28, 2024
oloverm
commented on May 28, 2024
Hmm yes yours is perfectly crisp. I wonder if it might be a computer/platform issue. Are you on a Mac, could that mean anything?
I ran basically the same code as you, but I still get a fuzzy image. I had to add par(mar = c(0,0,0,0)) because otherwise I got a big margin that I thought might be causing the pixel dimensions not to match up. But even without that margin, it's still not right.
library(maptiles)
library(sf)
zone_4326 <- st_as_sfc(st_bbox(c(xmin = 14.63128, xmax = 15.20052,
                                 ymin = 54.93529, ymax = 55.31899),
                               crs = 4326))
zone_3857 <- st_transform(zone_4326, 3857)
tiles_3857 <- get_tiles(x = zone_3857, zoom = 11)

tile_dim <- dim(tiles_3857)

png("export.png", width = tile_dim[2], height = tile_dim[1])
par(mar = c(0,0,0,0))  # to remove the thick white margin
plot_tiles(tiles_3857)
dev.off()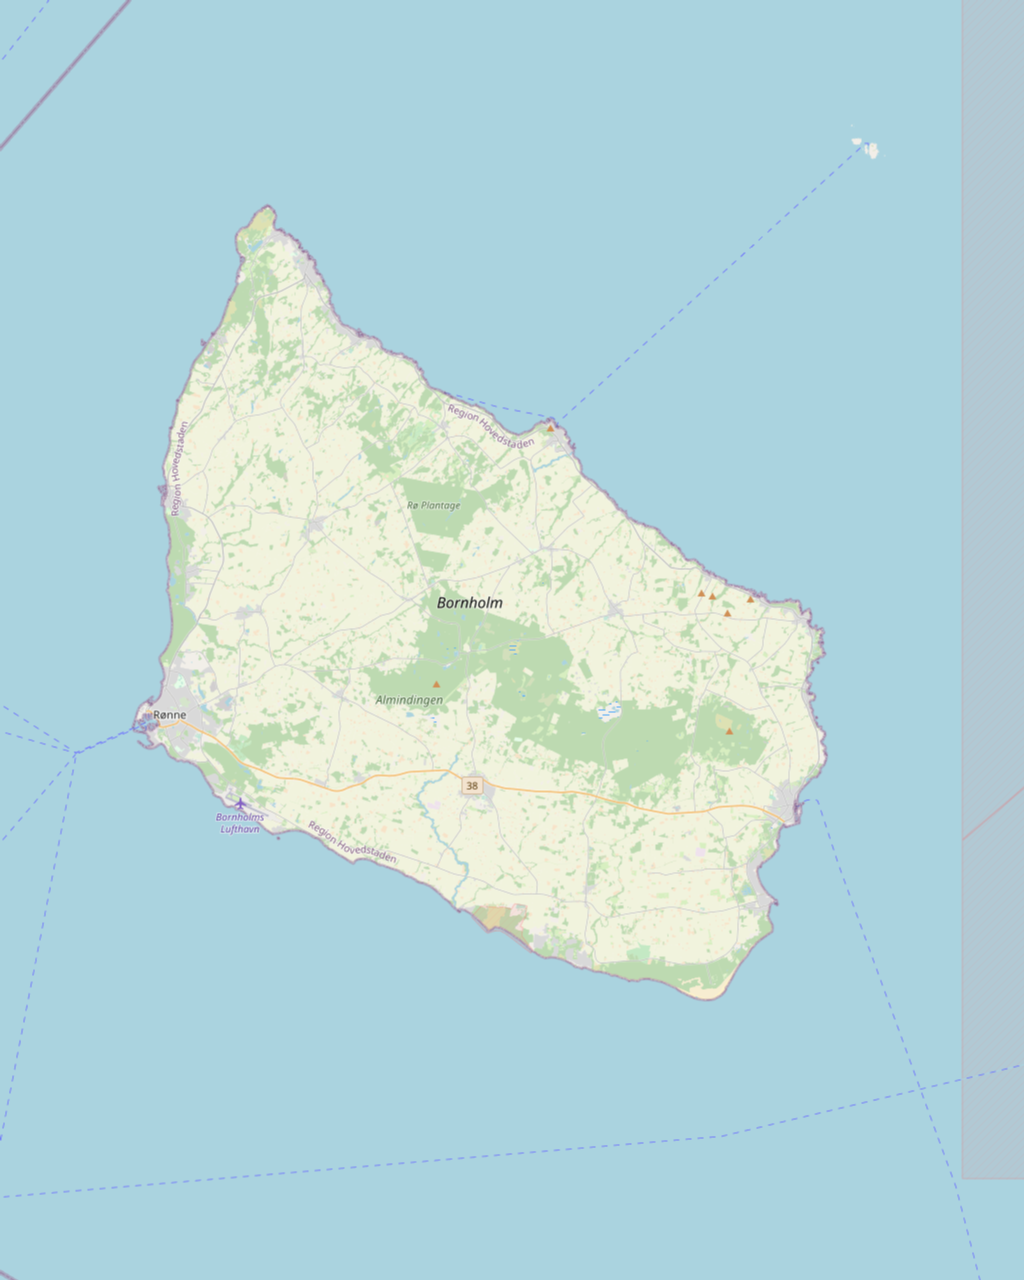
from maptiles.
rCarto
commented on May 28, 2024
I may be wrong but I don't think it's a platform problem.
Would you mind trying the dev version of the package (remotes::install_github("riatelab/maptiles")). I made small changes to plot_tiles(), setting margins is not needed anymore. My previous example used this version, it may explain the differences. I've also added my session info.
library(maptiles)
library(sf)
#> Linking to GEOS 3.7.1, GDAL 3.1.2, PROJ 7.1.0
zone_4326 <- st_as_sfc(st_bbox(c(xmin = 14.63128, xmax = 15.20052,
                                 ymin = 54.93529, ymax = 55.31899),
                               crs = 4326))
zone_3857 <- st_transform(zone_4326, 3857)
tiles_3857 <- get_tiles(x = zone_3857, zoom = 11)
tile_dim <- dim(tiles_3857)
png("export.png", width = tile_dim[2], height = tile_dim[1])
plot_tiles(tiles_3857)
dev.off()
#> png
#>   2
Created on 2021-03-31 by the reprex package (v1.0.0)
Session info
sessioninfo::session_info()
#> ─ Session info ───────────────────────────────────────────────────────────────
#>  setting  value
#>  version  R version 4.0.4 (2021-02-15)
#>  os       Debian GNU/Linux 10 (buster)
#>  system   x86_64, linux-gnu
#>  ui       X11
#>  language (EN)
#>  collate  fr_FR.UTF-8
#>  ctype    fr_FR.UTF-8
#>  tz       Europe/Paris
#>  date     2021-03-31
#>
#> ─ Packages ───────────────────────────────────────────────────────────────────
#>  package     * version    date       lib source
#>  assertthat    0.2.1      2019-03-21 [1] CRAN (R 4.0.0)
#>  backports     1.2.1      2020-12-09 [1] CRAN (R 4.0.3)
#>  class         7.3-18     2021-01-24 [4] CRAN (R 4.0.4)
#>  classInt      0.4-3      2020-04-07 [1] CRAN (R 4.0.0)
#>  cli           2.3.1      2021-02-23 [1] CRAN (R 4.0.4)
#>  codetools     0.2-18     2020-11-04 [4] CRAN (R 4.0.4)
#>  crayon        1.4.1.9000 2021-03-18 [1] Github (r-lib/crayon@965d1dc)
#>  curl          4.3        2019-12-02 [1] CRAN (R 4.0.0)
#>  DBI           1.1.1      2021-01-15 [1] CRAN (R 4.0.3)
#>  debugme       1.1.0      2017-10-22 [1] CRAN (R 4.0.4)
#>  digest        0.6.27     2020-10-24 [1] CRAN (R 4.0.3)
#>  dplyr         1.0.5      2021-03-05 [1] CRAN (R 4.0.4)
#>  e1071         1.7-6      2021-03-18 [1] CRAN (R 4.0.4)
#>  ellipsis      0.3.1      2020-05-15 [1] CRAN (R 4.0.0)
#>  evaluate      0.14       2019-05-28 [1] CRAN (R 4.0.0)
#>  fansi         0.4.2      2021-01-15 [1] CRAN (R 4.0.3)
#>  fs            1.5.0      2020-07-31 [1] CRAN (R 4.0.2)
#>  generics      0.1.0      2020-10-31 [1] CRAN (R 4.0.3)
#>  glue          1.4.2      2020-08-27 [1] CRAN (R 4.0.2)
#>  highr         0.8        2019-03-20 [1] CRAN (R 4.0.0)
#>  htmltools     0.5.1.1    2021-01-22 [1] CRAN (R 4.0.3)
#>  KernSmooth    2.23-18    2020-10-29 [4] CRAN (R 4.0.4)
#>  knitr         1.31       2021-01-27 [1] CRAN (R 4.0.3)
#>  lattice       0.20-41    2020-04-02 [4] CRAN (R 4.0.4)
#>  lifecycle     1.0.0      2021-02-15 [1] CRAN (R 4.0.4)
#>  magrittr      2.0.1      2020-11-17 [1] CRAN (R 4.0.3)
#>  maptiles    * 0.1.2.0    2021-03-31 [1] local
#>  pillar        1.5.1      2021-03-05 [1] CRAN (R 4.0.4)
#>  pkgconfig     2.0.3      2019-09-22 [1] CRAN (R 4.0.0)
#>  png           0.1-7      2013-12-03 [1] CRAN (R 4.0.0)
#>  proxy         0.4-25     2021-03-05 [1] CRAN (R 4.0.4)
#>  purrr         0.3.4      2020-04-17 [1] CRAN (R 4.0.0)
#>  R6            2.5.0      2020-10-28 [1] CRAN (R 4.0.3)
#>  raster        3.4-5      2020-11-14 [1] CRAN (R 4.0.3)
#>  Rcpp          1.0.6      2021-01-15 [1] CRAN (R 4.0.3)
#>  reprex        1.0.0      2021-01-27 [1] CRAN (R 4.0.3)
#>  rlang         0.4.10     2020-12-30 [1] CRAN (R 4.0.3)
#>  rmarkdown     2.7        2021-02-19 [1] CRAN (R 4.0.4)
#>  sessioninfo   1.1.1      2018-11-05 [1] CRAN (R 4.0.0)
#>  sf          * 0.9-8      2021-03-17 [1] CRAN (R 4.0.4)
#>  slippymath    0.3.1      2019-06-28 [1] CRAN (R 4.0.0)
#>  sp            1.4-5      2021-01-10 [1] CRAN (R 4.0.3)
#>  stringi       1.5.3      2020-09-09 [1] CRAN (R 4.0.2)
#>  stringr       1.4.0      2019-02-10 [1] CRAN (R 4.0.0)
#>  styler        1.4.1      2021-03-30 [1] CRAN (R 4.0.4)
#>  terra         1.1-4      2021-03-09 [1] CRAN (R 4.0.4)
#>  tibble        3.1.0      2021-02-25 [1] CRAN (R 4.0.4)
#>  tidyselect    1.1.0      2020-05-11 [1] CRAN (R 4.0.0)
#>  units         0.7-1      2021-03-16 [1] CRAN (R 4.0.4)
#>  utf8          1.2.1      2021-03-12 [1] CRAN (R 4.0.4)
#>  vctrs         0.3.7      2021-03-29 [1] CRAN (R 4.0.4)
#>  withr         2.4.1      2021-01-26 [1] CRAN (R 4.0.3)
#>  xfun          0.22       2021-03-11 [1] CRAN (R 4.0.4)
#>  yaml          2.2.1      2020-02-01 [1] CRAN (R 4.0.0)
#>
#> [1] /home/tim/R/x86_64-pc-linux-gnu-library/4.0
#> [2] /usr/local/lib/R/site-library
#> [3] /usr/lib/R/site-library
#> [4] /usr/lib/R/library
from maptiles.
oloverm
commented on May 28, 2024
No luck on the dev version either, unfortunately:
library(maptiles)
library(sf)
#> Linking to GEOS 3.9.0, GDAL 3.2.1, PROJ 7.2.1
zone_4326 <- st_as_sfc(st_bbox(c(xmin = 14.63128, xmax = 15.20052,
                                 ymin = 54.93529, ymax = 55.31899),
                               crs = 4326))
zone_3857 <- st_transform(zone_4326, 3857)
tiles_3857 <- get_tiles(x = zone_3857, zoom = 11)
tile_dim <- dim(tiles_3857)
png("export.png", width = tile_dim[2], height = tile_dim[1])
plot_tiles(tiles_3857)
dev.off()
#> png
#>   2
Created on 2021-03-31 by the reprex package (v1.0.0)
Session info
sessioninfo::session_info()
#> - Session info ---------------------------------------------------------------
#>  setting  value
#>  version  R version 4.0.4 (2021-02-15)
#>  os       Windows 10 x64
#>  system   x86_64, mingw32
#>  ui       RTerm
#>  language (EN)
#>  collate  English_United Kingdom.1252
#>  ctype    English_United Kingdom.1252
#>  tz       Europe/Paris
#>  date     2021-03-31
#>
#> - Packages -------------------------------------------------------------------
#>  package     * version date       lib source
#>  assertthat    0.2.1   2019-03-21 [1] CRAN (R 4.0.3)
#>  backports     1.2.1   2020-12-09 [1] CRAN (R 4.0.3)
#>  class         7.3-18  2021-01-24 [2] CRAN (R 4.0.4)
#>  classInt      0.4-3   2020-04-07 [1] CRAN (R 4.0.3)
#>  cli           2.3.1   2021-02-23 [1] CRAN (R 4.0.4)
#>  codetools     0.2-18  2020-11-04 [2] CRAN (R 4.0.4)
#>  crayon        1.4.1   2021-02-08 [1] CRAN (R 4.0.4)
#>  curl          4.3     2019-12-02 [1] CRAN (R 4.0.3)
#>  DBI           1.1.1   2021-01-15 [1] CRAN (R 4.0.4)
#>  digest        0.6.27  2020-10-24 [1] CRAN (R 4.0.4)
#>  dplyr         1.0.5   2021-03-05 [1] CRAN (R 4.0.4)
#>  e1071         1.7-6   2021-03-18 [1] CRAN (R 4.0.4)
#>  ellipsis      0.3.1   2020-05-15 [1] CRAN (R 4.0.3)
#>  evaluate      0.14    2019-05-28 [1] CRAN (R 4.0.3)
#>  fansi         0.4.2   2021-01-15 [1] CRAN (R 4.0.4)
#>  fs            1.5.0   2020-07-31 [1] CRAN (R 4.0.3)
#>  generics      0.1.0   2020-10-31 [1] CRAN (R 4.0.3)
#>  glue          1.4.2   2020-08-27 [1] CRAN (R 4.0.3)
#>  highr         0.8     2019-03-20 [1] CRAN (R 4.0.3)
#>  htmltools     0.5.1.1 2021-01-22 [1] CRAN (R 4.0.4)
#>  KernSmooth    2.23-18 2020-10-29 [2] CRAN (R 4.0.4)
#>  knitr         1.31    2021-01-27 [1] CRAN (R 4.0.4)
#>  lattice       0.20-41 2020-04-02 [2] CRAN (R 4.0.4)
#>  lifecycle     1.0.0   2021-02-15 [1] CRAN (R 4.0.4)
#>  magrittr      2.0.1   2020-11-17 [1] CRAN (R 4.0.3)
#>  maptiles    * 0.1.2.0 2021-03-31 [1] Github (riatelab/maptiles@f957e40)
#>  pillar        1.5.1   2021-03-05 [1] CRAN (R 4.0.4)
#>  pkgconfig     2.0.3   2019-09-22 [1] CRAN (R 4.0.3)
#>  png           0.1-7   2013-12-03 [1] CRAN (R 4.0.3)
#>  proxy         0.4-25  2021-03-05 [1] CRAN (R 4.0.4)
#>  purrr         0.3.4   2020-04-17 [1] CRAN (R 4.0.3)
#>  R6            2.5.0   2020-10-28 [1] CRAN (R 4.0.4)
#>  raster        3.4-5   2020-11-14 [1] CRAN (R 4.0.4)
#>  Rcpp          1.0.6   2021-01-15 [1] CRAN (R 4.0.4)
#>  reprex        1.0.0   2021-01-27 [1] CRAN (R 4.0.4)
#>  rlang         0.4.10  2020-12-30 [1] CRAN (R 4.0.4)
#>  rmarkdown     2.7     2021-02-19 [1] CRAN (R 4.0.4)
#>  sessioninfo   1.1.1   2018-11-05 [1] CRAN (R 4.0.3)
#>  sf          * 0.9-8   2021-03-17 [1] CRAN (R 4.0.4)
#>  slippymath    0.3.1   2019-06-28 [1] CRAN (R 4.0.4)
#>  sp            1.4-5   2021-01-10 [1] CRAN (R 4.0.4)
#>  stringi       1.5.3   2020-09-09 [1] CRAN (R 4.0.3)
#>  stringr       1.4.0   2019-02-10 [1] CRAN (R 4.0.3)
#>  styler        1.4.1   2021-03-30 [1] CRAN (R 4.0.4)
#>  terra         1.1-4   2021-03-09 [1] CRAN (R 4.0.4)
#>  tibble        3.1.0   2021-02-25 [1] CRAN (R 4.0.4)
#>  tidyselect    1.1.0   2020-05-11 [1] CRAN (R 4.0.3)
#>  units         0.7-1   2021-03-16 [1] CRAN (R 4.0.4)
#>  utf8          1.2.1   2021-03-12 [1] CRAN (R 4.0.4)
#>  vctrs         0.3.6   2020-12-17 [1] CRAN (R 4.0.4)
#>  withr         2.4.1   2021-01-26 [1] CRAN (R 4.0.4)
#>  xfun          0.22    2021-03-11 [1] CRAN (R 4.0.4)
#>  yaml          2.2.1   2020-02-01 [1] CRAN (R 4.0.3)
#>
#> [1] C:/Users/OLMC/Documents/R/win-library/4.0
#> [2] C:/Program Files/R/R-4.0.4/library
from maptiles.
rCarto
commented on May 28, 2024
All right, I checked on mac and windows machines, aaaaand you were right, it's definitely a platform problem.
You can try ragg::agg_png() as an alternative to png(), I had good results with it on windows.
My feeling is that the problem is not linked to maptiles itself but more generally to raster export. I'll try to export other raster objects (from raster and graphics::image())) to be sure.
See also : https://www.jumpingrivers.com/blog/r-graphics-cairo-png-pdf-saving/
from maptiles.
 rhijmans
commented on May 28, 2024
rhijmans
commented on May 28, 2024
You can also write a png file like this
writeRaster( tiles_3857, "tiles_3857.png", NAflag=NA, overwrite=TRUE)
from maptiles.
 Nowosad
commented on May 28, 2024
Nowosad
commented on May 28, 2024
Hey @rCarto - I have tried a few graphic devices on Fedora - all return a slightly blurry image... Could you share your resulting terra object? If it is identical to mine, then we (probably) could confirm that it is not related to data downloading...
from maptiles.
rCarto
commented on May 28, 2024
Hi @Nowosad , this is what I get:
library(maptiles)
library(sf)
#> Linking to GEOS 3.7.1, GDAL 3.1.2, PROJ 7.1.0
library(terra)
#> terra version 1.3.4
zone_4326 <- st_as_sfc(st_bbox(c(xmin = 14.63128, xmax = 15.20052,
                                 ymin = 54.93529, ymax = 55.31899),
                               crs = 4326))
zone_3857 <- st_transform(zone_4326, 3857)
tiles_3857 <- get_tiles(x = zone_3857, zoom = 10, cache = "cache")

# png export via png() & plot_tiles()
tile_dim <- dim(tiles_3857)
png("export_1.png", width = tile_dim[2], height = tile_dim[1])
plot_tiles(tiles_3857, smooth = FALSE)
dev.off()
#> png
#>   2

# png export via writeRaster()
terra::writeRaster(tiles_3857, "export_2.png", NAflag = NA, overwrite = TRUE)
#> Warning in x@ptr$writeRaster(opt): GDAL Message 6: driver MEM does not support
#> creation option PHOTOMETRIC

# tiff export
terra::writeRaster( tiles_3857, "export.tif", NAflag = NA, overwrite = TRUE)

# rds export
saveRDS(object = wrap(tiles_3857),file = 'export.rds')
# rds import
tiles_3857_import <- rast(readRDS('export.rds'))
Created on 2021-07-20 by the reprex package (v2.0.0)
I don't think the warning from the second png export is relevant here.
Zip file that contains exported files :
export.zip
from maptiles.
Nowosad
commented on May 28, 2024
Just to confirm - I got the same images as yours.
Interactive viewing returns, however, worse quality image. Below you can find two examples:
- Default behavior of
plotRGB()
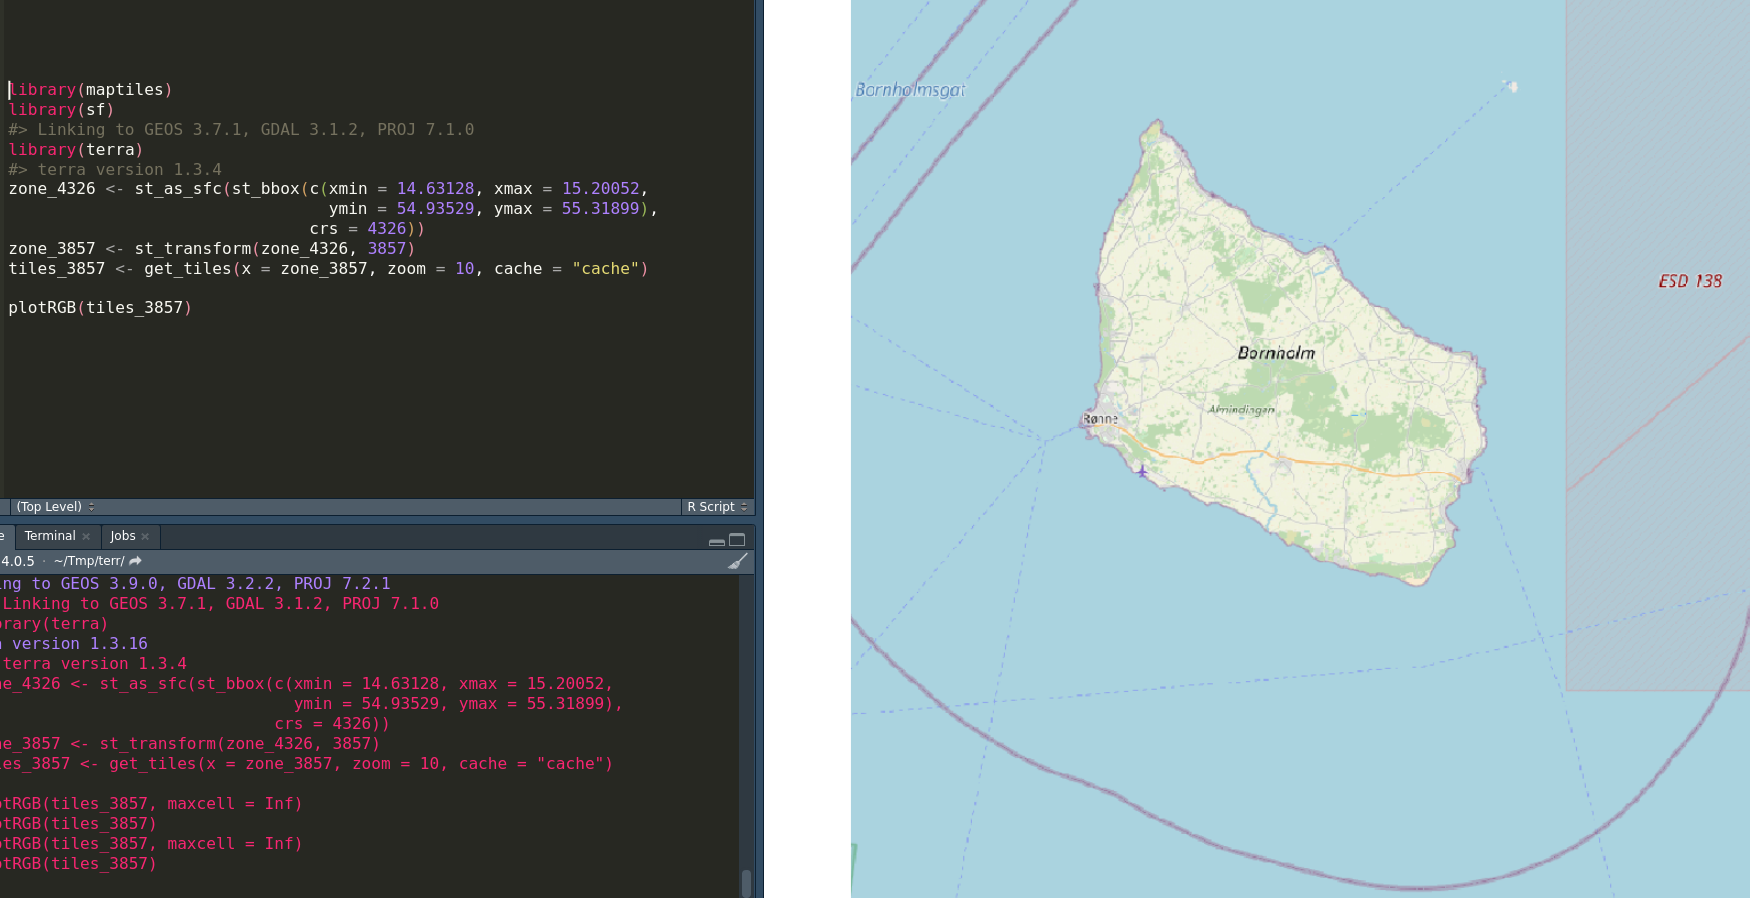
plotRGB()withmaxcell = Inf- better, but still far from perfect

from maptiles.
rCarto
commented on May 28, 2024
@Nowosad ,
plotRGB() plots the image entire on the whole graphic device.
If the raster is smaller than the device (in pixels) the image is zoomed-in:

if the raster is larger than the device, the image is zoomed-out :

In both cases the quality of the resulting image is lower than the original. This happens to every raster images but it's more visible with map tiles because of labels, roads and small elements. I don't think we can do anything about that.
However,
In the pixel branch of maptiles I've added a pixel argument to plot_tiles().
When pixel=TRUE, if the raster is smaller than the device, the raster is centered with margins:

if the raster is larger than the device, the raster is cropped:

What do you think?
from maptiles.
Nowosad
commented on May 28, 2024
Neat. It works well.
(Just a side note: now I think of an impact can this whole issue have on mapping packages (e.g., mapsf or tmap - @mtennekes) ; or in different words - how they should behave/what can they do with it)
from maptiles.
rCarto
commented on May 28, 2024
see adjust arg in plot_tiles()
from maptiles.
Related Issues (19)
- SpatExtent argument HOT 1
- consider caching the composed tiles
- Timeout was reached: HOT 2
- Timeout was reached SOLVED
- Error in png::readPNG(img) : file is not in PNG format HOT 5
- additional info EPSG28992 tiles projection issue
- tiles look unsharp, even with adjust = TRUE HOT 2
- Use tiles with CRS != EPSG:3857 HOT 1
- plot_tiles doesn't show new tiles HOT 2
- Add alpha channel to png tiles HOT 2
- Typo in get_tiles() example
- Explicit (OGC) WMTS support HOT 5
- Use preferred tile.openstreetmap.org URL
- Update stamen styles (=> stadia)
- Getting error when running example : unable to find an inherited method for function ‘crs’ for signature ‘"character"’ HOT 4
- resolution of fetched tiles HOT 4
- Add more providers HOT 1
- add tiles providers HOT 8
Recommend Projects
-
 React
React
A declarative, efficient, and flexible JavaScript library for building user interfaces.
-
Vue.js
🖖 Vue.js is a progressive, incrementally-adoptable JavaScript framework for building UI on the web.
-
 Typescript
TypeScript is a superset of JavaScript that compiles to clean JavaScript output.
-
TensorFlow
An Open Source Machine Learning Framework for Everyone
-
Django
The Web framework for perfectionists with deadlines.
-
 Laravel
A PHP framework for web artisans
-
D3
Bring data to life with SVG, Canvas and HTML. 📊📈🎉
-
Recommend Topics
-
javascript
JavaScript (JS) is a lightweight interpreted programming language with first-class functions.
-
web
Some thing interesting about web. New door for the world.
-
server
A server is a program made to process requests and deliver data to clients.
-
Machine learning
Machine learning is a way of modeling and interpreting data that allows a piece of software to respond intelligently.
-
Visualization
Some thing interesting about visualization, use data art
-
Game
Some thing interesting about game, make everyone happy.
Recommend Org
-
Facebook
We are working to build community through open source technology. NB: members must have two-factor auth.
-
Microsoft
Open source projects and samples from Microsoft.
-
Google
Google ❤️ Open Source for everyone.
-
Alibaba
Alibaba Open Source for everyone
-
D3
Data-Driven Documents codes.
-
Tencent
China tencent open source team.
from maptiles.