Comments (34)
 slundberg
commented on May 3, 2024
4
slundberg
commented on May 3, 2024
4
Sorry this taken a while. I have had travel and deadlines that slowed down
work here. I plan to work on this and the color handling after I get a
paper revision out in the next few weeks.
…On Mon, May 21, 2018 at 2:02 PM kodonnell ***@***.***> wrote:
@annaveronika <https://github.com/annaveronika> it seems to be supported
already for dot plot (sorry if background is black - copy and paste from
jupyter is doing that to them):
[image: image]
<https://user-images.githubusercontent.com/8204904/40329463-bfbd7942-5d9d-11e8-8397-775cb3eede01.png>
I've also just tweaked it to support violin plots, as below. It already
supports drawing unique bins, so it would have handled category 'right'
anyway, provided there weren't too many unique values. Anyway, I've just
made it so that if the input column is a string, always plot unique layers
per category - and use the grey color scheme as you've requested.
[image: image]
<https://user-images.githubusercontent.com/8204904/40329431-ab597dd4-5d9d-11e8-90c1-fdc593f611c9.png>
Instead of graduated grey, I could also just have a single grey i.e.:
[image: image]
<https://user-images.githubusercontent.com/8204904/40329702-817c1f20-5d9e-11e8-9e14-8e8947f9118f.png>
Again, I'm not sure this is a good idea, but oh well.
@slundberg <https://github.com/slundberg> , It'd probably make sense to
tidy up the color handling (e.g. #62
<#62>) as part of this.
—
You are receiving this because you were mentioned.
Reply to this email directly, view it on GitHub
<#58 (comment)>, or mute
the thread
<https://github.com/notifications/unsubscribe-auth/ADkTxV2bdNMtMo2CkdUyntI5K6AHpQU7ks5t0ytsgaJpZM4TYvBw>
.
from shap.
slundberg
commented on May 3, 2024
3
@annaveronika great! Glad it is helpful. Then I should also add support for catboost to the shap TreeExplainer interface as well.
Do you have support for SHAP interaction values or just SHAP values right now?
I'll go over the categorical summary plot code later today. I often just embed categorical features as integer values so I have not run into it myself yet.
from shap.
 kodonnell
commented on May 3, 2024
2
kodonnell
commented on May 3, 2024
2
@annaveronika it seems to be supported already for dot plot (sorry if background is black - copy and paste from jupyter is doing that to them):
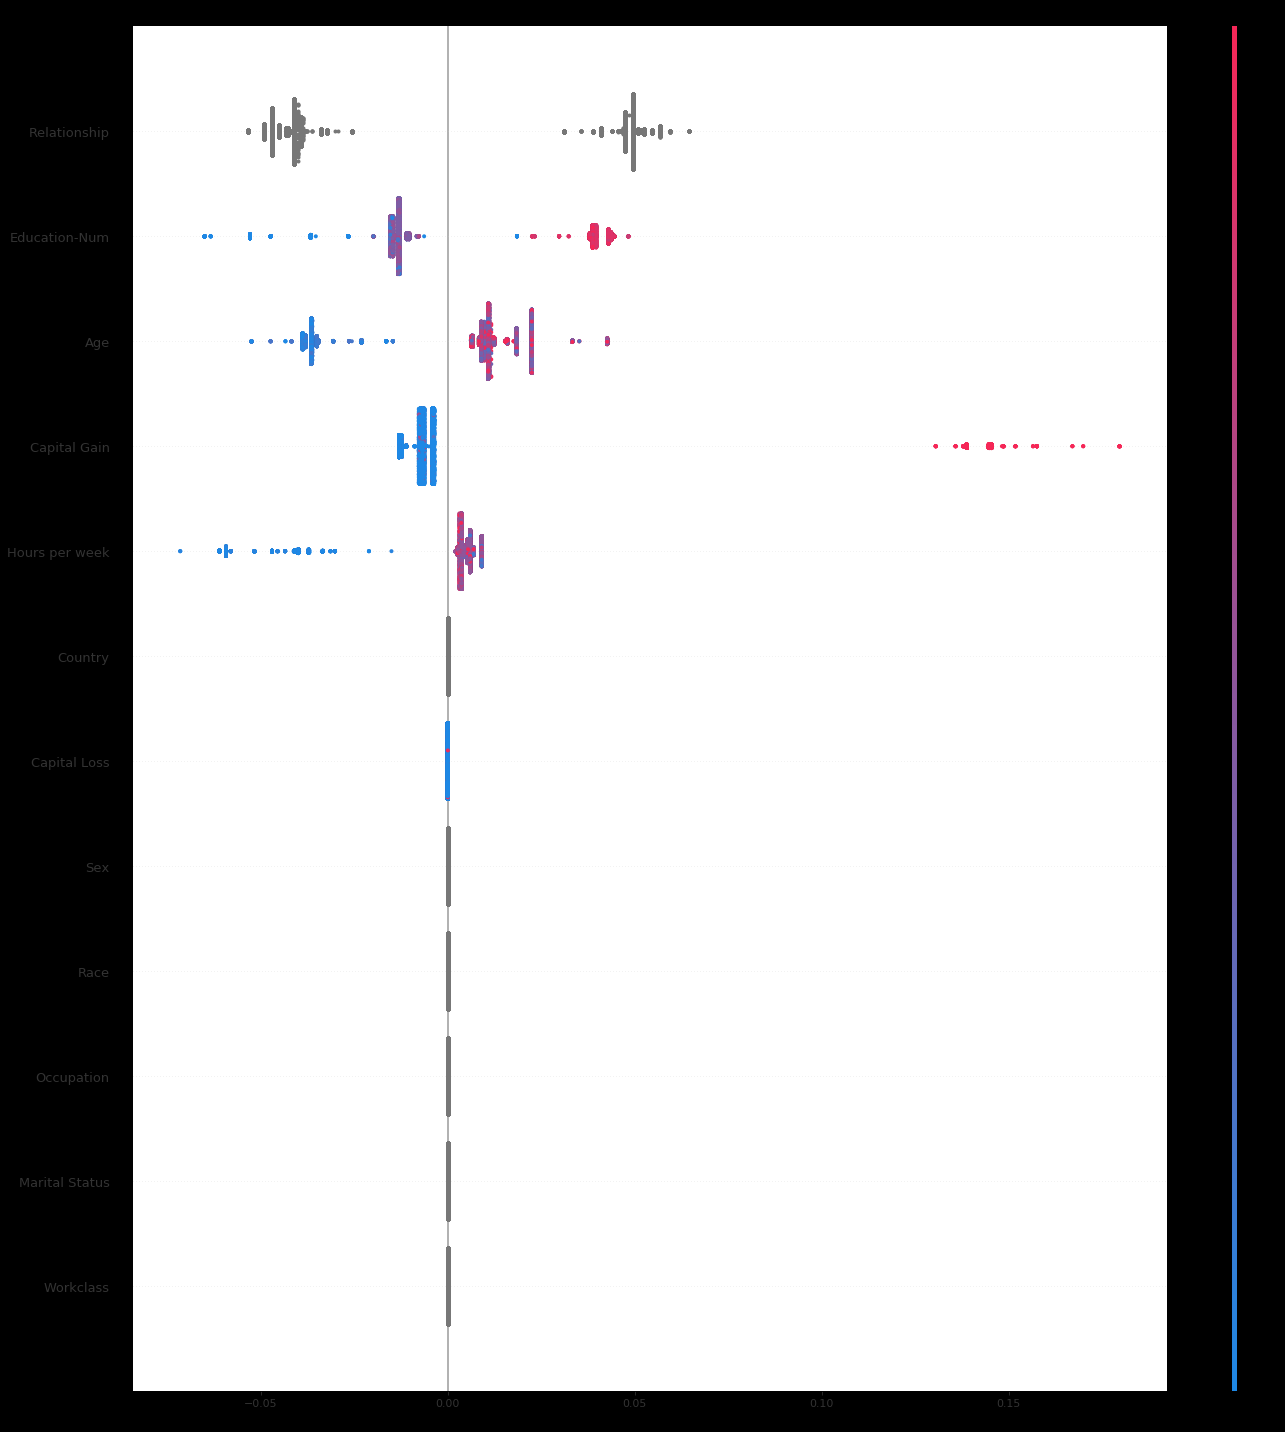
I've also just tweaked it to support violin plots, as below. It already supports drawing unique bins, so it would have handled category 'right' anyway, provided there weren't too many unique values. Anyway, I've just made it so that if the input column is a string, always plot unique layers per category - and use the grey color scheme as you've requested.

Instead of graduated grey, I could also just have a single grey i.e.:
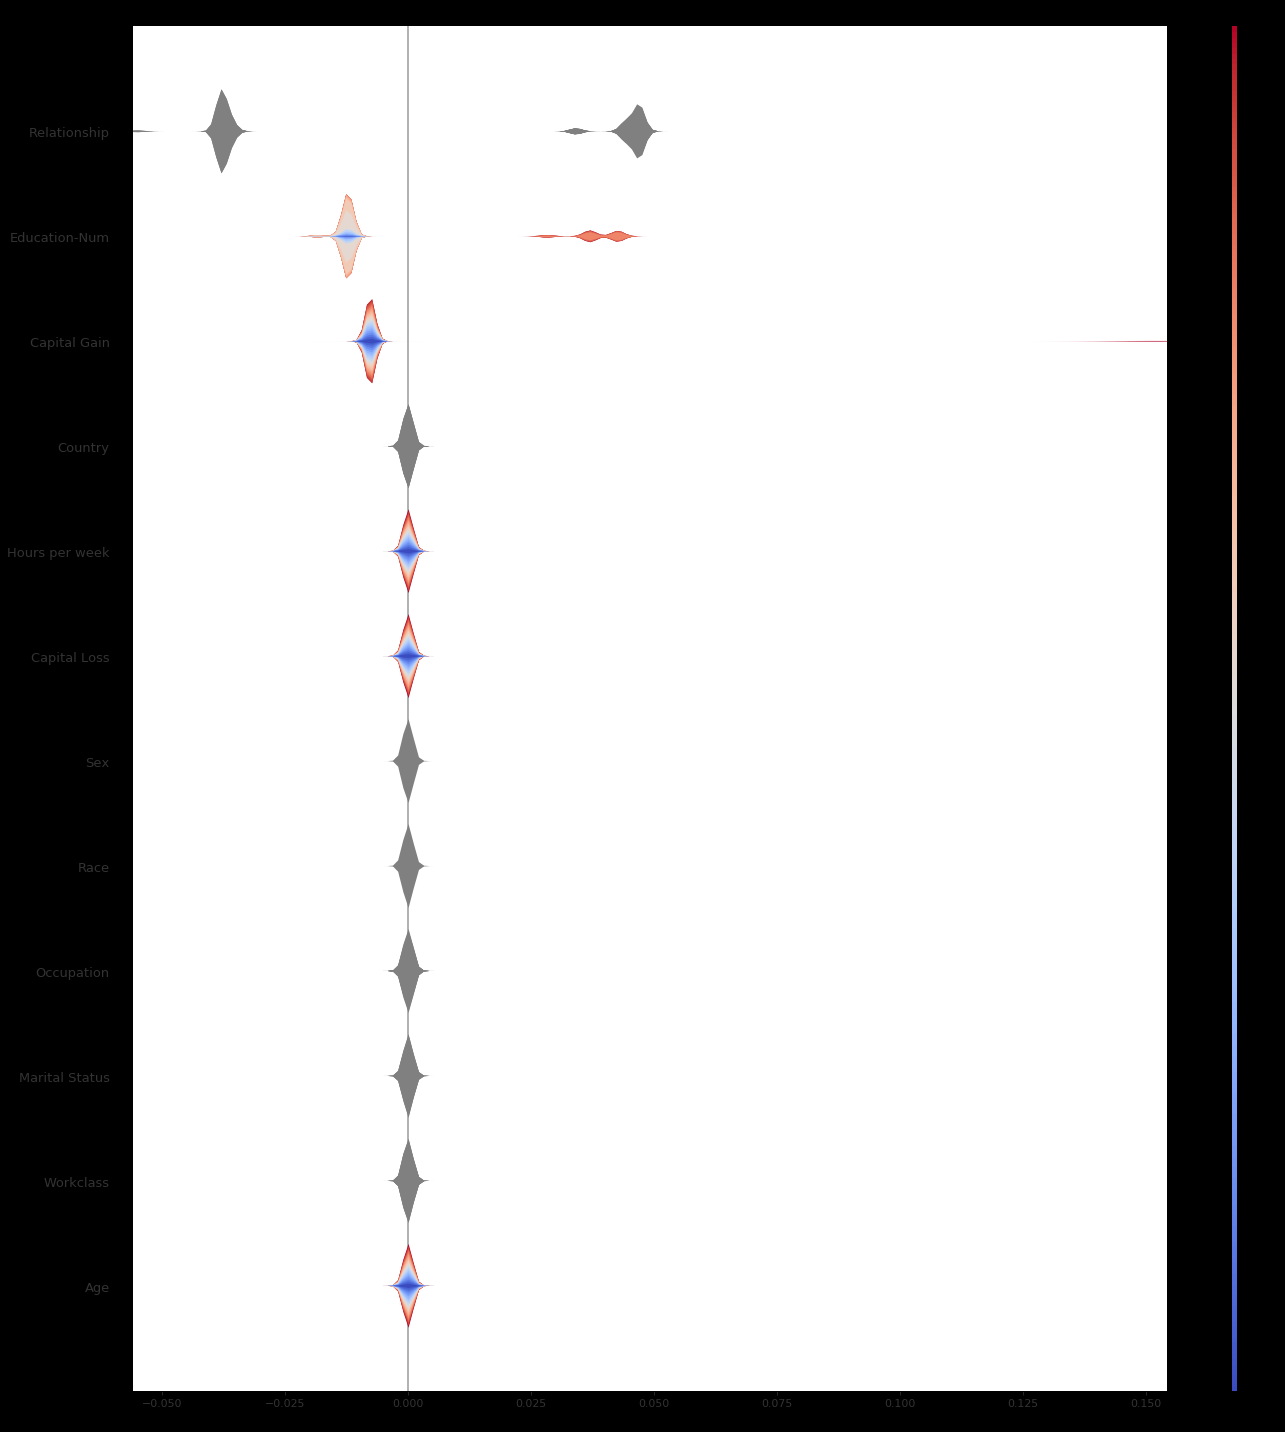
Again, I'm not sure this is a good idea, but oh well.
@slundberg , It'd probably make sense to tidy up the color handling (e.g. #62) as part of this.
from shap.
 JoElfner
commented on May 3, 2024
2
JoElfner
commented on May 3, 2024
2
@slundberg @annaveronika
I gave it a try. Is #1370 helping with this issue?
from shap.
 annaveronika
commented on May 3, 2024
1
annaveronika
commented on May 3, 2024
1
Actually it's already on github, you don't need the file
from shap.
slundberg
commented on May 3, 2024
1
@annaveronika cool. Let me know if you end up simplifying the interface to not need to respecify the categorical features. If you do I'll add catboost to the TreeExplainer interface and note it in the README.
As for expanding the one hot features to see the impact of categorial features that depends on how the algorithm is splitting in the trees. There is information from the zero entries of the category as well as the "one" part. So how credit would get divided up among the categories depends on how the model splits on them. Does the model split as if the categories are one hot encoded? Then the SHAP values will be assigned to each category individually. Are the categories split on in some joint way? Then the SHAP value will be assigned to the whole feature, and which category is more important than another is not directly measured (though it can be inferred by the global pattern of seeing more influence assigned to that feature when a specific category is "on"). All this means we can't just split out the attribution for each category unless the model itself already splits on each category separately, and hence we get SHAP values for every category for each sample.
from shap.
 Trollgeir
commented on May 3, 2024
1
Trollgeir
commented on May 3, 2024
1
The grey dots don't really tell me anything when I don't know what category they represent. (Then I might as well just plot with plot_type='bar'.)
Instead of grey, is there a possibility to have some sort of color-mapping of the categories? Or would this be better visualized outside the plot_summary()?
from shap.
slundberg
commented on May 3, 2024
1
I seriously underestimated how many issues would come on here when I thought I could fix this in May :) ...I am adding a todo and help wanted label here to note that testing out SHAP with numeric categorical inputs for CatBoost needs to happen at some point.
from shap.
 alexandregerbeaux
commented on May 3, 2024
alexandregerbeaux
commented on May 3, 2024
Hi Annaveronika,
Thank you for the post! Wanted to have a look on your notebook, is it on the master branch yet?
from shap.
annaveronika
commented on May 3, 2024
Thank you for a quick answer! Yes, it'll sync there from our internal repo in about half an hour. Here is the file:
shap_values_tutorial.txt
You need to change it from txt to ipynb first, github doesn't allow ipynb.
from shap.
annaveronika
commented on May 3, 2024
Plots are not shown for ipynb, so I'm converting the file to html. The link will be
https://github.com/catboost/catboost/blob/master/catboost/tutorials/advanced_tutorials/shap_values_tutorial.html
from shap.
annaveronika
commented on May 3, 2024
Currently only SHAP values
from shap.
annaveronika
commented on May 3, 2024
It would be also cool to support dependence_plot for categorical features that have not many distinct values
from shap.
slundberg
commented on May 3, 2024
It does to some extent already as in: https://slundberg.github.io/shap/notebooks/Census+income+classification+with+LightGBM.html
But I'll look more at it in a bit.
from shap.
kodonnell
commented on May 3, 2024
FYI I've implemented the code for this and used it within our company. I can't remember if it was part of the original PR (#17), but I can dig out the code if you wish.
from shap.
slundberg
commented on May 3, 2024
I see now what you meant, that the categorical features were stored as strings instead of numeric values. I just pushed an update that accepts strings in the data matrix for the summary_plot.
A question related to the categorical features:
If I run
model.get_feature_importance(data=Pool(X_adult, y_adult)
instead of
model.get_feature_importance(data=Pool(X_adult, y_adult, cat_features=cat_features)
I get an error because it tries to convert the strings to floats. Doesn't the model already know which columns are categorical since we told it during training? And if so why the re-specification in the Pool constructor?
I ask because if I also support catboost in the TreeExplainer interface it would be nice to not have to tell the model all over again about which columns are categorical features.
from shap.
annaveronika
commented on May 3, 2024
Currently class Pool stores all the data in numeric format. For categorical features we store hashes. To understand if you need to calculate hash, you need to tell this class - it's a categorical feature. So now it's just not possible to build Pool class without this parameter.
We are going to change this in one of the next releases. It's not a very simple change - if it's a string, calculate hash - because we calculate hashes for all categorical features, and they might be not only strings, but also integers. So it'll take some time.
Here is the issue:
catboost/catboost#317
from shap.
kodonnell
commented on May 3, 2024
One problem with visualization is that you cannot visualize summary_plot if some features are categorical. I suggest in this case to draw all the dots in gray color for example. It will still make a lot of sense, because you see the effect of categorical feature value on the objects in the train dataset.
@annaveronika note that 'categories' (i.e. features with only a few values like e.g. gender) are supported in the layered_violin plot type - see here for more detail, but you can see how it's handled. Since most categorical data is one-hot encoded, this colored approach would work (blue = 0, red = 1) - that's what we used when showing clients etc. Not sure if you can do that with catboost.
However, this isn't meant to support categorical values in general, just unique values (e.g. if people get a grade 1-10, it makes sense to 'layer' by the 1-10 buckets, not percentiles). Of course, trying to display categorical variables as a single feature (as opposed to multiple features via one-hot encoding etc.) is probably not a good idea (in the same way just treating categories as a continuous variable 1-N generally isn't).
from shap.
annaveronika
commented on May 3, 2024
@kodonnell It would be nice to be able to plot colored version for float features and gray version for categorical features on the same plot + support strings for categorical features (as well as integer values).
It works really great for categorical featues with no one-hot-encoding - there is an example on github, where we work with dataset with only categorical features: https://github.com/catboost/catboost/blob/master/catboost/tutorials/advanced_tutorials/shap_values_tutorial.ipynb
The most important feature is Manager ID there, and it has many values, so you cannot interpret it like importance for each category. But from this plot you can very well understand the influence.
About one-hot-endocoding. Actually, the good way to handle one-hot-endoding is to do it inside the algorithm, not to force user to do it. Otherwise he will have a large dataset.
In case of one-hot endocing it would be really nice to do the interface, where user provides his dataset in form of not one-hot encoded feature values. And shap values are given per-category for one-hot encoded features and per-feature in case of everything else + one-hot-endoded features.
from shap.
annaveronika
commented on May 3, 2024
@slundberg Actually the trained model knows already which features are categorical, and this update will be very simple. I'll write here when it's done.
from shap.
kodonnell
commented on May 3, 2024
@annaveronika - it wouldn't be hard at all to support different colors (see #62) per feature, and then you could do whatever you want. However, I think my point about trying to display a categorical variable in a single plot still stands: you can't draw any conclusion from MGR_ID except some (or one) of the values is important. And, if it is only a few, then you want to be highlighting the importance of these few categories, not the category overall (which might be misleading). If you showed the individual one-hot encoded category features (which will have difference importance), then you can see this.
Actually, the good way to handle one-hot-endoding is to do it inside the algorithm, not to force user to do it.
Well, maybe - there's a reason many popular libraries don't do this. I like philosophy that the model suite should stick to models, and data preparation should be part of a more specialized suite.
And shap values are given per-category for one-hot encoded features and per-feature in case of everything else + one-hot-endoded features.
Similar applies to this: I'd argue shap should stick with just returning shap values, and if you want to make a tool to simplify the step of expanding the category into one-hot, running shap, and then compressing it back to your format, that's up to you.
from shap.
annaveronika
commented on May 3, 2024
@slundberg We've added method model.get_cat_feature_indices(), it's on github now, so you can try it (you need to build catboost from code, here is the instruction https://tech.yandex.com/catboost/doc/dg/installation/python-installation-method-build-from-source-linux-macos-docpage/#python-installation-method-build-from-source-linux-macos)
It will be on pypi in a few days, most likely by the end of this week.
from shap.
slundberg
commented on May 3, 2024
Great! I'll check it out this week.
from shap.
annaveronika
commented on May 3, 2024
@slundberg About categorical feature support in catboost. We are doing several things for categorical features.
We do one-hot encoding for features with little amount of values. And calculate statistics for others.
Statistics are one of two types - without label usage and with label usage. First one is just frequency of a category. Second one (for binary classification) is estimation of success probability with this category. In simplest case you estimate this using the whole dataset, but it leads to overfitting, so for every object we calculate this probability based on a part of dataset, namely we perform random permutation, and for each object we use objects before this one in permutation for this estimation.
We also calculate these statistics based on categorical feature combinations.
It is all explained in the paper here: http://learningsys.org/nips17/assets/papers/paper_11.pdf
So it would be great if for one-hot encoded features we could show importance of every category and for others we show importance of the whole feature. It would be great if the user of the library in this case didn't have to do any processing on his dataset. He just calls our function for calculating shap values and then calls shap function for showing the results.
from shap.
annaveronika
commented on May 3, 2024
@slundberg We don't yet calculate shap values for categorical features combinations. To calculate shap values in catboost you need to train with parameter max_ctr_complexity=1, which disables combinations.
By the way what do you think would be a correct way to deal with combinations? There are usually many combinations (there might be thousands of them), so if you show importance for each of them separately it will be too many to make any conclusions.
Splitting importance equally between features that take part in combination doesn't seem like a correct way, but I don't see a better one
from shap.
annaveronika
commented on May 3, 2024
@kodonnell "You can't draw any conclusion from MGR_ID" - I think I can - I see that manager id is very important for the resulting prediction. For very many objects it has small positive influence and for ones that it has negative influence, the influence differs a lot. For some it has very large influence, for others not that large. Overall MGR_ID is the most infulential feature in the whole dataset.
from shap.
annaveronika
commented on May 3, 2024
@kodonnell "Well, maybe - there's a reason many popular libraries don't do this. I like philosophy that the model suite should stick to models, and data preparation should be part of a more specialized suite."
-
Deciding if you do one-hot encoding or you don't can be (and should be if the algorithm is able to do it) a part of the alrogithm. One-hot endocing usually works well for categorical features with little amound of values. For others it's better to calculate other statistics.
-
It is much more efficient in terms of data size as well as for training speed to allow the algorithm to do it for you. About the memory - if you do it yourself, your datasize will increase times number of categories, which might be large. About speed - if you do it during preprocessing, alrogithm will think it's n different features, so you need to do n passes throught the dataset when calculating scores for each of them. If you allow the algorithm to do it for you, it will be one pass.
-
It might affect quality if you lie to the algorithm and say that these are different features.
In catboost we use some randomness when selecting the splits in the tree. We add random noise to the scores, and it helps to reduce overfitting. We do it in the following way: we first select best split inside the feature and then calculate scores again to compare different features. So that if a feature has many splits, it doesn't get an unfair advantage because there are more coin drops.
In case if you say to the algorithm - these are many features, algorithm will treat them as separate ones.
from shap.
annaveronika
commented on May 3, 2024
@kodonnell So other libraries don't deal with categorical features, that's why for them one-hot endcoding is preparation step. And for us it's a part of the alrogithm.
from shap.
annaveronika
commented on May 3, 2024
@slundberg The new version is now on pypi
from shap.
kodonnell
commented on May 3, 2024
@annaveronika, we disagree, and that's fine - but we probably don't need to continue it in this thread. However, I will mention that I'm pretty sure I've used other libraries that 'automatically' handle categorical features, so I'm not sure you should claim that no other libraries "don't deal with categorical features".
The part that is relevant is how you represent categorical features in a shap plot, which is discussed above.
from shap.
slundberg
commented on May 3, 2024
@annaveronika thanks! I looked at the paper you mentioned and I can see how knowing all the one-hot features are from the same category would be helpful, and why making an auto choice is nice. I am not sure how best to make the interface that would assigned a value to each of the categories individually. In practice I think we get a lot of the value as-is since looking across the dataset we can see the importance of observing different categories in different samples.
As for the combinations...I didn't quite understand the final form of the trees from reading the paper. After a combination is replaced with a numeric value, is that numeric value thresholded on the same axis as the original feature that "seeded" the combination? My high level thought is that a combination is an AND function, and that AND function can be represented by a small tree. If you could define an equivalent tree that only thresholds on individual features, then you could use Tree SHAP. Note that this equivalent tree wouldn't have to be the same as the original one, it might expand interaction thresholds into two splits for example. However, if these interaction indexes are thresholded on the same axis as the original category embeddings then I am not sure this kind of decomposition would be possible. It is an interesting problem.
from shap.
slundberg
commented on May 3, 2024
@annaveronika I added a CatBoost binding to TreeExplainer and updated the ReadMe to mention CatBoost as one of the supported model types :)
When I get some time I'll play more with the categorical feature plots as well.
from shap.
annaveronika
commented on May 3, 2024
@slundberg Any updates on the initial issue - plotting graph when there are string values?
from shap.
 Utsabab
commented on May 3, 2024
Utsabab
commented on May 3, 2024
Any updates on color visualization for categorical values in the summary plot?
from shap.
Related Issues (20)
- BUG: LightGBM with multiclass interaction TreeShap produces explainer error HOT 12
- ENH: Integrate Fasttreeshap speedup into SHAP HOT 2
- BUG: `base_score` attribute of the `XGBTreeModelLoader` is broken for all exponential losses (e.g. tweedie, poisson) HOT 4
- BUG: ERROR USING LLAMA-2 HOT 15
- BUG: 0.45.0 update breaks pytorch example on docs HOT 1
- x
- BUG: Error using Falcon for text-generation HOT 4
- BUG: Error when using DeepExplainer on LSTM Model HOT 1
- ENH: Partition Explainer for Video Models
- Does Feature/Column Order of dataset matter while calculating SHAP values? HOT 3
- When will the paddlepaddle framework be supported HOT 1
- BUG: LookupError: gradient registry has no entry for: shap_TensorListStack HOT 1
- BUG: shap summary plot for 3 group classification HOT 1
- ENH: Include directionality of feature association in beeswarm plot
- ENH: Support SeLU and activation function in Pytorch Deep Explainer
- BUG: tensorflow DeepExplainer SHAP explanations do not sum up to the model's output HOT 1
- Question: Using SHAP with GPT-4 via API HOT 1
- BUG: Warning: unrecognized nn.Module: Chomp1d HOT 2
- CI broken: mistralai Mistral-7B-v0.1 Tokenizer no longer accessible
- BUG: summary_plot ignores plot_type for TreeExplainer
Recommend Projects
-
 React
React
A declarative, efficient, and flexible JavaScript library for building user interfaces.
-
Vue.js
🖖 Vue.js is a progressive, incrementally-adoptable JavaScript framework for building UI on the web.
-
 Typescript
TypeScript is a superset of JavaScript that compiles to clean JavaScript output.
-
TensorFlow
An Open Source Machine Learning Framework for Everyone
-
Django
The Web framework for perfectionists with deadlines.
-
 Laravel
A PHP framework for web artisans
-
D3
Bring data to life with SVG, Canvas and HTML. 📊📈🎉
-
Recommend Topics
-
javascript
JavaScript (JS) is a lightweight interpreted programming language with first-class functions.
-
web
Some thing interesting about web. New door for the world.
-
server
A server is a program made to process requests and deliver data to clients.
-
Machine learning
Machine learning is a way of modeling and interpreting data that allows a piece of software to respond intelligently.
-
Visualization
Some thing interesting about visualization, use data art
-
Game
Some thing interesting about game, make everyone happy.
Recommend Org
-
Facebook
We are working to build community through open source technology. NB: members must have two-factor auth.
-
Microsoft
Open source projects and samples from Microsoft.
-
Google
Google ❤️ Open Source for everyone.
-
Alibaba
Alibaba Open Source for everyone
-
D3
Data-Driven Documents codes.
-
Tencent
China tencent open source team.
from shap.