GithubHelp home page GithubHelp logo

tim-abwao / eda-report Goto Github PK

View Code? Open in Web Editor NEW
9.0 3.0 0.0 18.62 MB

Automatically perform exploratory data analysis, and generate a report in Word '.docx' format.

Home Page: https://eda-report.readthedocs.io/

License: MIT License

Jupyter Notebook 72.34% Python 27.66%
exploratory-data-analysis docx auto-eda data-analysis eda-report

eda-report's Introduction

eda-report - Automated Exploratory Data Analysis

Binder PyPI version Python 3.9 - 3.11 Documentation Status codecov Code style: black

A Python program to help automate the exploratory data analysis and reporting process.

Input data is analyzed using pandas and SciPy. Graphs are plotted using matplotlib. The results are then nicely packaged as a Word (.docx) document using python-docx.

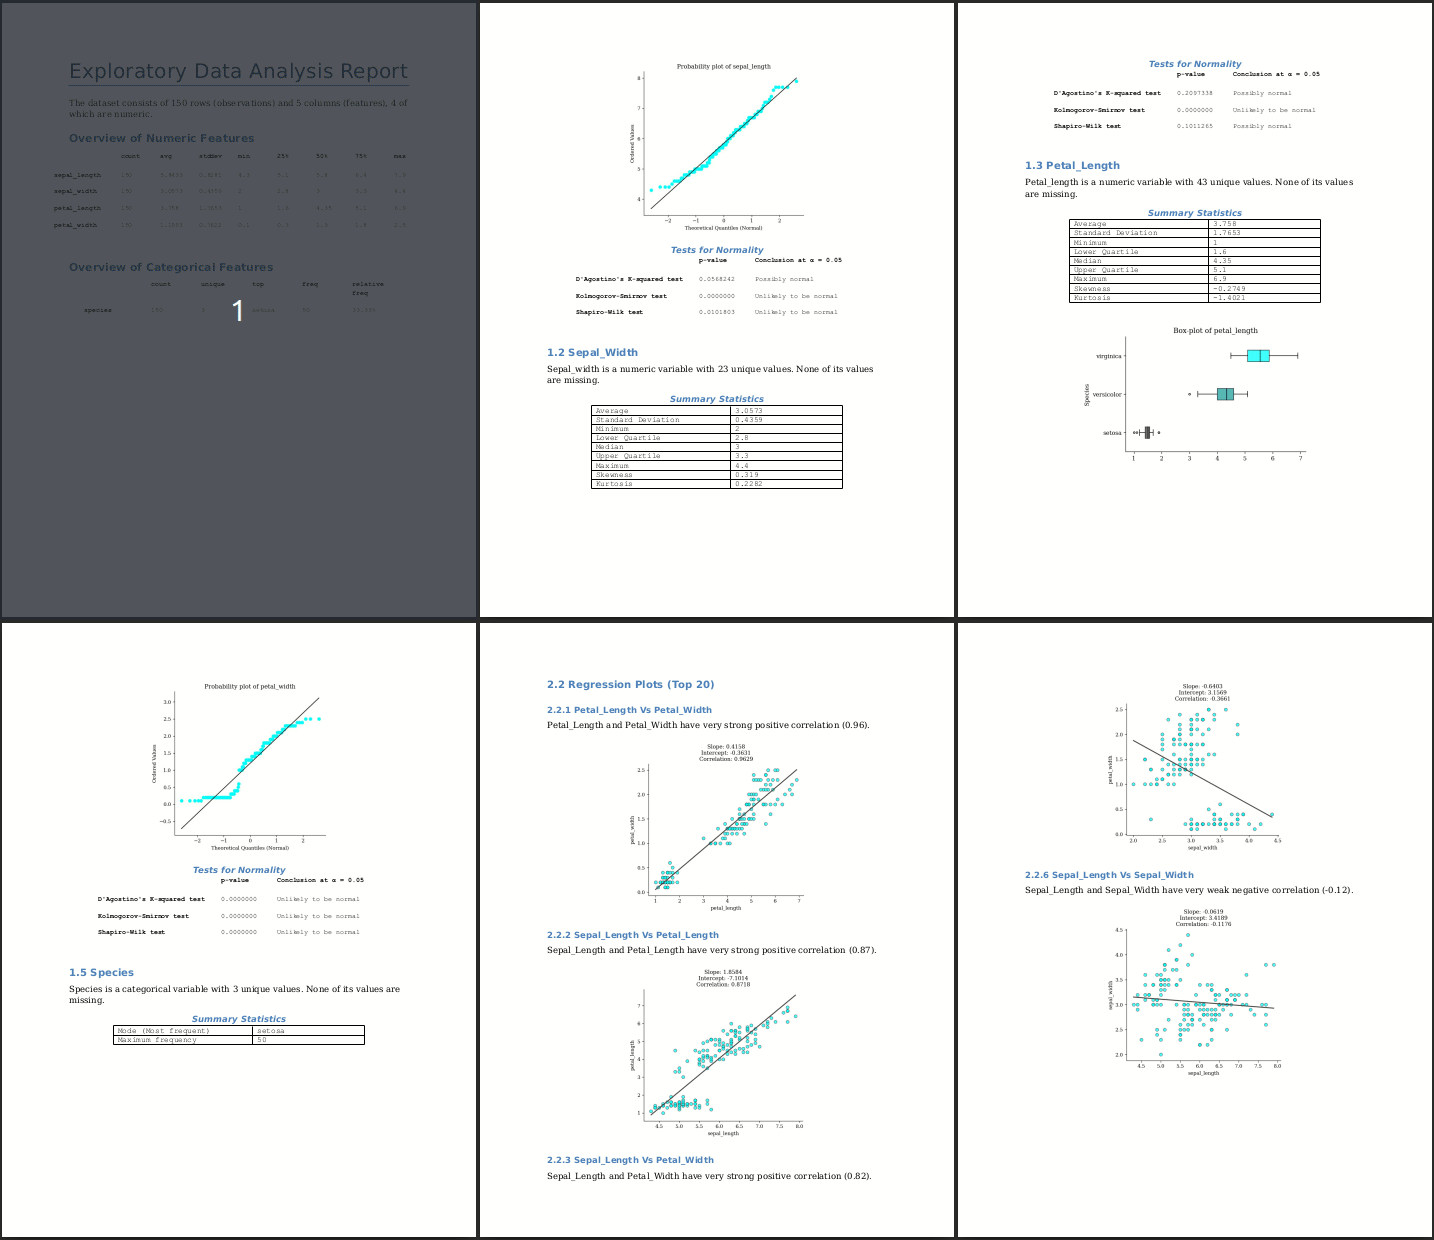
screencast of report document from iris dataset

Installation

You can install the package from PyPI using:

pip install eda-report

Basic Usage

1. Graphical User Interface

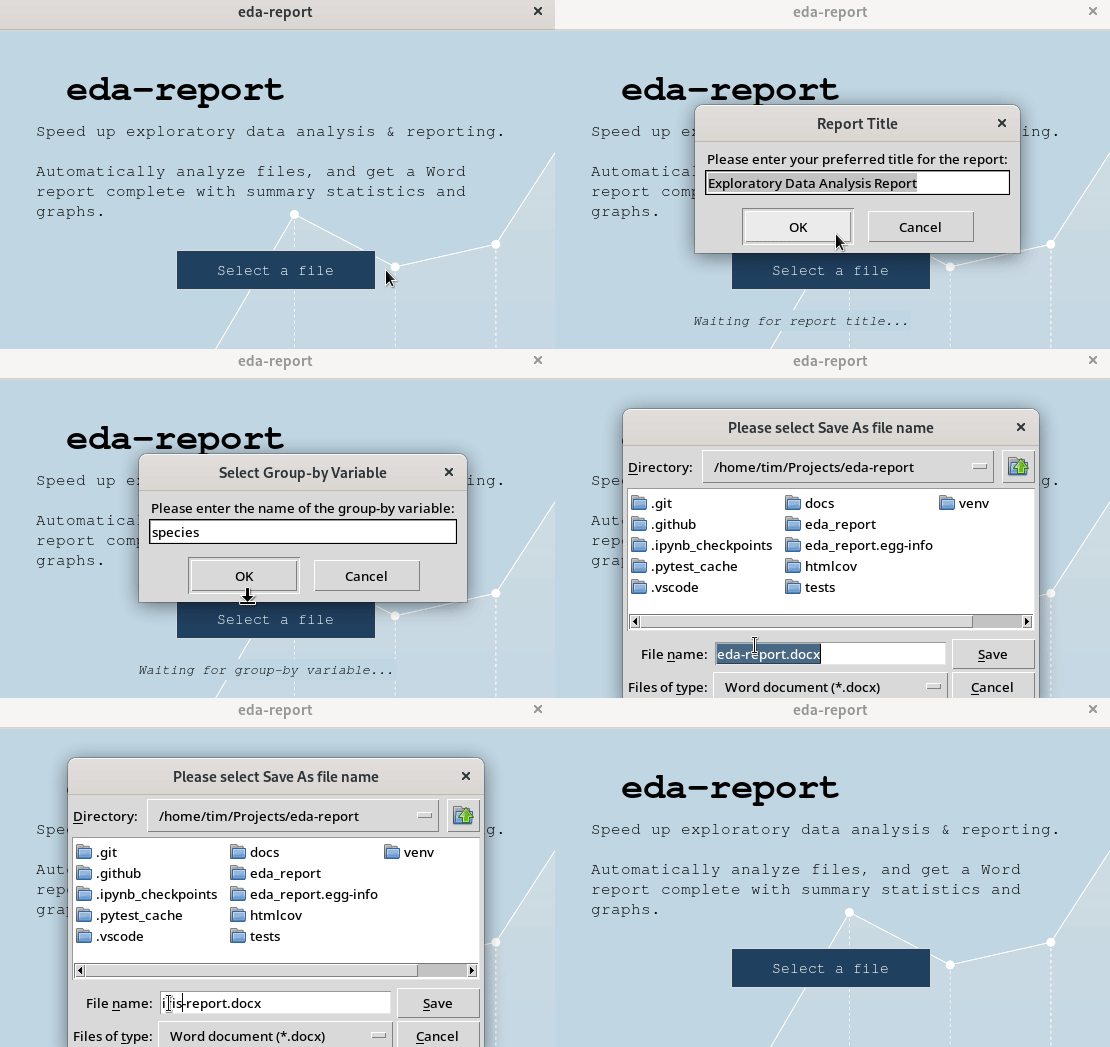
The eda-report command launches a graphical window to help select a csv/excel file to analyze:

eda-report

screencast of the gui

You'll be prompted to set a report title, group-by/target variable (optional), graph color and output filename; after which the contents of the input file are analyzed, and the results saved in a Word (.docx) document.

NOTE: For help with Tk - related issues, consider visiting TkDocs.

2. Command Line Interface

$ eda-report -i iris.csv -o iris-report.docx
Analyze variables:  100%|███████████████████████████████████| 5/5
Plot variables:     100%|███████████████████████████████████| 5/5
Bivariate analysis: 100%|███████████████████████████████████| 6/6 pairs.
[INFO 02:12:22.146] Done. Results saved as 'iris-report.docx'
$ eda-report -h
usage: eda-report [-h] [-i INFILE] [-o OUTFILE] [-t TITLE] [-c COLOR]
                  [-g GROUPBY]

Automatically analyze data and generate reports. A graphical user interface
will be launched if none of the optional arguments is specified.

optional arguments:
  -h, --help            show this help message and exit
  -i INFILE, --infile INFILE
                        A .csv or .xlsx file to analyze.
  -o OUTFILE, --outfile OUTFILE
                        The output name for analysis results (default: eda-
                        report.docx)
  -t TITLE, --title TITLE
                        The top level heading for the report (default:
                        Exploratory Data Analysis Report)
  -c COLOR, --color COLOR
                        The color to apply to graphs (default: cyan)
  -g GROUPBY, -T GROUPBY, --groupby GROUPBY, --target GROUPBY
                        The variable to use for grouping plotted values. An
                        integer value is treated as a column index, whereas a
                        string is treated as a column label.

3. Interpreter Session

>>> eda_report.summarize(iris_data)

                  Summary Statistics for Numeric features (4)
                  -------------------------------------------
                count     avg  stddev  min  25%   50%  75%  max  skewness  kurtosis
  sepal_length    150  5.8433  0.8281  4.3  5.1  5.80  6.4  7.9    0.3149   -0.5521
  sepal_width     150  3.0573  0.4359  2.0  2.8  3.00  3.3  4.4    0.3190    0.2282
  petal_length    150  3.7580  1.7653  1.0  1.6  4.35  5.1  6.9   -0.2749   -1.4021
  petal_width     150  1.1993  0.7622  0.1  0.3  1.30  1.8  2.5   -0.1030   -1.3406

                Summary Statistics for Categorical features (1)
                -----------------------------------------------
                    count unique     top freq relative freq
            species   150      3  setosa   50        33.33%


                        Pearson's Correlation (Top 20)
                        ------------------------------
      petal_length & petal_width -> very strong positive correlation (0.96)
     sepal_length & petal_length -> very strong positive correlation (0.87)
      sepal_length & petal_width -> very strong positive correlation (0.82)
      sepal_width & petal_length -> moderate negative correlation (-0.43)
       sepal_width & petal_width -> weak negative correlation (-0.37)
      sepal_length & sepal_width -> very weak negative correlation (-0.12)

Check out the documentation for more features and details.

eda-report's People

Contributors

dependabot[bot] avatar tim-abwao avatar

Stargazers

 avatar  avatar  avatar  avatar  avatar  avatar  avatar  avatar  avatar

Watchers

 avatar  avatar  avatar

eda-report's Issues

Use StringDtype for string & mixed data

When data has both string and numeric values, the default object dtype keeps them as such, and breaks functions such as Series.sort_values() which is used in the univariate module.

The StringDtype is more appropriate. See Working with text data.

>>> import pandas as pd
>>> s = pd.Series(["b", 2, "a", 1)
>>> s.sort_values()
Traceback (most recent call last):
  File "<stdin>", line 1, in <module>
...
TypeError: '<' not supported between instances of 'str' and 'int'
>>> s2 = pd.Series(["b", 2, "a", 1], dtype="string")
>>> s2.sort_values()
3    1
1    2
2    a
0    b
dtype: string

Error if column completely empty

If a column in the data has no values at all, a ValueError: min() arg is an empty sequence is raised.

The program then terminates in the cli, but the GUI freezes.

Recommend Projects

  • React photo React

    A declarative, efficient, and flexible JavaScript library for building user interfaces.

  • Vue.js photo Vue.js

    🖖 Vue.js is a progressive, incrementally-adoptable JavaScript framework for building UI on the web.

  • Typescript photo Typescript

    TypeScript is a superset of JavaScript that compiles to clean JavaScript output.

  • TensorFlow photo TensorFlow

    An Open Source Machine Learning Framework for Everyone

  • Django photo Django

    The Web framework for perfectionists with deadlines.

  • D3 photo D3

    Bring data to life with SVG, Canvas and HTML. 📊📈🎉

Recommend Topics

  • javascript

    JavaScript (JS) is a lightweight interpreted programming language with first-class functions.

  • web

    Some thing interesting about web. New door for the world.

  • server

    A server is a program made to process requests and deliver data to clients.

  • Machine learning

    Machine learning is a way of modeling and interpreting data that allows a piece of software to respond intelligently.

  • Game

    Some thing interesting about game, make everyone happy.

Recommend Org

  • Facebook photo Facebook

    We are working to build community through open source technology. NB: members must have two-factor auth.

  • Microsoft photo Microsoft

    Open source projects and samples from Microsoft.

  • Google photo Google

    Google ❤️ Open Source for everyone.

  • D3 photo D3

    Data-Driven Documents codes.