Comments (18)
 joaqo
commented on May 26, 2024
joaqo
commented on May 26, 2024
The first step would be to generate videos and check the results by looking at them. A more sophisticated solution would be to make your data compatible with https://github.com/tryolabs/norfair/tree/master/demos/motmetrics4norfair and get the results there.
from norfair.
 vis58
commented on May 26, 2024
vis58
commented on May 26, 2024
Hello @joaqo , do I need to have the ground truth and detection files for the video data that I have and then use the above script to check the results ? what are the files that are necessary to check the performance of norfair on my dataset ? could you please elaborate in detail
from norfair.
joaqo
commented on May 26, 2024
Hi @vis58 , that is exactly it. You need detections and labels. Regarding the format, you just need to format your data in the same way that MOTChallenge people do. The easiest way to see this is to download the detections and labels on their 2017 datasets as is detailed in the link I provided above. Here is the relevant command though:
curl -O https://motchallenge.net/data/MOT17Labels.zip  # To download Detections + Ground Truth (9.7 MB)
unzip MOT17Labels.zip
from norfair.
vis58
commented on May 26, 2024
Hello @joaqo , below is the example of how gt file looks from MOT challenge dataset. There are in total 9 values, The values are 1.frame, 2.id, 3.<bb_left>, 4.<bb_top>, 5.<bb_width>, 6.<bb_height> , what are 7th, 8th and 9th values ?

from norfair.
joaqo
commented on May 26, 2024
I think @aguscas can help you with this, as he was in charge of writing the parsing for these files. Agus, any idea on what these values mean?
from norfair.
 aguscas
commented on May 26, 2024
aguscas
commented on May 26, 2024
Hello @vis58, the 7th value is a confidence score (it can only be 0 or 1). A value of 0 as you have, means that the instance will be ignored in the evaluation (i.e. the object is marked as inactive), so it will neither count as a true positive, nor a false negative (for example, you may want this if the object corresponds to a reflection). If you want to set that particular instance as active (so that you take it into account), this value should be set as 1.
The 8th value is there to indicate the class of the object annotated. You can find a table with the corresponding value to each class in the following paper: https://arxiv.org/pdf/1906.04567.pdf
The 9th value is the visibility ratio of the bounding box (your box may be occluded by other object, or it might be cropped by the frame boundary).
from norfair.
vis58
commented on May 26, 2024
thankyou @aguscas , I have a couple of doubts regarding the script that helps in evaluating norfair on the MOT challenge dataset. They are ,
-
If I run the script like this "!python motmetrics4norfair.py --save_pred train" multiple text files are generated where it contains information about the predictions of each different MOT challenge dataset in the train folder, right ? So my question is how these predictions are generated ? is it a new prediction made by norfair? if yes, then how these predictions are generated as we only have 'gt' and 'det' files present in each folder?
-
if I run the script like this " !python motmetrics4norfair.py --save_metrics", what is happening here ? it is comparing the "gt" and "det" files and generating results for each folder? if yes, then what is the involvement of norfair in this as we already have a "det: file available?
from norfair.
aguscas
commented on May 26, 2024
Right, when using --save_pred you will save your predictions in multiple text files (one text file for each sequence). The predictions are made by a norfair tracker, using the detections provided by the challenge (the det.txt files). The gt.txt files are only used to compute the metrics (after all predictions were generated). These predictions are stored in the format described in https://motchallenge.net/instructions/ . As we are only doing 2D tracking, the last 4 columns are all set to -1.
When using --save_metrics, it will save a text file with the results of the metrics obtained by comparing your predictions with the ground truth files. It is not comparing the 'gt' with the 'det' files, instead, it is comparing the predictions (produced by norfair using the 'det' files) with the 'gt' files. If you don't use --save_metrics, it will compute these metrics anyway and the results will be displayed on terminal, but won't be saved in a text file.
from norfair.
vis58
commented on May 26, 2024
Thank you @aguscas, but how do I test the norfair on my own dataset because I only have the gt.txt file, which I labeled, but not the det.txt files?
from norfair.
aguscas
commented on May 26, 2024
Right now, norfair doesn't provide a direct way of doing this, but of course there is always a way :) . I will assume you already have a detector and that you also have a python script inwhich you are creating your predictions with a norfair tracker. Also, for each video you are processing, you should have a folder (I will call the path to this folder as input_path) inwhich you should have
/input_path/seqinfo.ini(this is a file providing basic information of the video as you can see in the MOT challenge dataset, in this case you only need a line specifying in a variableseqLengththe total number of frames in your video, for exampleseqLength=600)/input_path/gt/gt.txt(the text file with your annotations)
So, to test norfair on your dataset, you can initialize an Accumulators instance before you start processing every video (Accumulators class is defined in metrics.py, see https://github.com/tryolabs/norfair/blob/master/norfair/metrics.py). So at the beginning of your script you should have a line like accumulator = Accumulators().
After that, for each video you should do accumulator.create_accumulator(input_path) before you start iterating over the frames, where input_path is the folder containing the seqinfo.ini file that we described before. For every frame in the video, you should update the accumulator with the predictions given by norfair, as accumulator.update(predictions).
When you finish processing every video, you should tell the accumulator to compute your metrics and to display them (or save them in a file). In order to do this, you should do accumulator.compute_metrics() to compute the metrics, and then accumulator.print_metrics() to print them (or accumulator.save_metrics() if you want to save your metrics in a text file).
If you want to check it, this is the exact same way we used the Accumulators class in https://github.com/tryolabs/norfair/blob/master/demos/motmetrics4norfair/motmetrics4norfair.py
from norfair.
vis58
commented on May 26, 2024
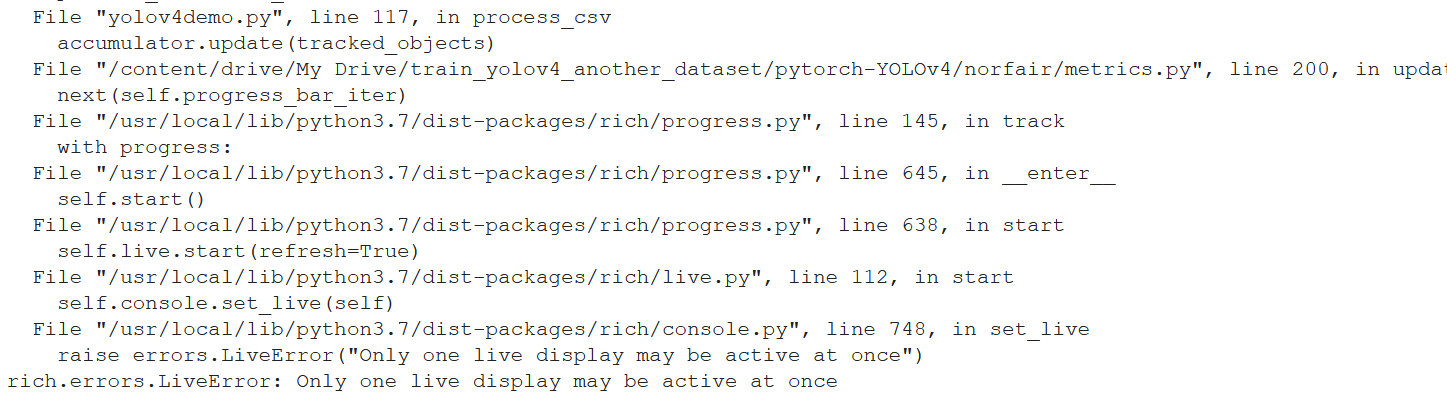
Hello @aguscas , thankyou. I am trying the same way to evaluate norfair , but I have encountered the following error when updating predictions , can you please help me with this ?

from norfair.
joaqo
commented on May 26, 2024
That seems to be an error with rich (the progress bar and general cli tool we use), it seems it can't access somewhere to print its output. It looks to be unrelated to the metrics issues being discussed here. Are you running things on a Jupyter notebook? Maybe you reached un weird unstable state in your notebook and rich is having issues with that?
from norfair.
vis58
commented on May 26, 2024
Hello @joaqo ,yes I was using jupyter notebook , but now even I tried in visual studio code and encountered the same issue. I think the line 200 in the metrics.py is triggering the error ?

from norfair.
 vishnuvardhan58
commented on May 26, 2024
vishnuvardhan58
commented on May 26, 2024
Hello @joaqo , I was able to avoid the above error, however I am encountering another error at accumulator. update() , can you please help me with this?

from norfair.
aguscas
commented on May 26, 2024
What is the format of your positions? You can see this by printing object.estimate (where object is one of your elements in your tracked_objects sequence).
The accumulator expects to get an array like this: [[bb_left, bb_top], [bb_right, bb_bottom]]
from norfair.
vishnuvardhan58
commented on May 26, 2024
Hello @aguscas , my object estimate looks like this
estimate [[1226.25415129 767.96535106]]
This is because while estimating centroid I have just taken image width and height points. This is shown below.
def get_centroid(yolo_box, img_height, img_width):
x1 = yolo_box[0] * img_width
y1 = yolo_box[1] * img_height
return np.array([x1, y1])**
now I avoid this error as well just my commenting the obj.estimate[1, 0] - obj.estimate[0, 0],
obj.estimate[1, 1] - obj.estimate[0, 1], now I am getting an another error .

from norfair.
aguscas
commented on May 26, 2024
You need 4 numbers to determine a box in a frame, it is not enough information to provide only those 2 numbers. Our Accumulators class expects that you are tracking boxes to compute your metrics. Use your object estimate in the format [[bb_left, bb_top], [bb_right, bb_bottom]] in your tracked_objects.
from norfair.
 abhigoku10
commented on May 26, 2024
abhigoku10
commented on May 26, 2024
@vishnuvardhan58 @vis58 how did u solve the error which you were facing can you please give more details ?
@dekked i am also getting same error as @vis58
from norfair.
Related Issues (20)
- To get a moving object's speed as single scalar value HOT 1
- How to start? HOT 6
- reid - how to use reid? HOT 2
- MotionEstimator with Reid HOT 2
- Reid in case of occlusion/object going out and coming back in the frame HOT 12
- error: (-28:Unknown error code -28) The input arrays should have at least 4 corresponding point sets to calculate Homography in function 'findHomography' HOT 6
- How to get object/track id and their bbox coordinates for a video? HOT 2
- Question about skip_period HOT 2
- Skipped frames on avi videos
- Suggestions to make the processing faster HOT 5
- Typing issues (example: `Detection.embedding` is `Unknown | None`)
- object ids in tracked_objects skipped a number? HOT 8
- Detection confidence when drawing tracked_objects' boxes? HOT 5
- Any tips on how to use Norfair for re-identification accross cameras HOT 1
- Ask a question about object tracking HOT 3
- Configure logging behavior? HOT 1
- The class of object being tracked changes over time HOT 3
- FixedCamera crashes with an inappropriate point array shape
- Detection age not always set
- Detection age not updated after merging tracked objects
Recommend Projects
-
 React
React
A declarative, efficient, and flexible JavaScript library for building user interfaces.
-
Vue.js
🖖 Vue.js is a progressive, incrementally-adoptable JavaScript framework for building UI on the web.
-
 Typescript
TypeScript is a superset of JavaScript that compiles to clean JavaScript output.
-
TensorFlow
An Open Source Machine Learning Framework for Everyone
-
Django
The Web framework for perfectionists with deadlines.
-
 Laravel
A PHP framework for web artisans
-
D3
Bring data to life with SVG, Canvas and HTML. 📊📈🎉
-
Recommend Topics
-
javascript
JavaScript (JS) is a lightweight interpreted programming language with first-class functions.
-
web
Some thing interesting about web. New door for the world.
-
server
A server is a program made to process requests and deliver data to clients.
-
Machine learning
Machine learning is a way of modeling and interpreting data that allows a piece of software to respond intelligently.
-
Visualization
Some thing interesting about visualization, use data art
-
Game
Some thing interesting about game, make everyone happy.
Recommend Org
-
Facebook
We are working to build community through open source technology. NB: members must have two-factor auth.
-
Microsoft
Open source projects and samples from Microsoft.
-
Google
Google ❤️ Open Source for everyone.
-
Alibaba
Alibaba Open Source for everyone
-
D3
Data-Driven Documents codes.
-
Tencent
China tencent open source team.
from norfair.