


Verbum Paper is a software that is intended to be used to facilitate the sharing of formulas, equations, and things involving mathematics.
Through it you can write your file using CSS, HTML and Javascript code. You can import external libraries written in Javascript, such as for building graphics, or for something in particular.
Via Verbum Paper you can insert graphics for functions (eg 2nd degree functions). You can also insert LaTex code mixed in with your HTML code.
You can also copy your math expressions to Clipboard. This way you can easily share your math equations with your friends 😃
If you liked this project, or if it was useful to you, please consider becoming a sponsor 💙
- Installation (Linux)
- Copying to Clipboard
- Exemple
- LaTex code
- Mathematical function graphs
- General graphics
- Highlight code
- Exporting files
- Standard libraries and References
- Author
- License
Note: This installation process is for Linux environment.
Requirements:
- git
- unzip
- wget
Enter the directory where you want to install Verbum Paper, for example:
mkdir ~/verbum-paper
cd ~/verbum-paper
Run the install script:
wget -c https://raw.githubusercontent.com/verbum-paper/verbum-paper/main/verbum-install/verbum-install.sh
chmod +x verbum-install.sh
./verbum-install.sh
Creating shortcut in the operating system (Linux), example:
sudo ln -s "$HOME/verbum-paper/shortcut.sh" /usr/bin/verbum-paperTo open Verbum Paper, enter the command:
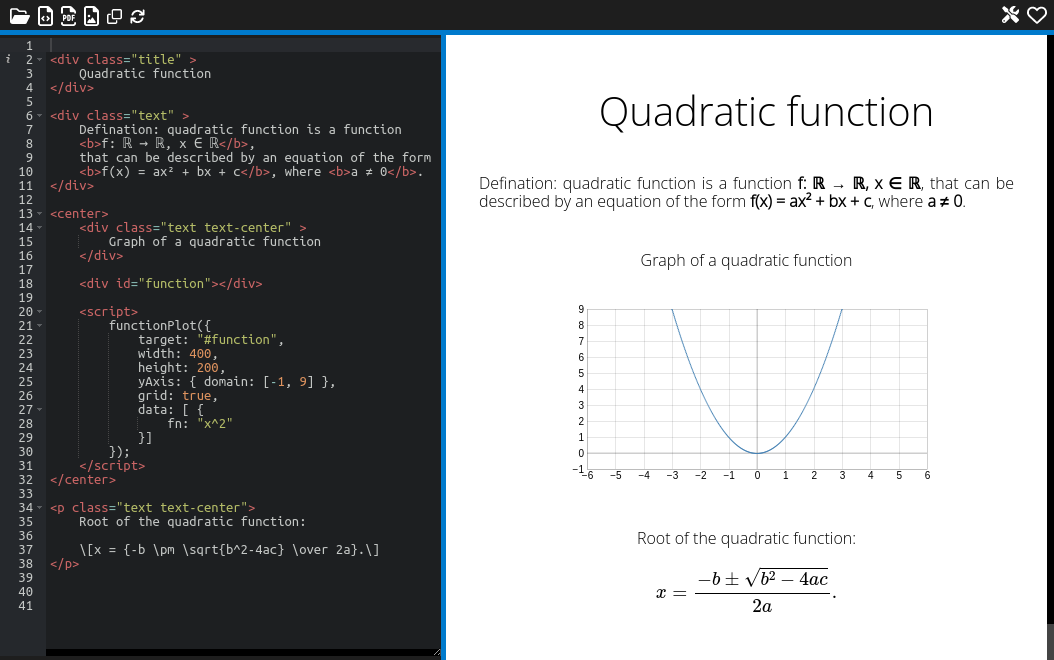
verbum-paperTo copy your document, in image form, to the Clipboard, click on the icon:
Below is a simple example, where we create a graph of a function, using the FunctionPlot library. And we make use of LaTex commands to display an equation.
<div class="title" >
Quadratic function
</div>
<div class="text" >
Defination: quadratic function is a function
<b>f: ℝ → ℝ, x ∈ ℝ</b>,
that can be described by an equation of the form
<b>f(x) = ax² + bx + c</b>, where <b>a ≠ 0</b>.
</div>
<center>
<div class="text text-center" >
Graph of a quadratic function
</div>
<div id="function"></div>
<script>
functionPlot({
target: "#function",
width: 400,
height: 200,
yAxis: { domain: [-1, 9] },
grid: true,
data: [ {
fn: "x^2"
}]
});
</script>
</center>
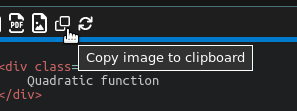
<p class="text text-center">
Root of the quadratic function:
\[x = {-b \pm \sqrt{b^2-4ac} \over 2a}.\]
</p>The view will look like this:

To insert LaTex code, you must follow the MathLive specification: https://cortexjs.io/mathlive/reference/commands/
Example to include an equation:
\[x = {-b \pm \sqrt{b^2-4ac} \over 2a}.\]This code produces this view:
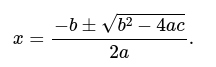
To create graphs of quadratic functions, the Function Plot library is used. Exemple:
<div id="function"></div>functionPlot({
target: "#function",
width: 400,
height: 200,
yAxis: { domain: [-1, 9] },
grid: true,
data: [ {
fn: "x^2"
}]
});The code above will produce this view:
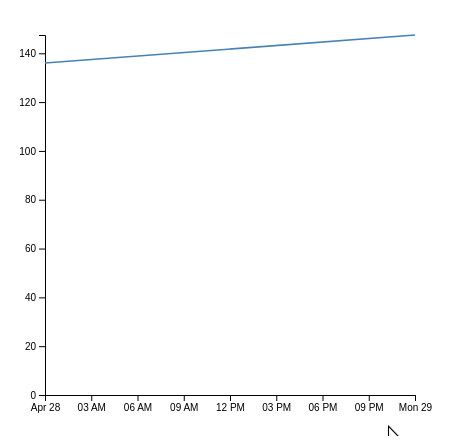
To produce graphics for different applications, it is recommended to use the D3 library. Below is an example using the D3 library:
<div id="d3-graph"></div>// Format JSON data.
var json_data = `
[
{ "date":"2013-04-28", "value":"135.98" },
{ "date":"2013-04-29", "value":"147.49" }
]
`;
// set the dimensions and margins of the graph
const margin = {top: 10, right: 30, bottom: 30, left: 60},
width = 460 - margin.left - margin.right,
height = 400 - margin.top - margin.bottom;
// append the svg object to the body of the page
const svg = d3.select("#d3-graph")
.append("svg")
.attr("width", width + margin.left + margin.right)
.attr("height", height + margin.top + margin.bottom)
.append("g")
.attr("transform", `translate(${margin.left},${margin.top})`);
json_data = JSON.parse(json_data);
for (var a=0; a<json_data.length; a++) {
json_data[a].date = d3.timeParse("%Y-%m-%d")(json_data[a].date);
}
// Add X axis --> it is a date format
const x = d3.scaleTime()
.domain(d3.extent(json_data, function(d) { return d.date; }))
.range([ 0, width ]);
svg.append("g")
.attr("transform", `translate(0, ${height})`)
.call(d3.axisBottom(x));
// Add Y axis
const y = d3.scaleLinear()
.domain([0, d3.max(json_data, function(d) { return +d.value; })])
.range([ height, 0 ]);
svg.append("g")
.call(d3.axisLeft(y));
// Add the line
svg.append("path")
.datum(json_data)
.attr("fill", "none")
.attr("stroke", "steelblue")
.attr("stroke-width", 1.5)
.attr("d", d3.line()
.x(function(d) { return x(d.date) })
.y(function(d) { return y(d.value) })
)The code above will produce this view:
You can also use the Chart.js library to create charts. Exemple:
<canvas id="chart-example" style="width:400px"></canvas>var xValues = [50,60,70,80,90,100,110,120,130,140,150];
var yValues = [7, 8, 8, 9, 9, 9, 10, 11, 14, 14, 15 ];
new Chart("chart-example", {
type: "line",
data: {
labels: xValues,
datasets: [{
fill: false,
lineTension: 0,
backgroundColor: "rgba(0,0,255,1.0)",
borderColor: "rgba(0,0,255,0.1)",
data: yValues
}]
},
options: {
legend: {display: false},
scales: {
yAxes: [{ticks: {min: 6, max:16}}],
}
}
});Graph view:

To highlight code, it is recommended to use the Highlight.js library.
<pre><code class="language-javascript">functionPlot({
    target: "#function",
    width: 400,
    height: 200,
    yAxis: { domain: [-1, 9] },
    grid: true,
    data: [ {
        fn: "x^2"
    }]
});</code></pre>To export your file to the formats: HTML, PNG and PDF; click on their respective icons.

For use of LaTex commands, styling, and related details, go to the MathLive reference.
Support: Math and Text mode, Fractions and Binomials, Binary Operators, Functions, Bounds, Projections, Modulo, Unicode, Large Operators, Logic, Arrows, Accents, Relational Operators, Negated Relational Operators, Sets, Relational Set Operators, Greek, Hebrew, Letterlike Symbols, Delimiters, Punctuation, Spacing, Decorations, Notations, Colors, Font Styling, MathJax HTML Extension, Sizing, Various, MediaWiki, Physics, Chemistry, Macros, Environments / Matrixes, TeX Registers, TeX Primitives.
Link: https://cortexjs.io/mathlive/reference/commands/
To visualize quadratic functions you can use the Function Plot library.
Support: Plotting a curve, Additional options, Grid, Domain, Number of samples, Annotations, Range and closed path, Logarithmic scales, Multiple graphs, Graph types, Tip, nth-root, Secants, Derivative, Linked graphs, Update, Function continuity, Circle, Parametric equations, Polar equations, Implicit functions, Points and polylines, Vectors, Advanced, Recipes.
Link: https://mauriciopoppe.github.io/function-plot/
D3.js is a JavaScript library for manipulating documents based on data.
Link: https://observablehq.com/@d3/gallery
Simple yet flexible JavaScript charting for designers & developers.
Link: https://www.chartjs.org/docs/latest/samples/information.html
Syntax highlighting librarie.
Link: https://highlightjs.org/usage/
Sponsor: melchisedech333
Twitter: Melchisedech333
LinkedIn: Melchisedech Rex
Blog: melchisedech333.github.io

BSD-3-Clause license © Verbum Paper