GithubHelp home page GithubHelp logo

5hmla / jgraph Goto Github PK

View Code? Open in Web Editor NEW
1.3K 50.0 203.0 11.51 MB

:fire: 一个视觉效果还不错的图表控件(停止维护了,不建议直接用到项目)

Java 100.00%
chart animations customview

jgraph's Introduction

Star History

Star History Chart

Jgraph

License

  1. Gradle
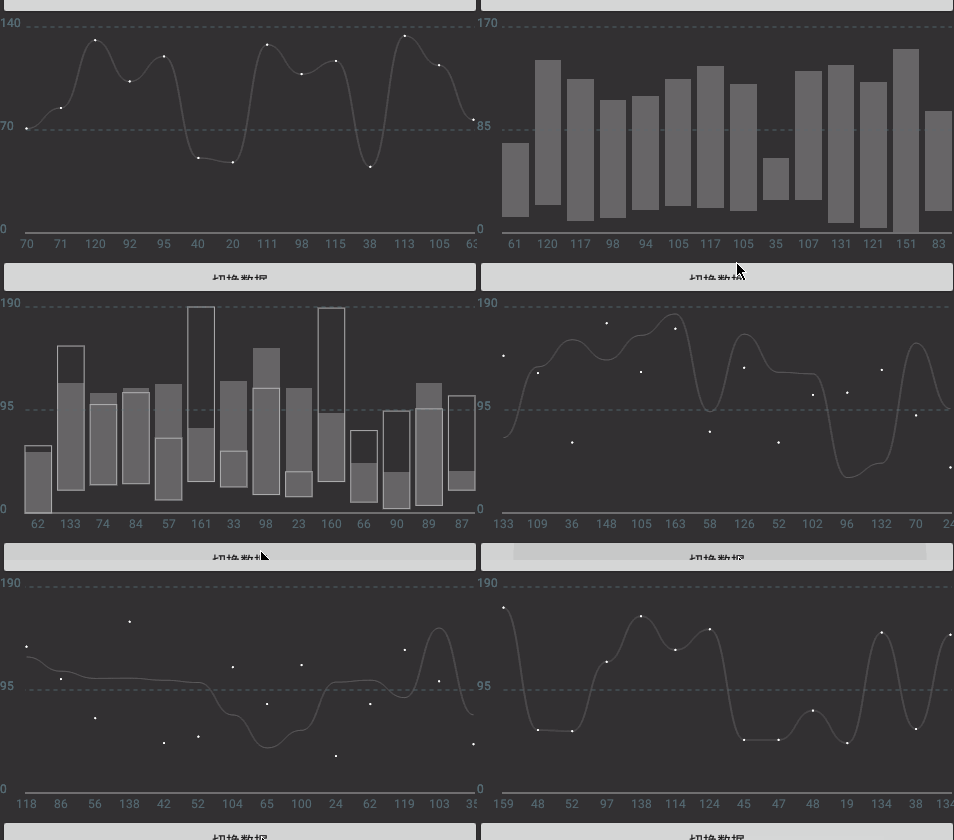
  2. Demo
  3. Use Guide
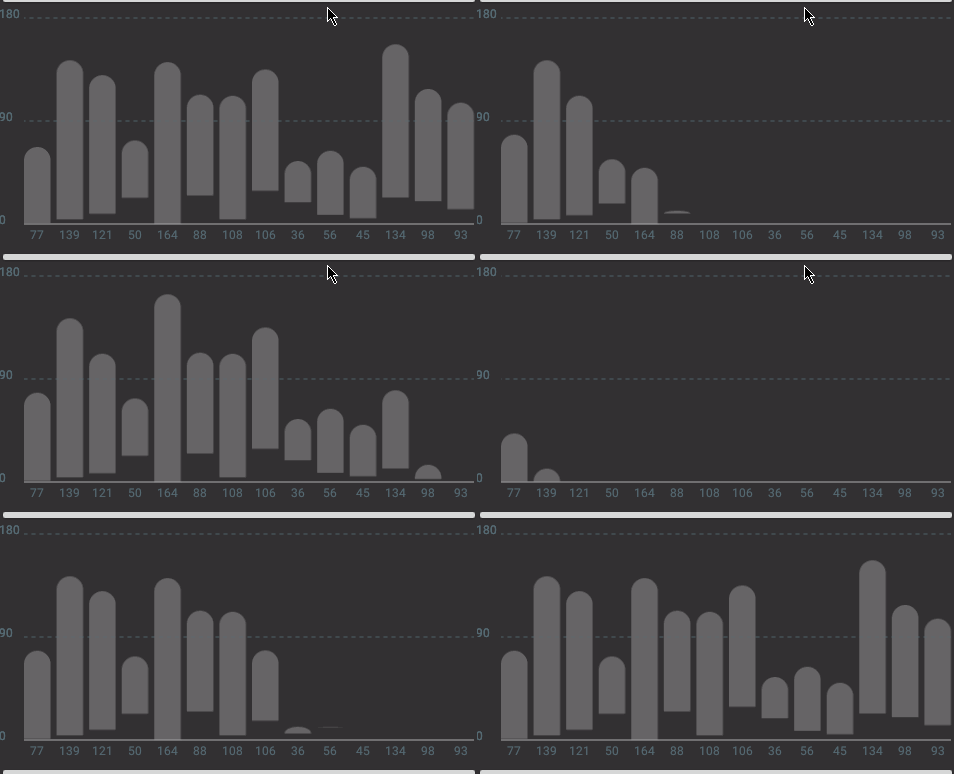
    1. 图表风格
    2. 滚动
    3. 纵轴
    4. 柱-动画
    5. 柱-颜色
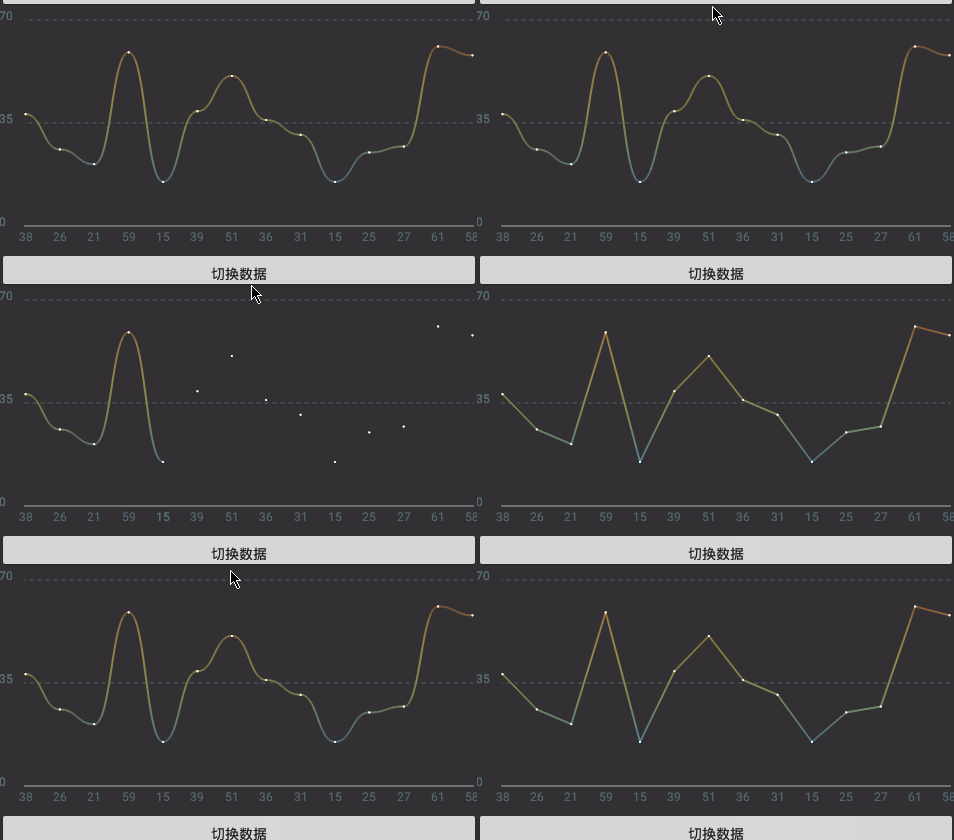
    6. 线-动画
    7. 线-风格
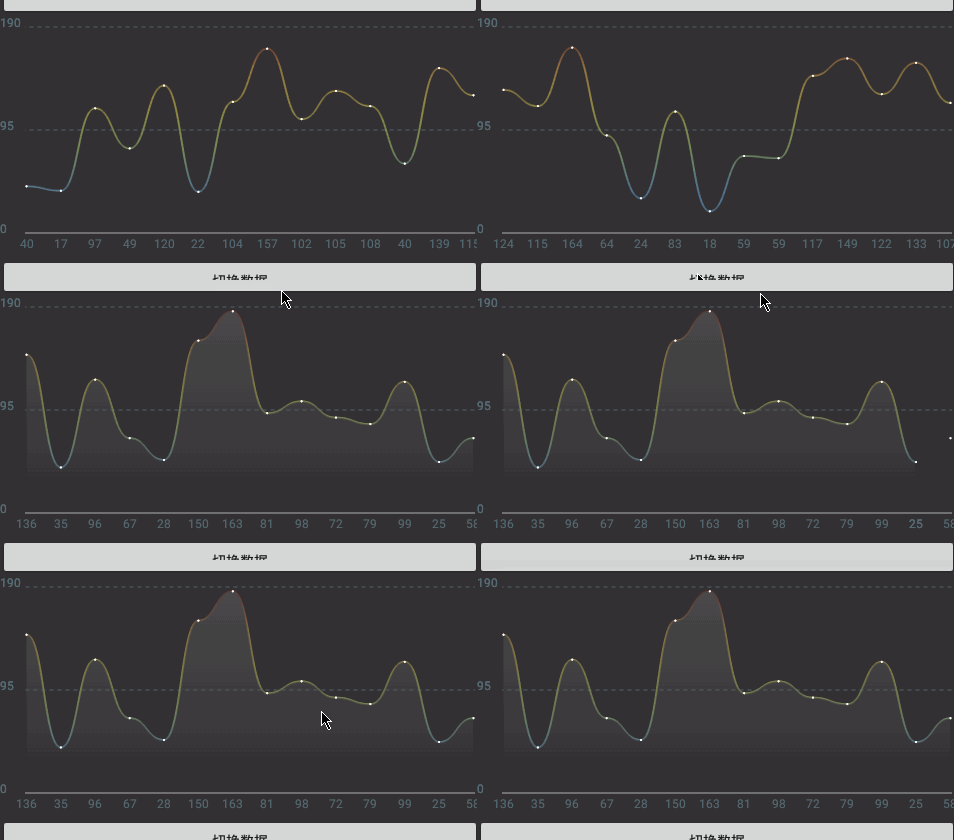
    8. 线-断0
    9. 线-颜色
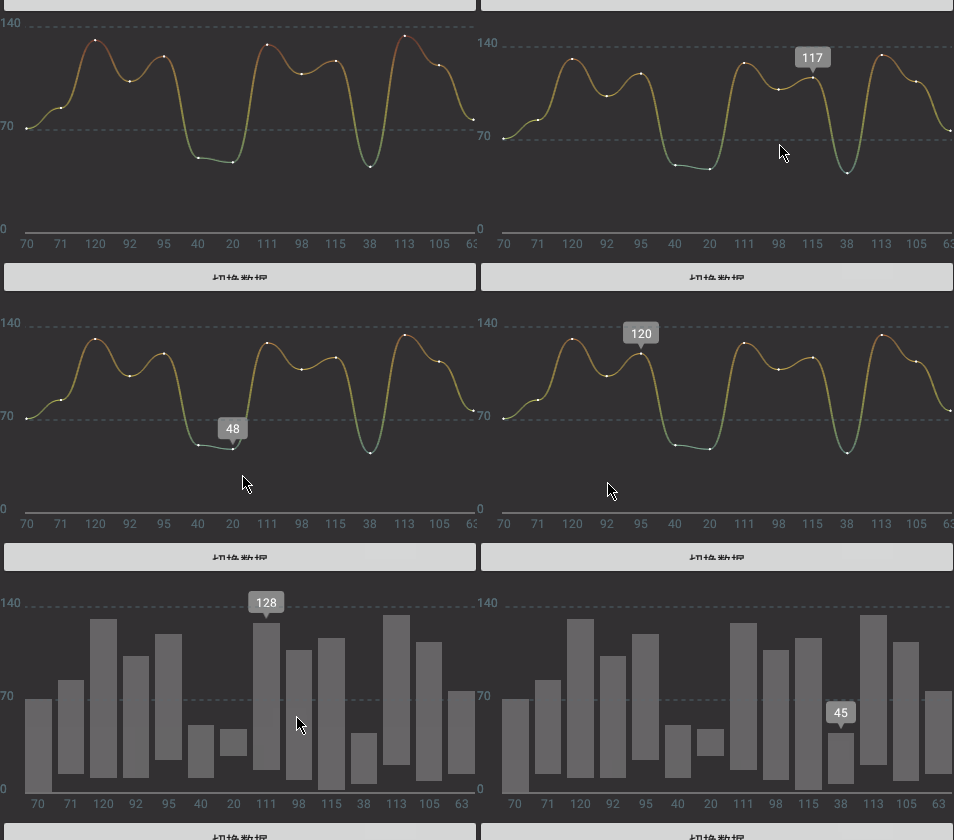
    10. 选中
    11. 切换数据
  4. Versions
  5. Todo
  6. License

#Gradle

allprojects {
        repositories {
		...
		maven { url "https://jitpack.io" }
	}
}
dependencies {
    compile 'com.github.mychoices:Jgraph:v1.2'
}

#DEMO

demo下载地址

#User Guide

###自定义属性

<attr name="graphstyle" format="enum">
    <enum name="bar" value="0"/>
    <enum name="line" value="1"/>
</attr>
<attr name="scrollable" format="boolean"/>  
<attr name="visiblenums" format="integer"/>
<attr name="showymsg" format="boolean"/>
<attr name="normolcolor" format="color"/>
<attr name="activationcolor" format="color"/>
<attr name="linestyle" format="enum">
    <!--折线-->
    <enum name="broken" value="0"/>
    <!--曲线-->
    <enum name="curve" value="1"/>
</attr>
<attr name="linemode" format="enum">
    <!--链接每一个点-->
    <enum name="everypoint" value="1"/>
    <!--跳过0的点-->
    <enum name="jump0" value="2"/>
    <!--跳过的0点用虚线链接-->
    <enum name="dash0" value="3"/>
</attr>
<attr name="linewidth" format="dimension"/>
<attr name="lineshowstyle" format="enum">
    <enum name="drawing" value="0"/>
    <enum name="section" value="1"/>
    <enum name="fromline" value="2"/>
    <enum name="fromcorner" value="3"/>
    <enum name="aswave" value="4"/>
</attr>

GraphStyle

setGraphStyle(@GraphStyle int graphStyle) //柱状图 和 折线图

Scrollable

setScrollAble(boolean )

纵轴

setYaxisValues(@NonNull String... showMsg)
setYaxisValues(int max, int showYnum)
setYaxisValues(int min, int max, int showYnum)

BarShowStyle

setBarShowStyle(@BarShowStyle int barShowStyle)
/**
 * 水波 方式生长
 */
int BARSHOW_ASWAVE 
/**
 * 线条 一从直线慢慢变成折线/曲线
 */
int BARSHOW_FROMLINE 
/**
 * 柱形条 由某个往外扩散
 */
int BARSHOW_EXPAND 

/**
 * 一段一段显示
 */
int BARSHOW_SECTION 

barcolor

setNormalColor(@ColorInt int normalColor)
setPaintShaderColors(@ColorInt int... colors)

LineStyle

setLineStyle(@LineStyle int lineStyle)
/**
 * 折线
 */
int LINE_BROKEN = 0;
/**
 * 曲线
 */
int LINE_CURVE = 1;

LineShowStyle

setLineShowStyle(@LineShowStyle int lineShowStyle)

/**
 * 线条从无到有 慢慢出现
 */
int LINESHOW_DRAWING 
/**
 * 线条 一段一段显示
 */
int LINESHOW_SECTION 
/**
 * 线条 一从直线慢慢变成折线/曲线
 */
int LINESHOW_FROMLINE 

/**
 * 从左上角 放大
 */
int LINESHOW_FROMCORNER 
/**
 * 水波 方式展开
 */
int LINESHOW_ASWAVE 

LineMode

setLineMode(@LineMode int lineMode)
/**
 * 连接每一个点
 */
int LINE_EVERYPOINT 
/**
 * 跳过0  断开
 */
int LINE_JUMP0 

/**
 * 跳过0 用虚线链接
 */
int LINE_DASH_0 

linecolor

setNormalColor(@ColorInt int normalColor)
setPaintShaderColors(@ColorInt int... colors)
setShaderAreaColors(@ColorInt int... colors)

select

setSelected(int selected)
setSelectedMode(@SelectedMode int selectedMode)

datachange

aniChangeData(List<Jchart> jchartList)

Versions

Todo

Todo

License

Copyright 2016 Yun

Licensed under the Apache License, Version 2.0 (the "License");
you may not use this file except in compliance with the License.
You may obtain a copy of the License at

   http://www.apache.org/licenses/LICENSE-2.0

Unless required by applicable law or agreed to in writing, software
distributed under the License is distributed on an "AS IS" BASIS,
WITHOUT WARRANTIES OR CONDITIONS OF ANY KIND, either express or implied.
See the License for the specific language governing permissions and
limitations under the License.

jgraph's People

Contributors

5hmla avatar

Stargazers

 avatar  avatar  avatar  avatar  avatar  avatar  avatar  avatar  avatar  avatar  avatar  avatar  avatar  avatar  avatar  avatar  avatar  avatar  avatar  avatar  avatar  avatar  avatar  avatar  avatar  avatar  avatar  avatar  avatar  avatar  avatar  avatar  avatar  avatar  avatar  avatar  avatar  avatar  avatar  avatar  avatar  avatar  avatar  avatar  avatar  avatar  avatar  avatar  avatar  avatar  avatar  avatar  avatar  avatar  avatar  avatar  avatar  avatar  avatar  avatar  avatar  avatar  avatar  avatar  avatar  avatar  avatar  avatar  avatar  avatar  avatar  avatar  avatar  avatar  avatar  avatar  avatar  avatar  avatar  avatar  avatar  avatar  avatar  avatar  avatar  avatar  avatar  avatar  avatar  avatar  avatar  avatar  avatar  avatar  avatar  avatar  avatar  avatar  avatar  avatar

Watchers

 avatar  avatar  avatar  avatar  avatar  avatar  avatar  avatar  avatar  avatar  avatar  avatar  avatar  avatar  avatar  avatar  avatar  avatar  avatar  avatar  avatar  avatar  avatar  avatar  avatar  avatar  avatar  avatar  avatar  avatar  avatar  avatar  avatar  avatar  avatar  avatar  avatar  avatar  avatar  avatar  avatar  avatar  avatar  avatar  avatar  avatar  avatar  avatar  avatar  avatar

jgraph's Issues

Error:Could not find com.github.mychoices:Jgraph:v1.2

Error:Could not find com.github.mychoices:Jgraph:v1.2.
Required by:
    project :app
<a href="searchInBuildFiles">Search in build.gradle files</a>

jitpack.io has already added.

com.github.mychoices:Jgraph:1.2 can't find too.

多数据

这个库是不是还不能支持多数据啊?

Code Error

I downlad the resource code of the app,The file name of "DragHelper" is mistaken with "draghelper",And there is missing a file of "DebugConfig."

[Help wanted] Features JcoolGraph draw two lines

Hi !

First of all, awesome work 😀 and thanks for the sharing even if it's in chinese it's well coded and I learned many things ! Thanks again.
I'm curently trying to draw 2 lines on the same graph, and so far i realised that i need to add that features on the source code.

My idea was to do exactly the same process of the line creation and ré-execute it with a new feedDate. But it's break everything on the drawLine().

Maybe i'm using the wrong object, maybe i should focus on the MultiGraph objects.

Any sugestions ?

API <=19

API <=19 支持么? Demo_apk 不能安装

setXnums() not works correctly.

Hi,
I try setXnums(24, 1) for (JcoolGraph), but not works correctly.
I see only first digits on begin, and last digit (24) on end.
I need to plot the time interval in hours on the X axis (from 0 to 24).

Help me please!

Recommend Projects

  • React photo React

    A declarative, efficient, and flexible JavaScript library for building user interfaces.

  • Vue.js photo Vue.js

    🖖 Vue.js is a progressive, incrementally-adoptable JavaScript framework for building UI on the web.

  • Typescript photo Typescript

    TypeScript is a superset of JavaScript that compiles to clean JavaScript output.

  • TensorFlow photo TensorFlow

    An Open Source Machine Learning Framework for Everyone

  • Django photo Django

    The Web framework for perfectionists with deadlines.

  • D3 photo D3

    Bring data to life with SVG, Canvas and HTML. 📊📈🎉

Recommend Topics

  • javascript

    JavaScript (JS) is a lightweight interpreted programming language with first-class functions.

  • web

    Some thing interesting about web. New door for the world.

  • server

    A server is a program made to process requests and deliver data to clients.

  • Machine learning

    Machine learning is a way of modeling and interpreting data that allows a piece of software to respond intelligently.

  • Game

    Some thing interesting about game, make everyone happy.

Recommend Org

  • Facebook photo Facebook

    We are working to build community through open source technology. NB: members must have two-factor auth.

  • Microsoft photo Microsoft

    Open source projects and samples from Microsoft.

  • Google photo Google

    Google ❤️ Open Source for everyone.

  • D3 photo D3

    Data-Driven Documents codes.