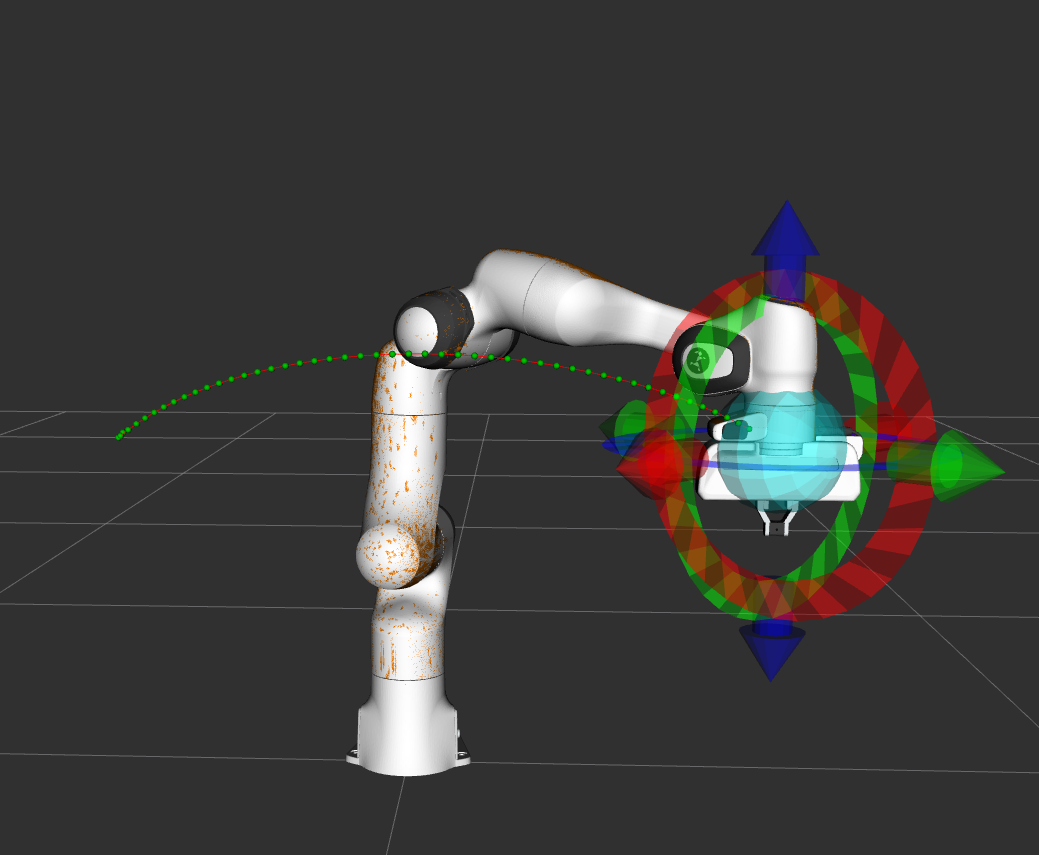
REMARK: This node should run properly with the adapted moveit branch on my repository on github (melodic_devel_vis_states). I adapted moveit, to be able to store the motion plan request data (edges and vertices) and visualize them in rviz through a separate node. Within RVIZ the MarkerArray needs to subscribe to the /rviz_visual_tools topic. The red dots represents the sampled states visualized at the specified link (LINK_NAME_VIS), the red lines specify the edges.
Code information:
- I added the storing capabilities in model_based_planning_context.cpp within the postSolve() function
- The function to visualize the data is declared in the ompl_planner_manager.cpp: void visualizeSampledStates(const planning_scene::PlanningSceneConstPtr& planning_scene, const std::string& PLANNING_GROUP, const std::string& LINK_NAME,const std::string& REFERENCE_FRAME,const std::string& state_space_model,const char *filename_to_load)
IMPORTANT: the OMPL data is only properly stored if no parallel plan is used, ony if the PlanningAttempts=1 is set, you can visualize the data This node can be launched with "roslaunch moveit_visualize_data sampling_data_analysis.launch" and everytime "next" is pressed in the RvizVisualToolsGui the last stored planner data is visualized.
Example of sampled states and edges for the RRTConnect: