A MATLAB & Psychtoolbox based application, displaying a grid of squares for a visual stimulus based EEG/fMRI study.
- Get the Psychtoolbox MATLAB code from here and follow the install instructions.
- Then download and install Git to obtain this project code.
- Clone the Git repository (i.e. code) with the shell command:
git clone https://github.com/Muxelmann/CatEEGfMRIStudy - If you already cloned the project and want to update its code, change the directory into
CatEEGfMRIStudy(i.e.cd CatEEGfMRIStudy) and executegit pull.
The run.m file contains sample code to run through a block of trials.
The CatStudy Class is used and it provides all the functionality to interface with Psychtoolbox and draw all squares etc.
Every single file is commented and should be very self-explanatory.
- Write the EEG interface to send time signals to EEG computer over some COM/Serial/Parallel port
- Write finite state machine (FSM) to keep track of the trial progress for the EEG interface
- Upgrade the difficulty mechanism to instead of basing it on the past N trials (i.e. moving average)
- Send mark instructions via the EEG interface whilst conducting pilot trials
Rather than using buttons for the four quadrants to answer where the colour change was perceived, use a joystick. Apparently to obtain the joystick input use:
[x, y, z, buttons] = WinJoystickMex(0);
But we will investigate that after consolidating with the project's leading neuroscientist / psychologist.
This project has been developed in MATLAB (version 2016a on Windows 10 64bit). The root folder of the project is organised as follows:
| File | Dir? | Description |
|---|---|---|
| Readme.md | N | This readme file containing all information to get started. |
| @CatStudy | Y | MATLAB class folder containing the entire study's code to present the visual stimuli. The class is called CatStudy and consists of several files that are all stored within this directory. |
| CatEEGInterface.m | N | MATLAB class that (soon) provides an interface to sent notifications to an EEG computer so that the recording is time-stamped / time-marked. This class is used within CatStudy. |
| run.m | N | A sample MATLAB code, demonstrating how to use the CatStudy class. This code runs through a single study, consisting of several blocks where each block contains several consecutive trials. |
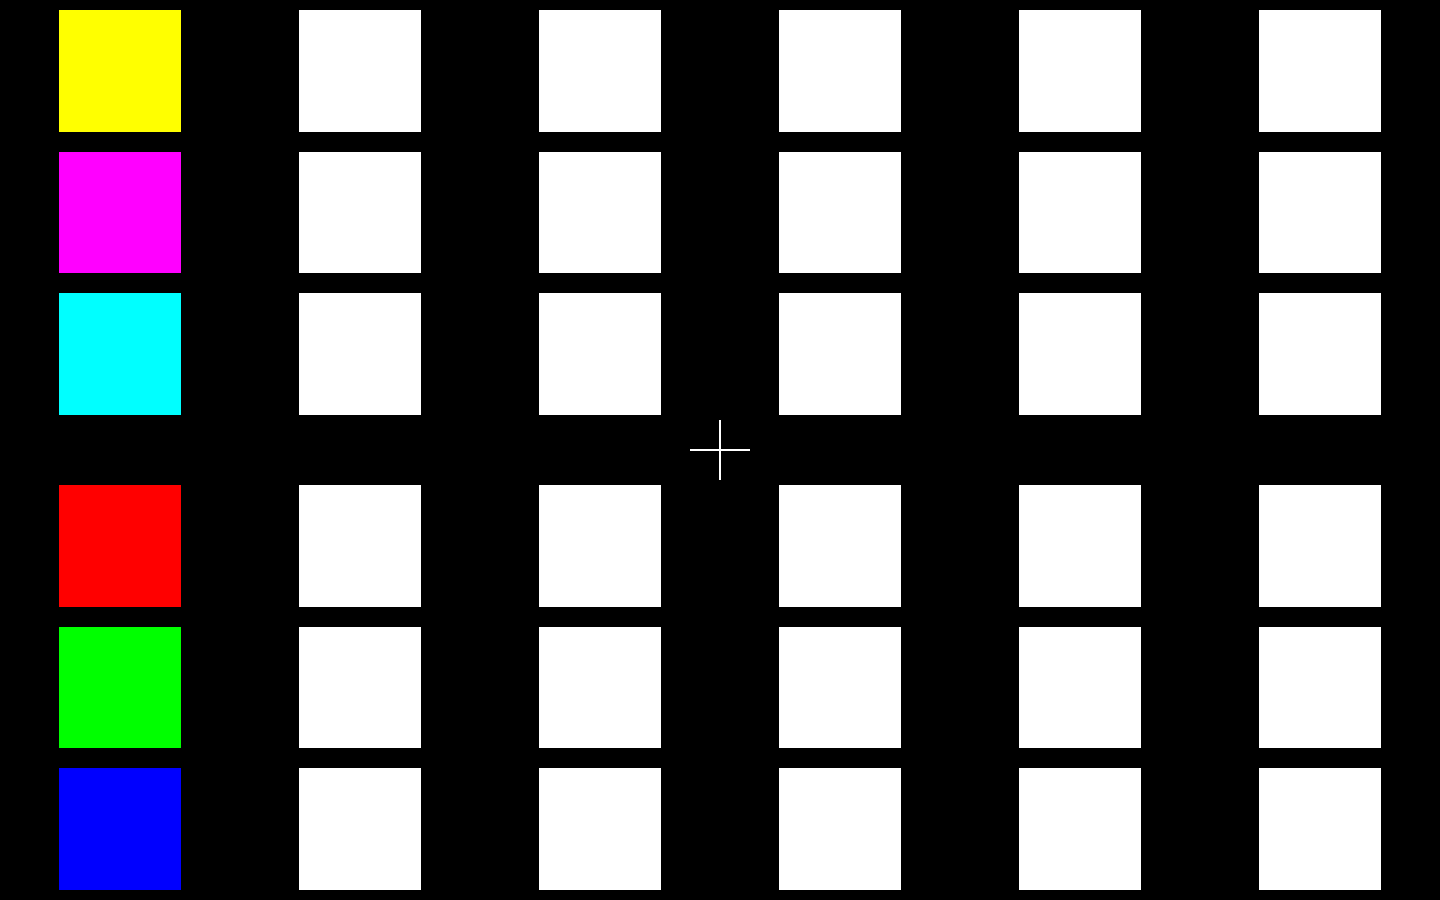
Upon launch, the code will, by default, generate a 6x6 grid of squares that can be coloured in yellow, magenta, cyan, red, green, blue or white. These colours are binary combinations of the RGB colour values. Additionally, the vertical and horizontal space between each quadrant of the screen can be manually adjusted. This was done to give the subject a better indication of up and down as well as left and right. The test grid should look like so:
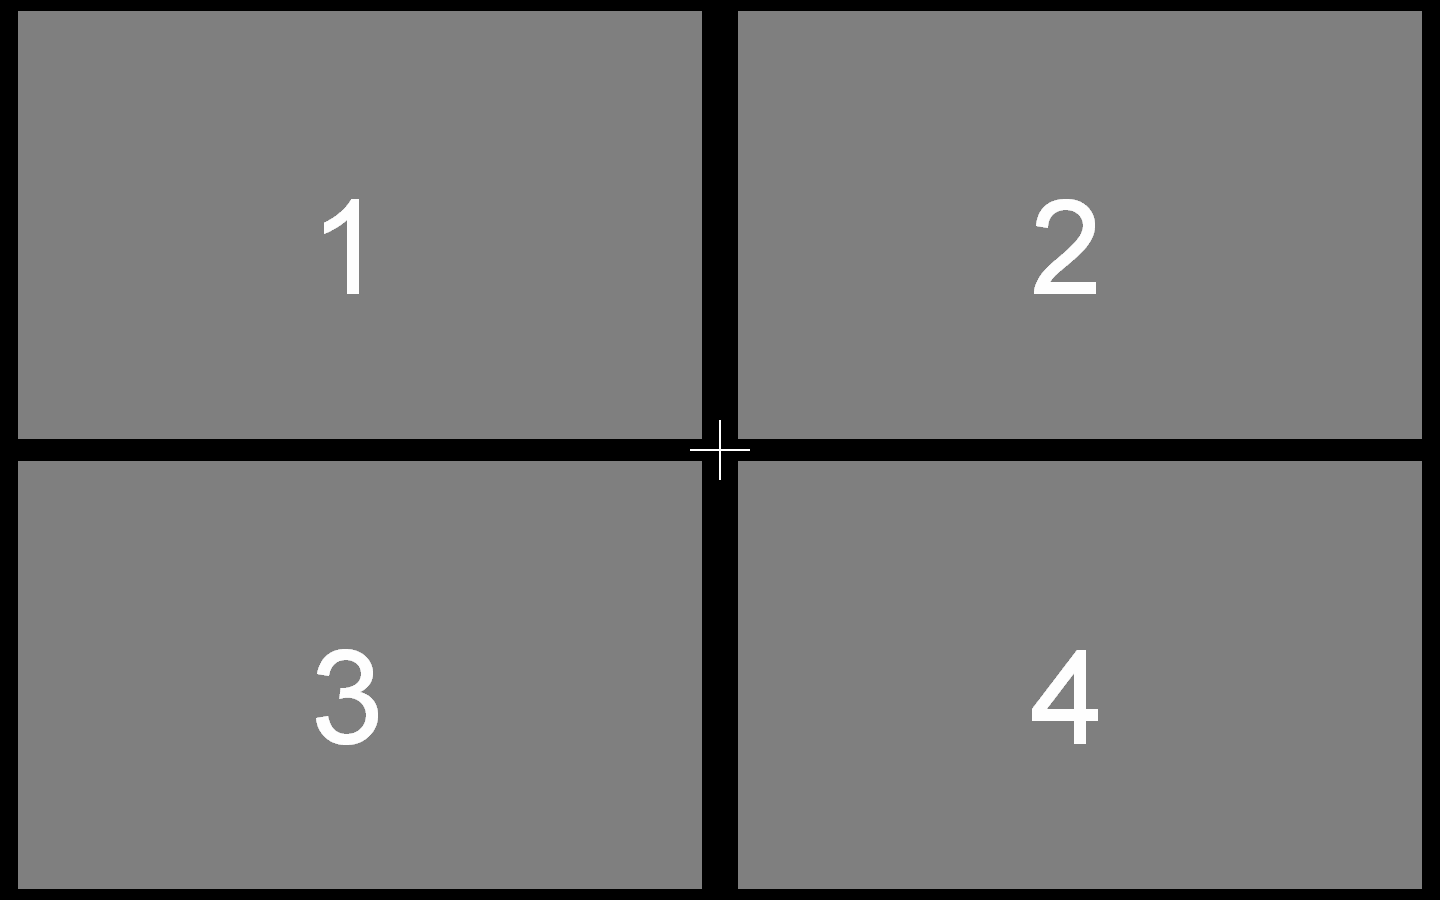
Then the answering rectangles are displayed. Each one covers one quarter of the screen over which a change might have occurred. The numbering of these rectangles has not been finalised (as they need to match the input), but they align and display correctly.
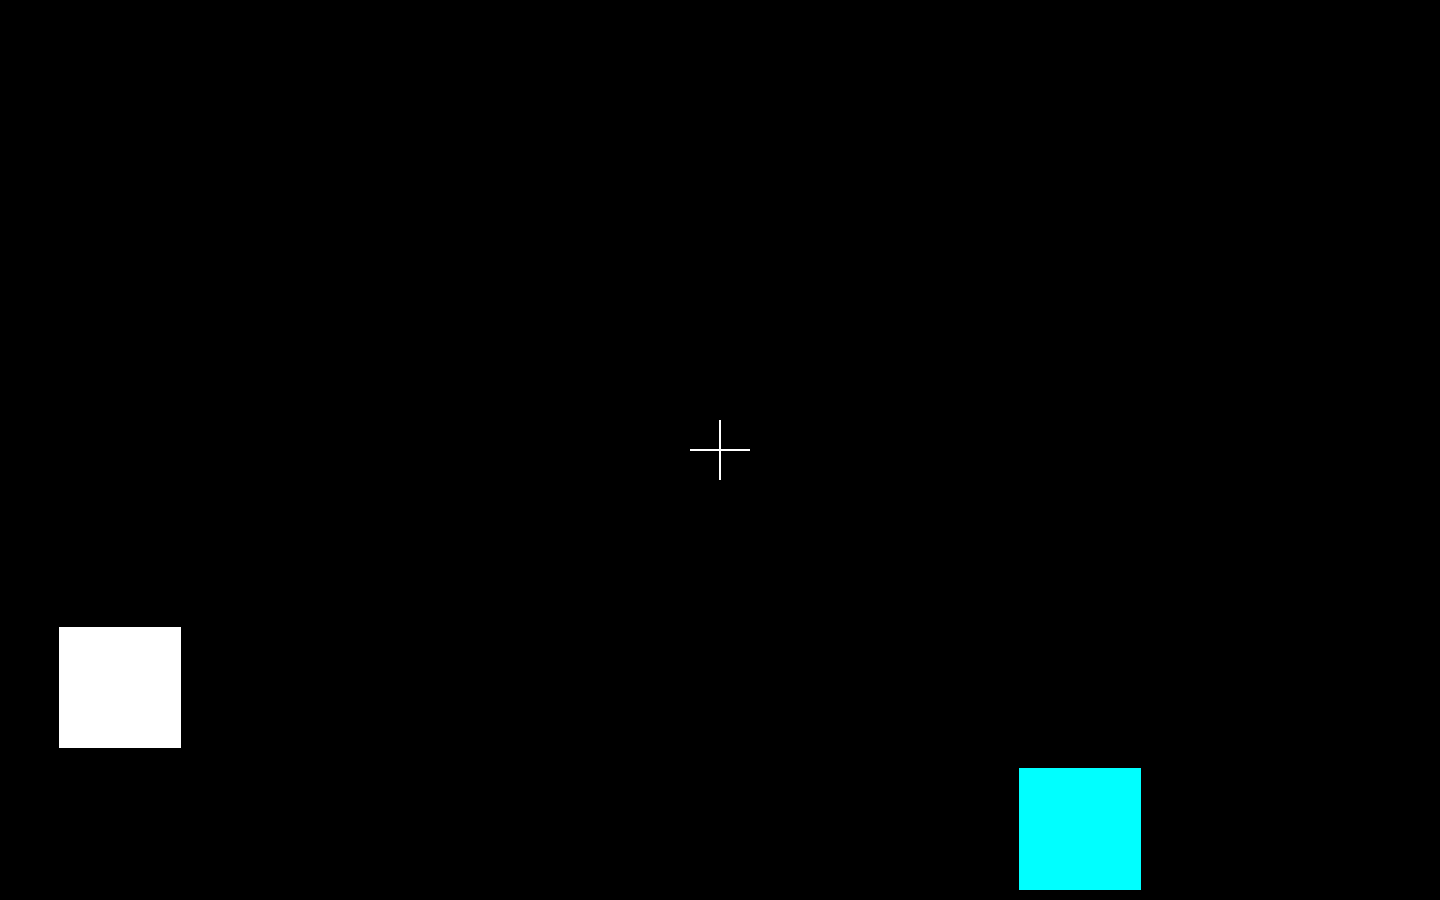
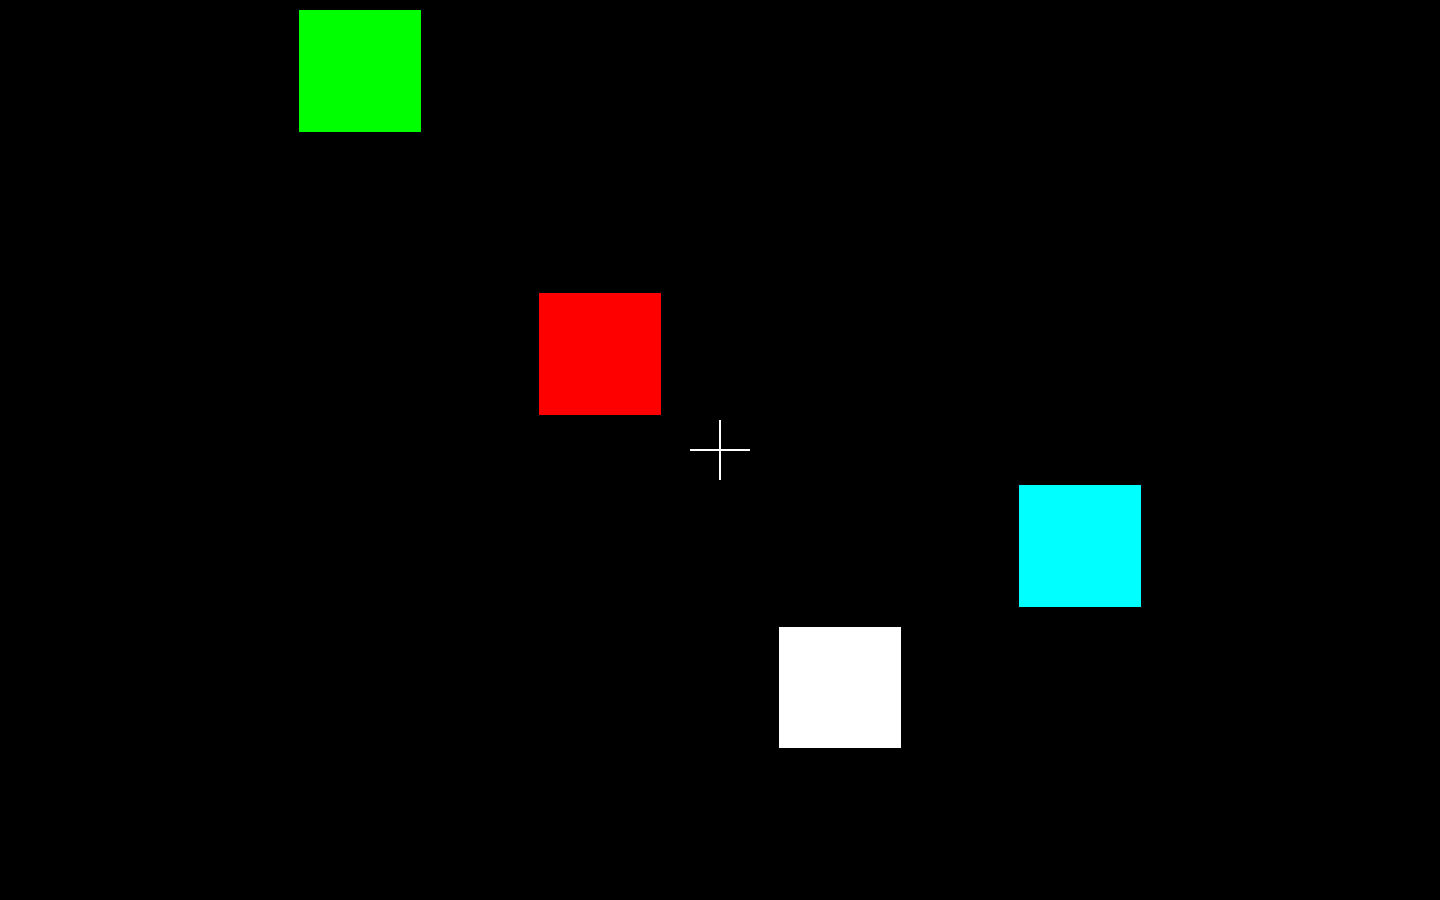
After this alignment test, the trial starts, where n*2 squares are displayed. There is an equal number of squares to the left and right half of the screen. One square may or may not change colour and the subject has to identify where this square was, if it did change colour. Initially there are only two squares in total (i.e. n=1), but as the subject localises the colour change (or no change) correctly, n is incremented until a balance between right and wrong answers is reached. This procedure is called a "trial" and consists of:
- Trial Onset: The first fixation mark is displayed and EEG is notified the trial started. The duration of this display is within a predefined random range.
- Memory Array: The first set of squares is displayed and the EEG is notified that the squares that need to be memorised have shown up. This stimulus is only presented for a short period of time.
- Retention Interval: An empty screen with a fixation cross is displayed, and replaces the Memory Array. The EEG computer is also notified of this event.
- Test Array: The second set of squares, where all squares are in the same location is displayed. One square may have changed colour. The appearance of the Test Array is also transmitted to the EEG computer.
After each trial, the subject is asked to answer a set of questions to determine whether there was a change, where the change was, and how certain the subject is with his/her answers. Correspondingly, the instance the subject presses an answer button, the EEG computer is notified of the corresponding answer, to mark this decision making in the recorded data.
At the end of a trial, the user can save the trial's information which results in a subject_name.csv and subject_name.mat file to be created. These files contain identical data, yet one may be easier to use than the other during later analysis.
Each file contains a table with the following information:
- Index of the square that changed or zero (0) if there was no change
- Whether the subject saw a change (1 = yes, 2 = no)
- How certain the subject is with the observed change (1-4)
- Which quadrant the subject saw a change in (1-4)
- How certain the subject is that the change occurred in that quadrant (1-4)
- Difficulty of the trial (i.e. number of squares displayed in one half of the screen) (1-18)
- Human readable quadrant of where the colour change occurred (NO, RT, RB, LT, LB)
- Human readable quadrant of where the user saw the change happen (NO, RT, RB, LT, LB)
- For retrospective analysis, the colours of the square before and after its change
If the subject answers too slow a NaN is stored in the files. This may indicate a valid error unless the subject stated that no change has been observed. In that case the he/she is not asked to locate the change and NaN is stored by default.
