GithubHelp home page GithubHelp logo

abdullahbas / datavisualization Goto Github PK

View Code? Open in Web Editor NEW
2.0 2.0 2.0 4.6 MB

Data Visualization on Python

Jupyter Notebook 100.00%
visualization python data-visualization data-visualisation data-visualization-project data-visualizations

datavisualization's Introduction

Hi guys,

I am Abdullah Baş. Today I will talk about some of the visualization techniques. But first let me start with the tradition.


Ulu çınarlar fırtınalı diyarlarda yetişir.-Cemil Meriç -"Great plane trees grow in stormy lands"


I will continue data visualization on deep learning models and medical images. Also I will publish MATLAB version of this repo soon

Let's start with the line plots. These are quite useful when trying to show the effects of something or changes among time or other streams. Nearly all of the plots are demonstrated on the iris dataset. All of the plots, codes that are shown, in the following and even more are present in this repo

Area Plot

Area plot is the one of the most using line plots.

Area Plot

Radar -Spider Plot

Actually, this plot arguably the most used plot in history. FM, FIFA, PES, and many games have been widely used in this plot. Besides all of that this is the plot that I am most familiar with-of course because of FIFA- . I am sorry academia but this plot belongs to the gamers… Sad story..

RadarPlot

Line Plot

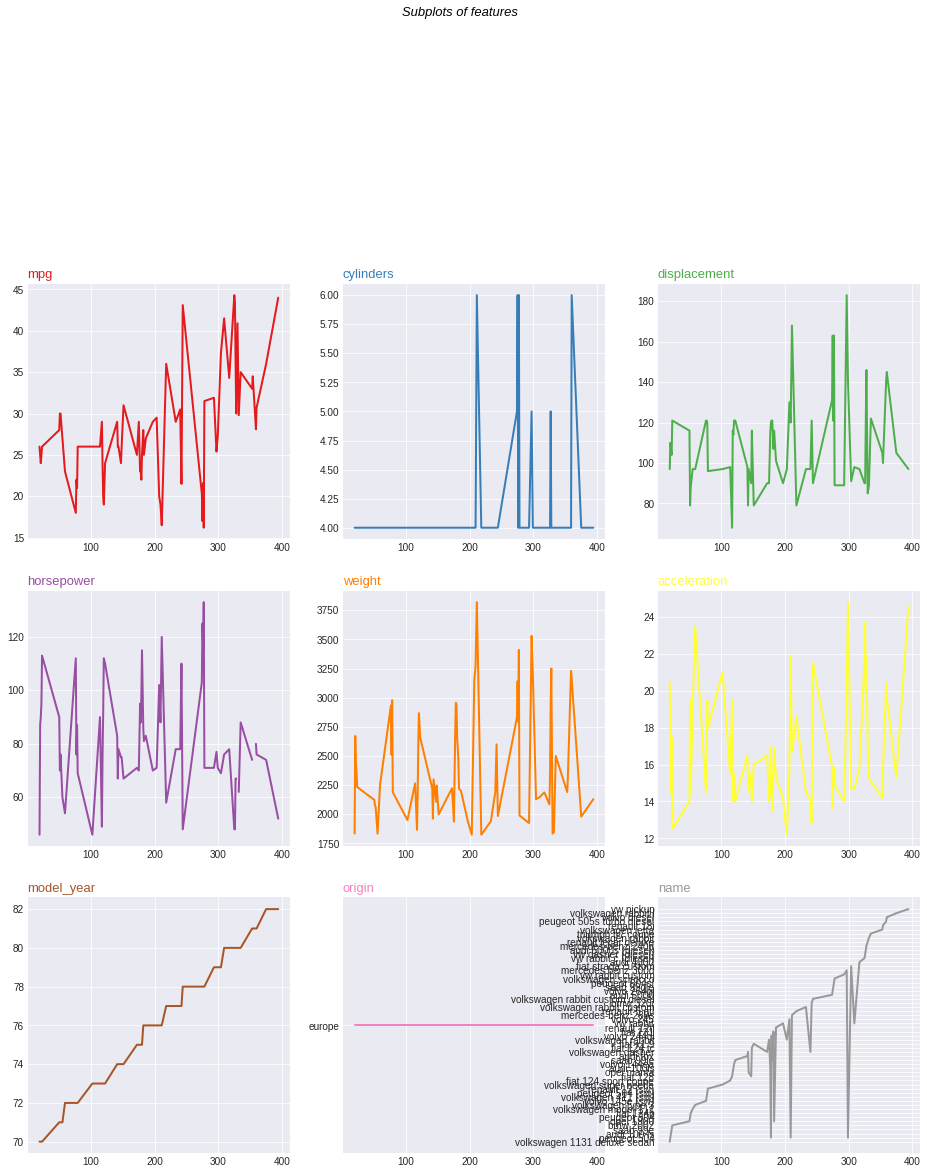
Following visualization is for demonstration of subplots Line Plot

Focused Line Plot

You can see the lines that I focus are colored but the other ones are shaded.

Focused Plot

#Violin Plot

These plots are very similar to box plots.

Violin Plot

Box Plot

These plots are very useful plots on investigation of data summary.

Box Plot

Parallel Plot

These plots are very useful while investigating sequential features like DL model hyperparameters.

Paralllel Plot

Venn Diagrams

Paralllel Plot

Regression Plot

Regression Plot

Correlation Plot

Correlation Plot

Contour-Marginal Plot

Contour Plot

I want to give credit to the documentation of matplotlib seaborn and pandas.

Also I want to give credit to the python graph gallery WormHole to Graph Gallery and also Yan Holtz Linkedin

datavisualization's People

Contributors

abdullahbas avatar imgbotapp avatar

Stargazers

 avatar  avatar

Watchers

 avatar  avatar

Recommend Projects

  • React photo React

    A declarative, efficient, and flexible JavaScript library for building user interfaces.

  • Vue.js photo Vue.js

    🖖 Vue.js is a progressive, incrementally-adoptable JavaScript framework for building UI on the web.

  • Typescript photo Typescript

    TypeScript is a superset of JavaScript that compiles to clean JavaScript output.

  • TensorFlow photo TensorFlow

    An Open Source Machine Learning Framework for Everyone

  • Django photo Django

    The Web framework for perfectionists with deadlines.

  • D3 photo D3

    Bring data to life with SVG, Canvas and HTML. 📊📈🎉

Recommend Topics

  • javascript

    JavaScript (JS) is a lightweight interpreted programming language with first-class functions.

  • web

    Some thing interesting about web. New door for the world.

  • server

    A server is a program made to process requests and deliver data to clients.

  • Machine learning

    Machine learning is a way of modeling and interpreting data that allows a piece of software to respond intelligently.

  • Game

    Some thing interesting about game, make everyone happy.

Recommend Org

  • Facebook photo Facebook

    We are working to build community through open source technology. NB: members must have two-factor auth.

  • Microsoft photo Microsoft

    Open source projects and samples from Microsoft.

  • Google photo Google

    Google ❤️ Open Source for everyone.

  • D3 photo D3

    Data-Driven Documents codes.