GithubHelp home page GithubHelp logo

abhagsain / wazirx-google-sheet-dashboard Goto Github PK

View Code? Open in Web Editor NEW
12.0 3.0 1.0 12 KB

Use Google Sheet to Visualise Your WazirX Portfolio

JavaScript 100.00%
wazirx wazirx-portfolio google-sheet crypto

wazirx-google-sheet-dashboard's Introduction

Wazirx Google Sheet Dashbaord

Use Google Sheet to visualise your WazirX Portfolio

image

All the code is in the Google Sheet itself and also in this repository and if you use the SpreadSheet you own it so there are no privacy concerns.

But make sure you don't share the spreadsheet with your KEYS in it. (VERY IMPORTANT)

๐Ÿ—’ Step by Step Instructions

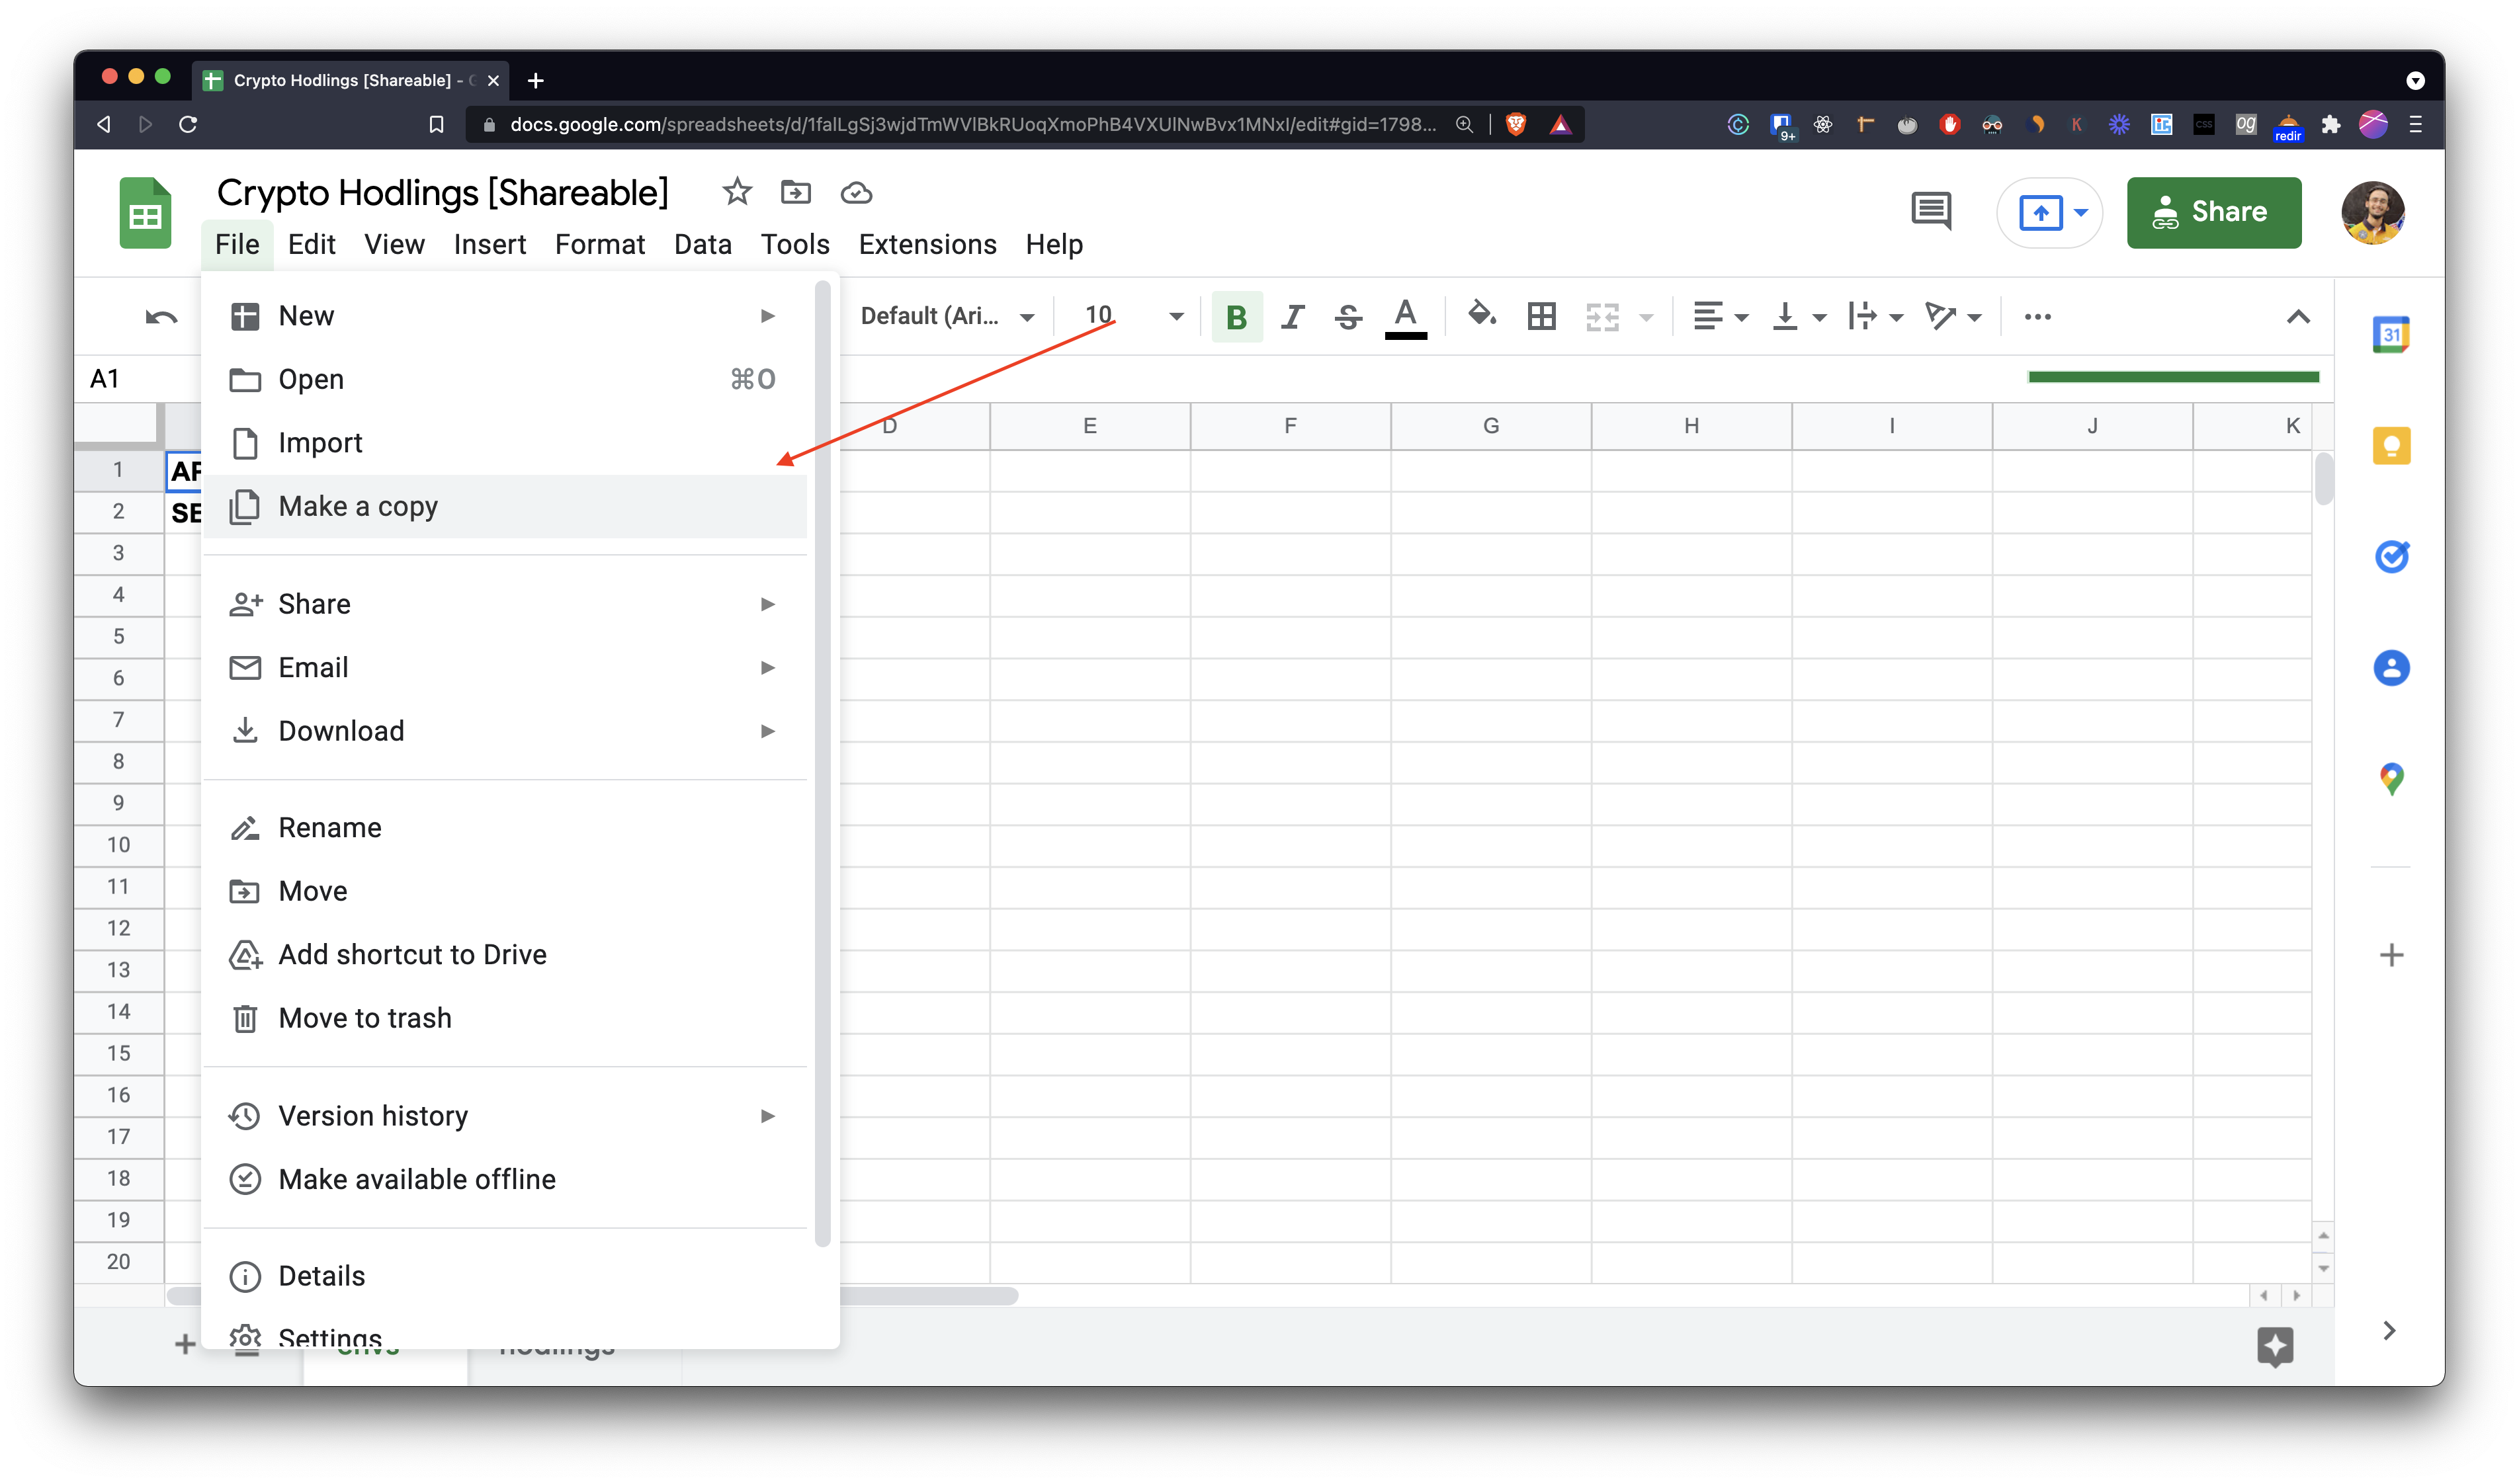
  • Go to this spreadsheet and make a copy of it. image
  • You would need API Key from your WazirX Account

Here's how you can get one. Visit WazirX Keys Section

image image

โš ๏ธ Word Of Caution [IMPORTANT]

If you want to share the sheet with someone else, make sure you don't leave your API & SECRET_KEY in the sheet. That's why it's better to make a copy of it without your API and SECRET_KEY or Share the original spreadsheet instead

If your API or SECRET KEY gets compromised then the person will get access to your entire account and they can buy or sell any of your coins.
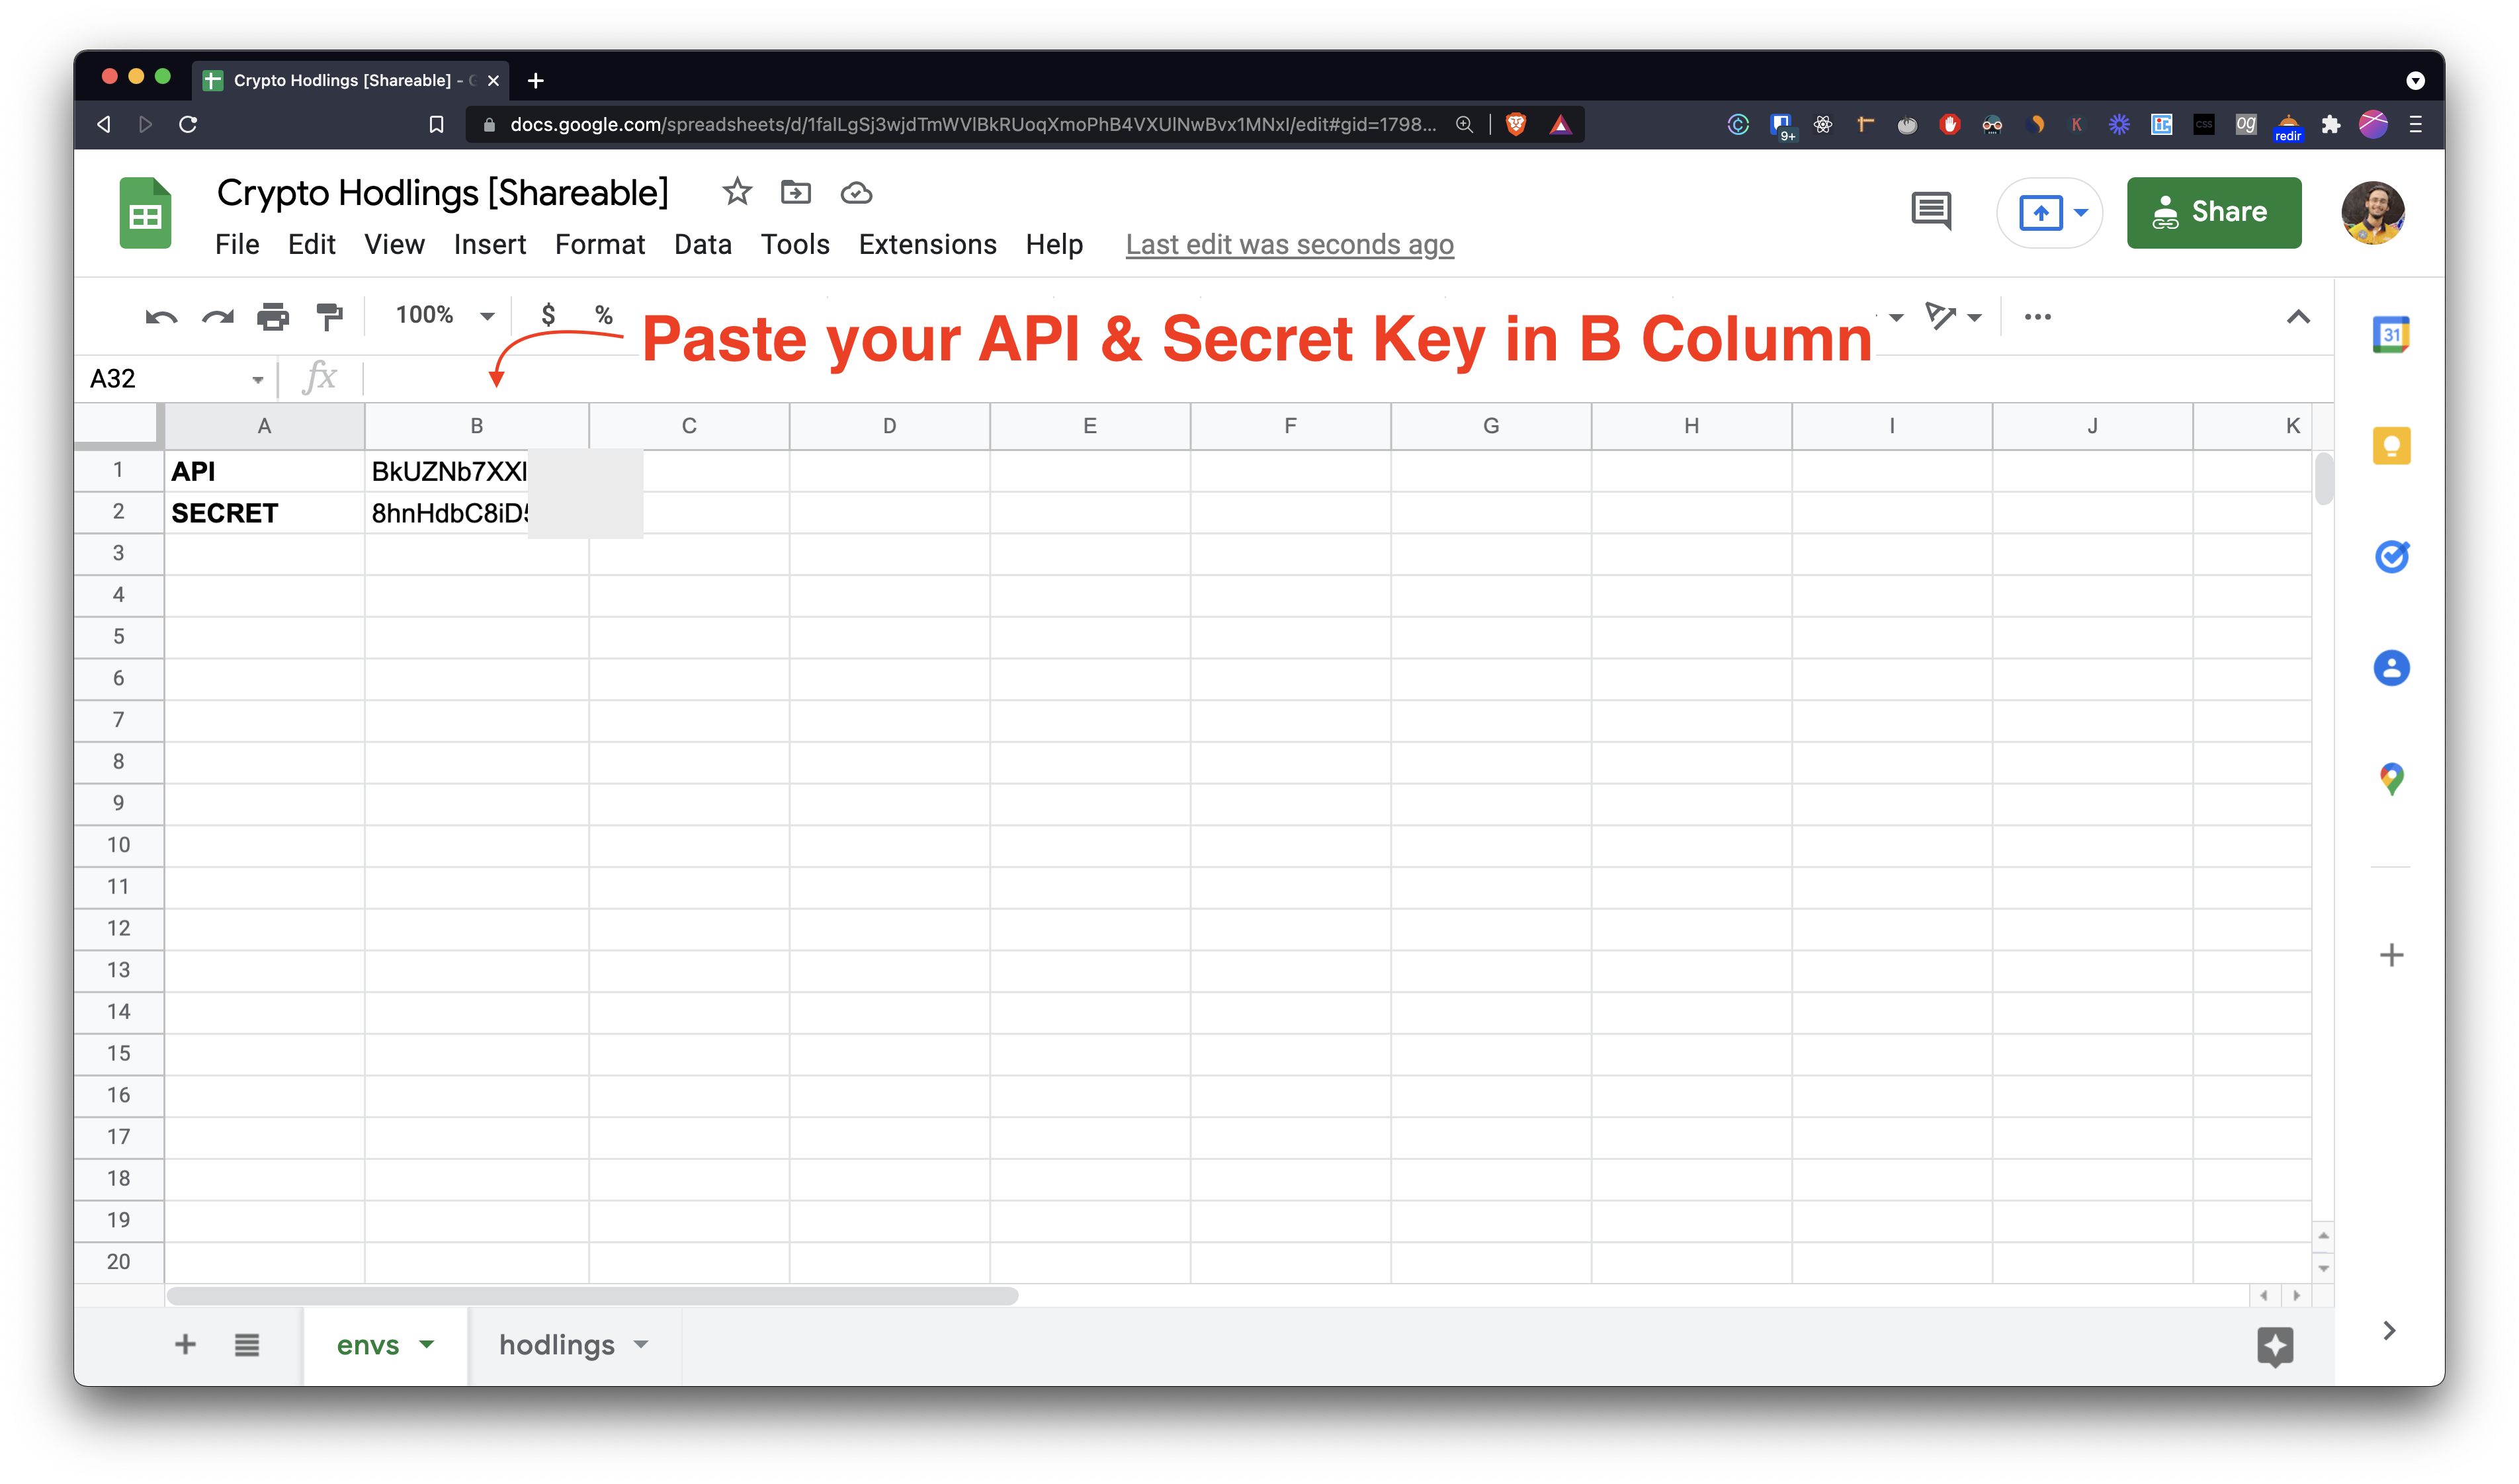
โš ๏ธ If you think your API has been compromised then you can delete it from the WazirX Keys Section.

  • Once you get your API and SECRET_KEY. Paste it in the B2 column like this

image

Go to the hodlings page. (See at the bottom)

image

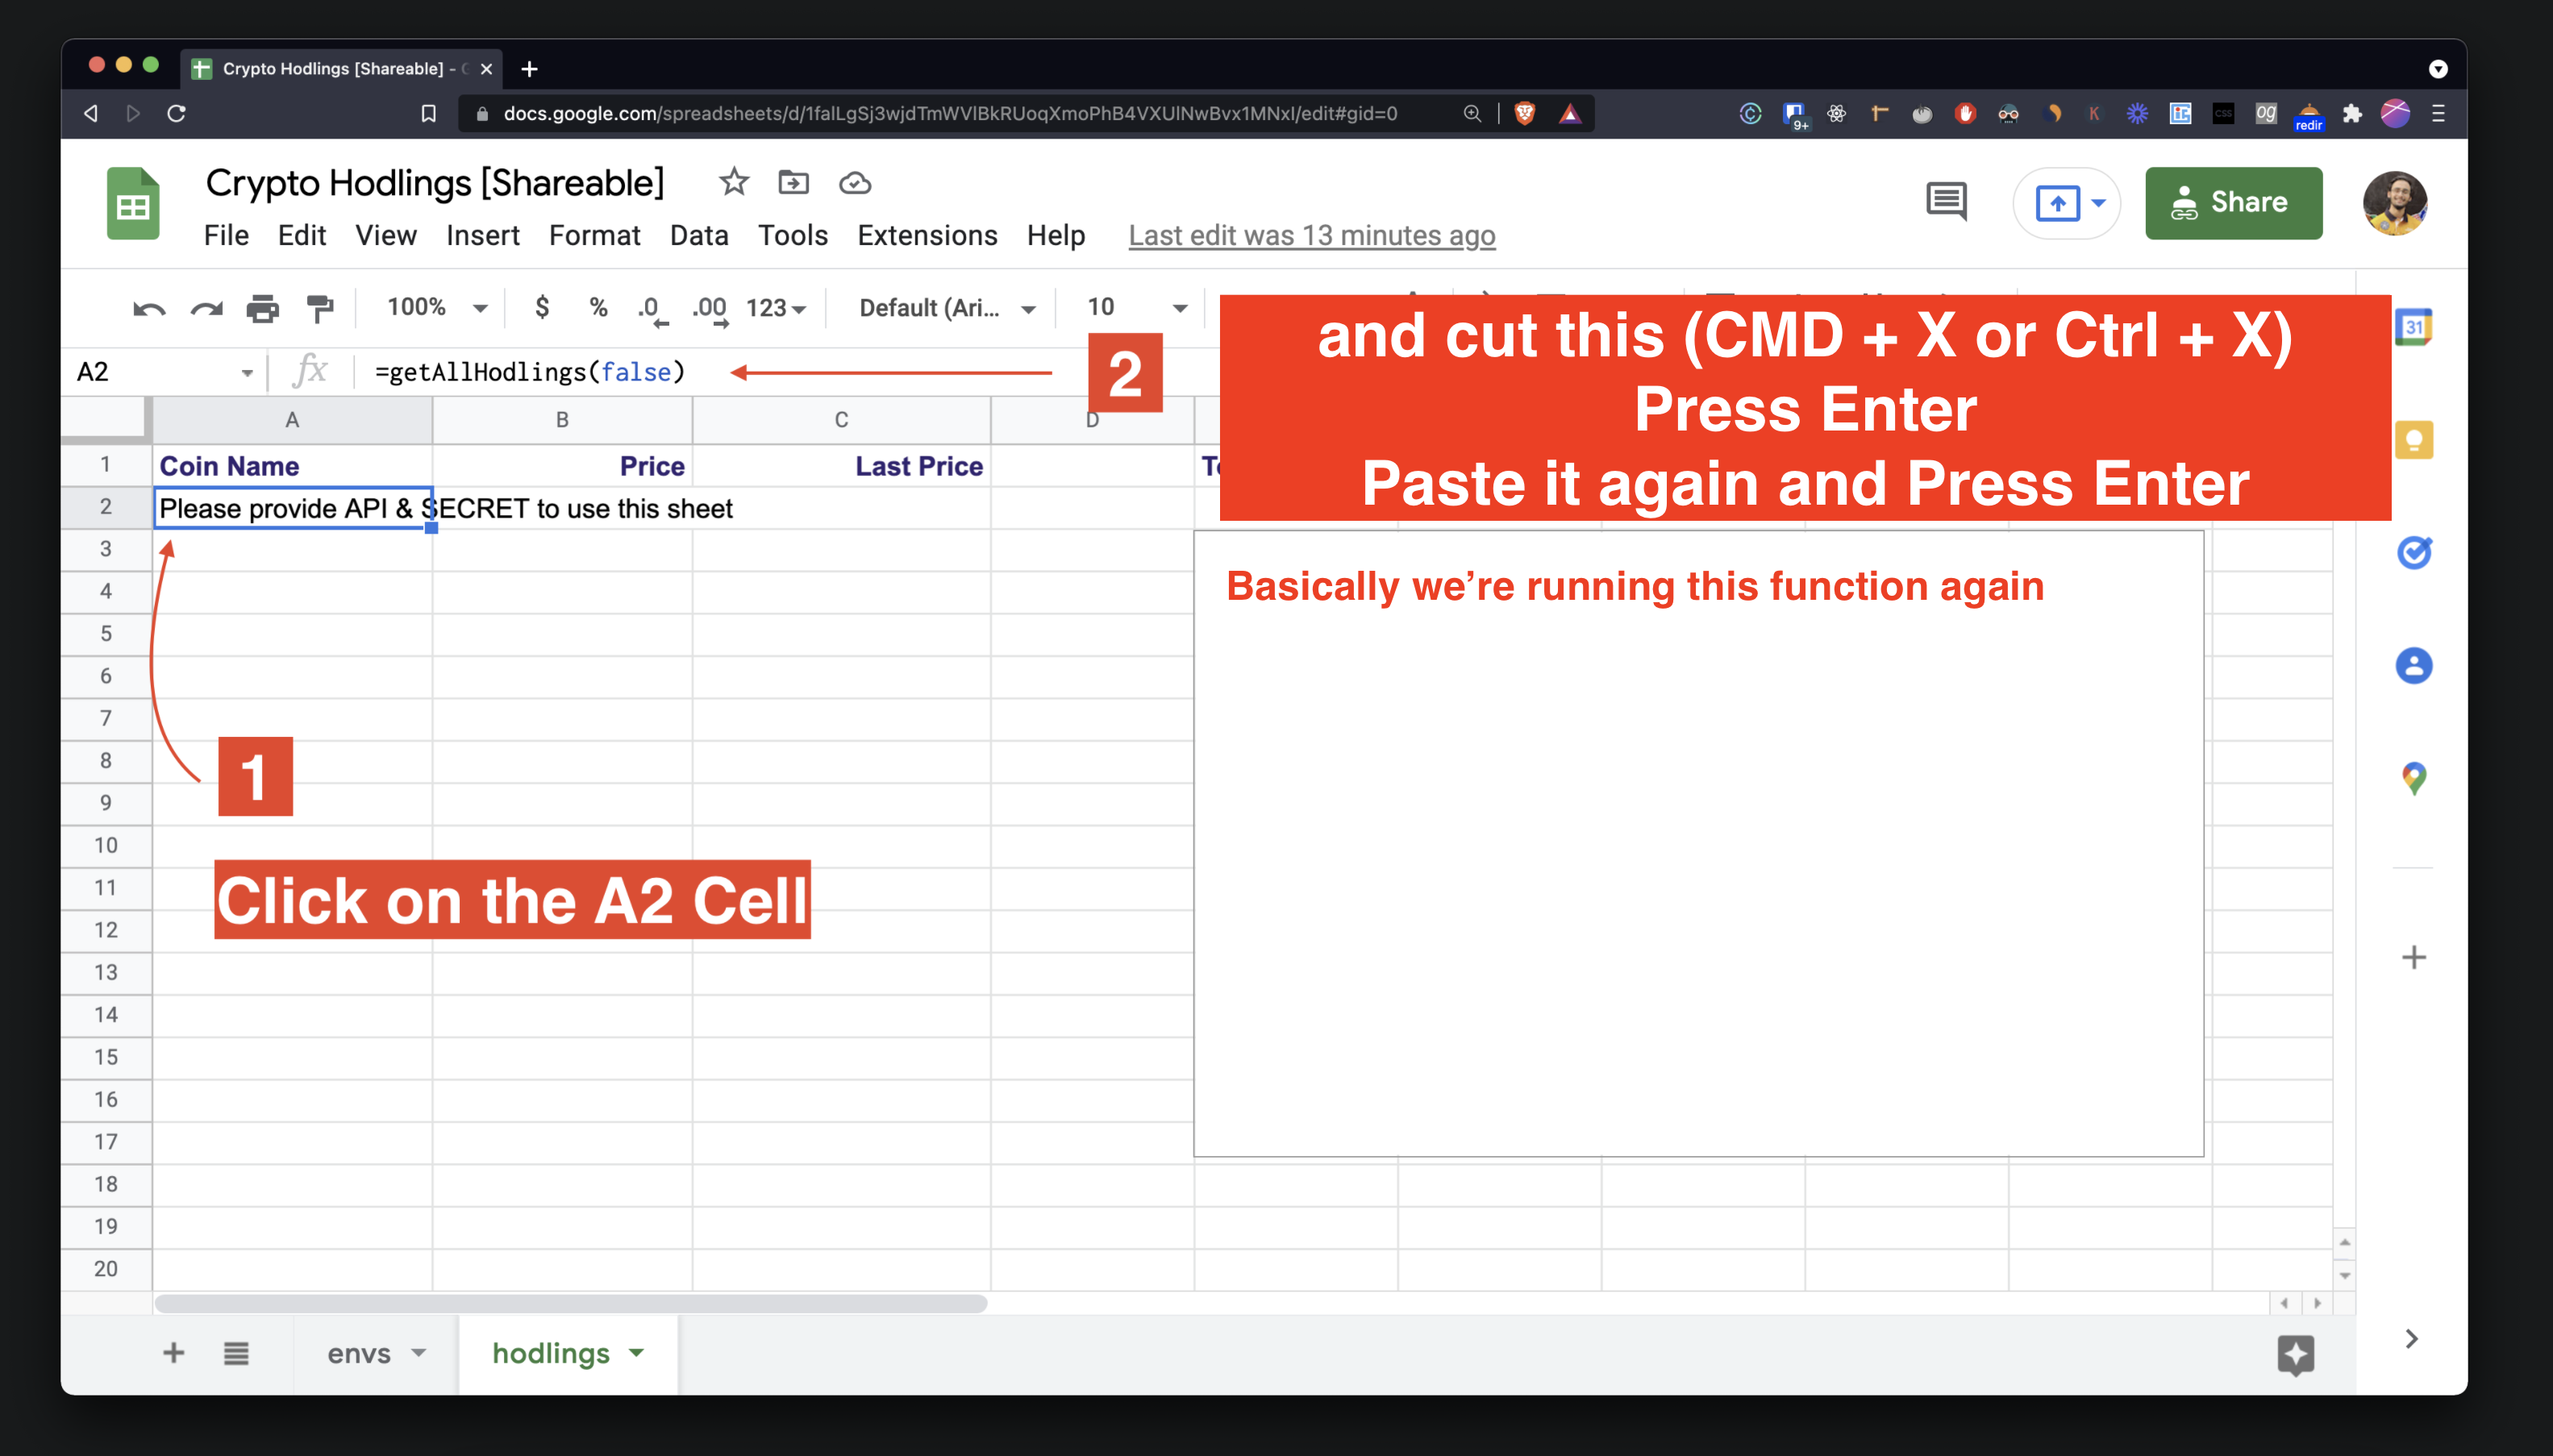
This showDummyData mean it would show random data for the amount column. Defaults to false i.e your actual amount would show up.

image

And you will see your account data. That is it ๐Ÿฅณ.

image

๐Ÿ˜ฑ Is this safe?

Yes, it's safe because you own the code as the entire code is in the Google Sheet itself. As long as someone don't have access to your Gmail account or you don't share the Spreadsheet with your API Keys in it. You don't need to worry about it. But make sure your gmail account isn't owned/shared with someone else or not logged into a public computer.

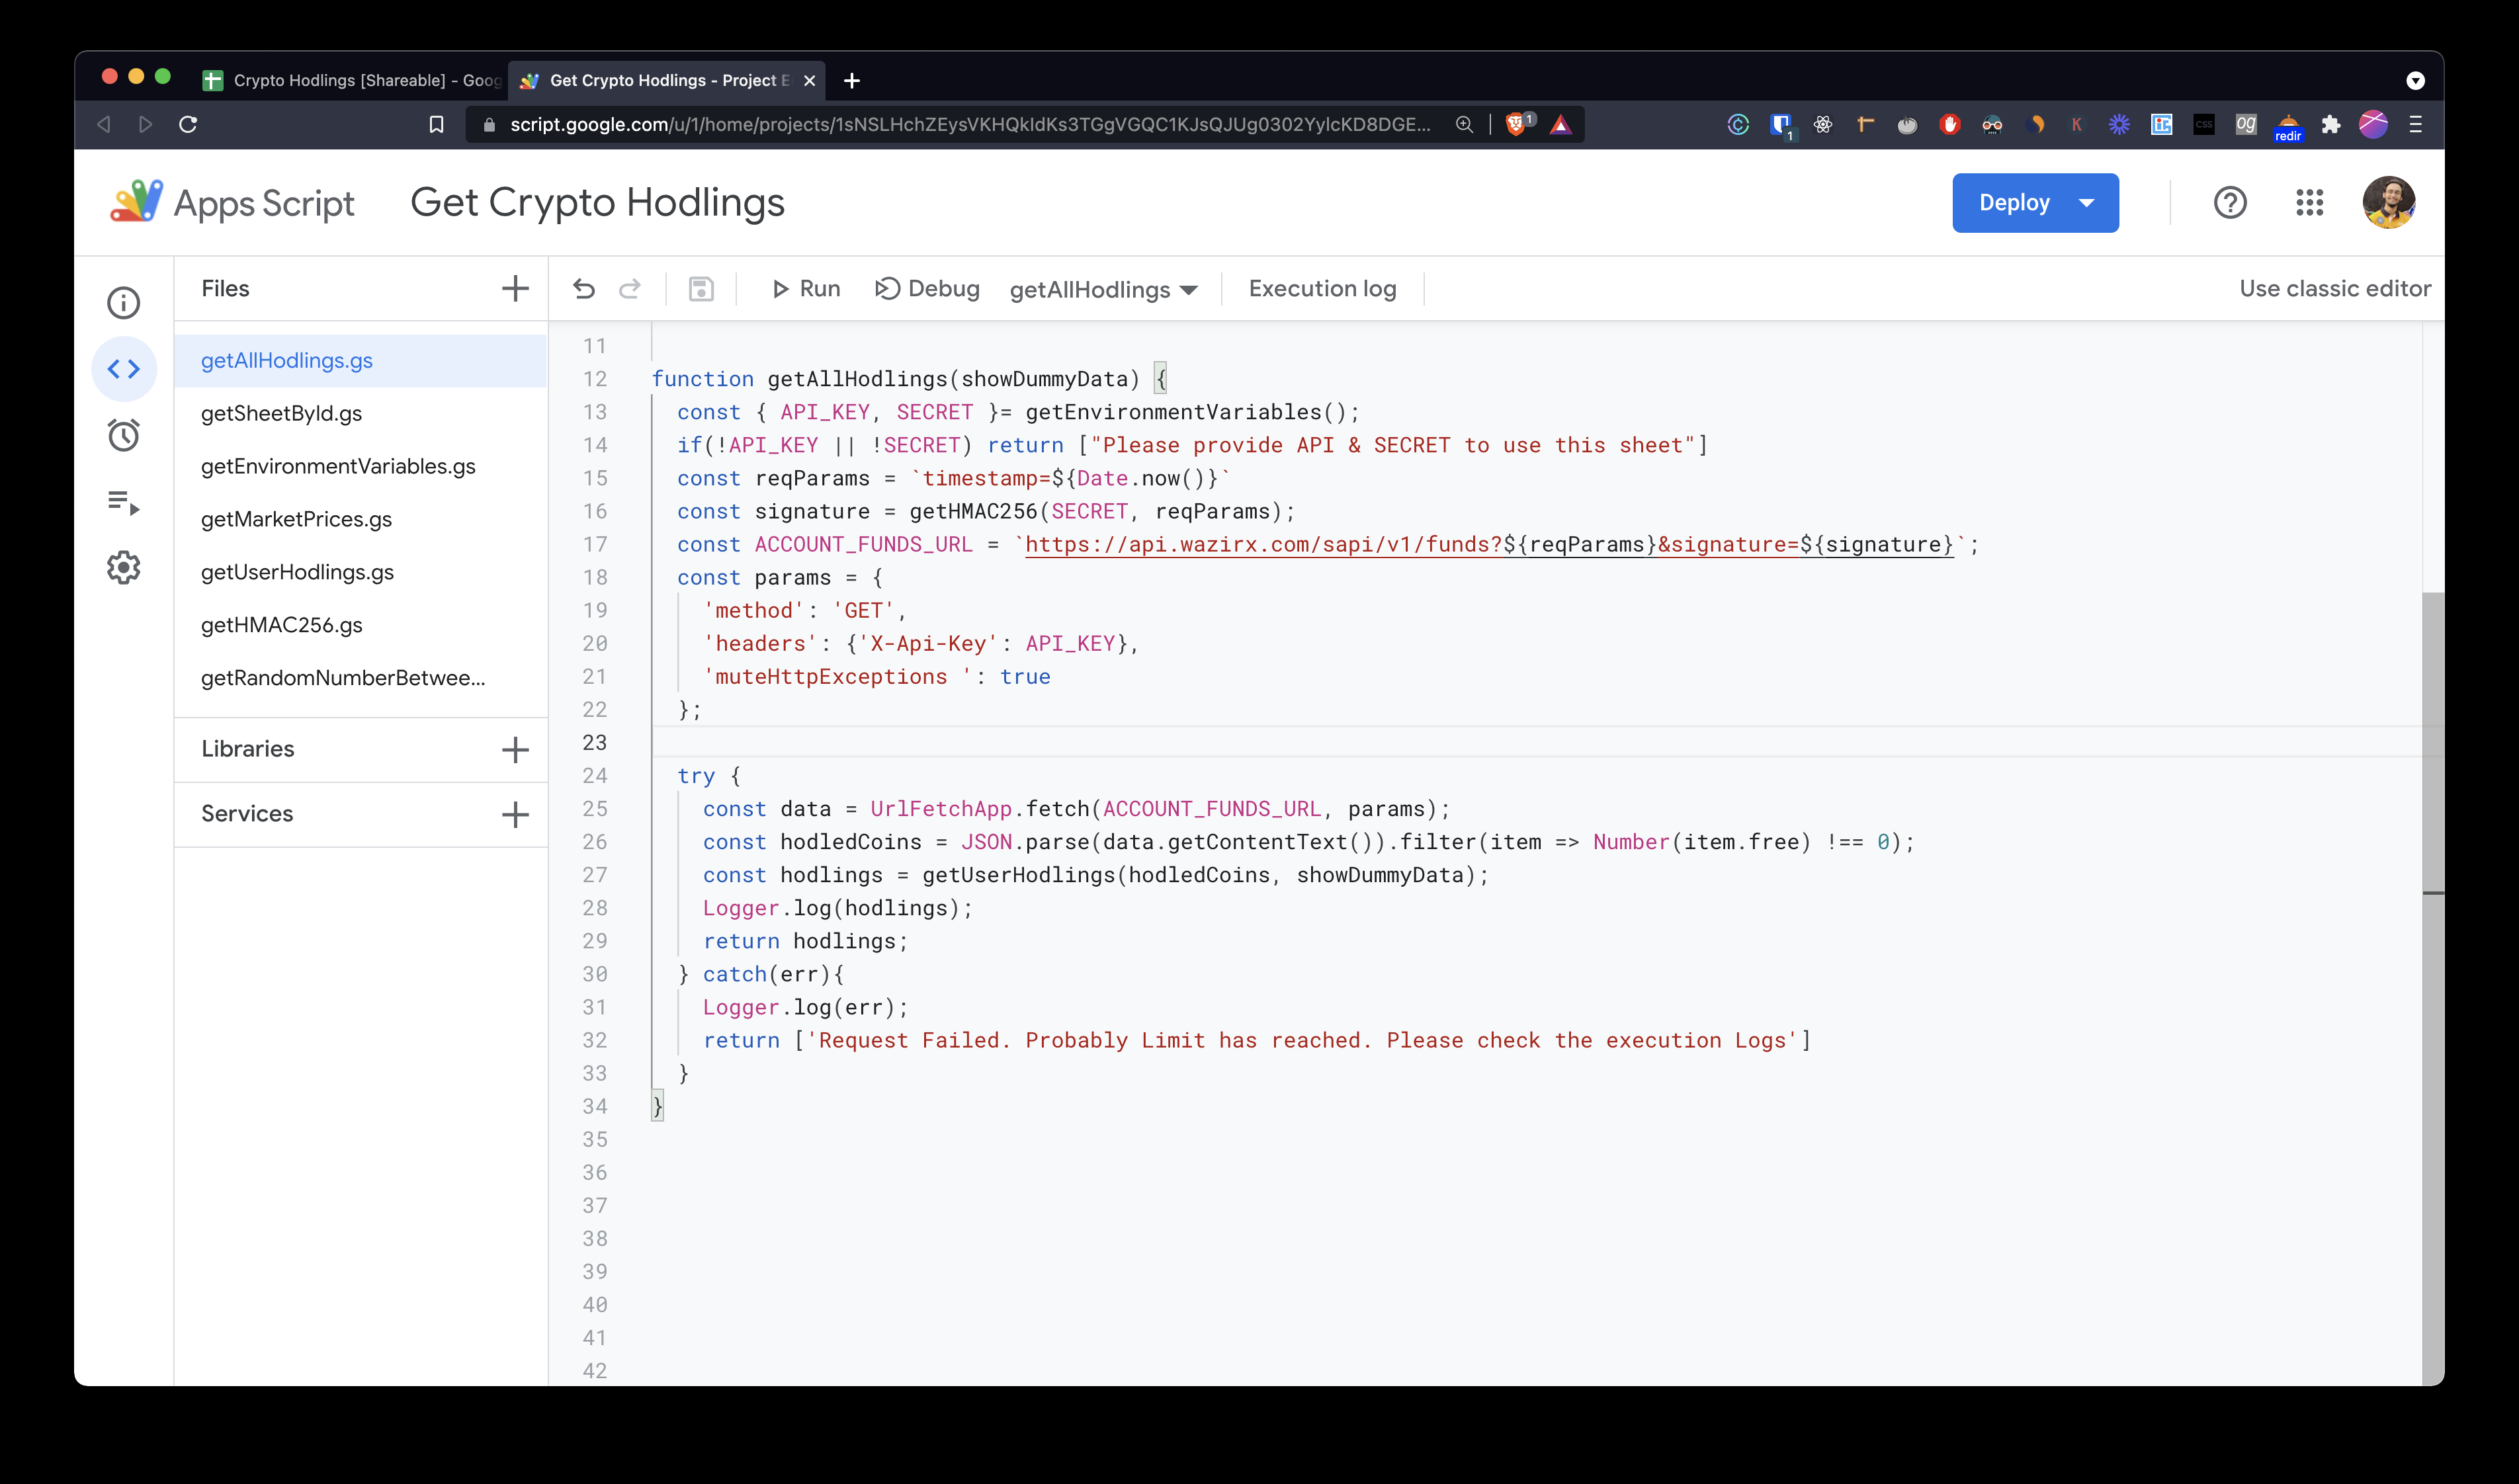
If you want to see the code here's how you would do it.

image

And this is all the code

image

โ“ Why I built this

WazirX doesn't have a dashboard to show coin allocation yet and I wanted to visually see in which coin I'm investing in the most (It's MATIC AND ETH btw ๐Ÿ˜›) with percentages. So I decided to use Google Sheet and build it myself

Why Google Sheet?

Because you can easily draw charts and that's exactly what I wanted.

๐ŸŒ Plug - My Side Project Coingaze

If you liked this you might want to checkout my other project โœจ Coingaze โœจ.

A Web App where you can create custom price alerts and get notifications using Browser & Telegram. Over 500+ people are using it and there are currently over 700+ active alerts.

image

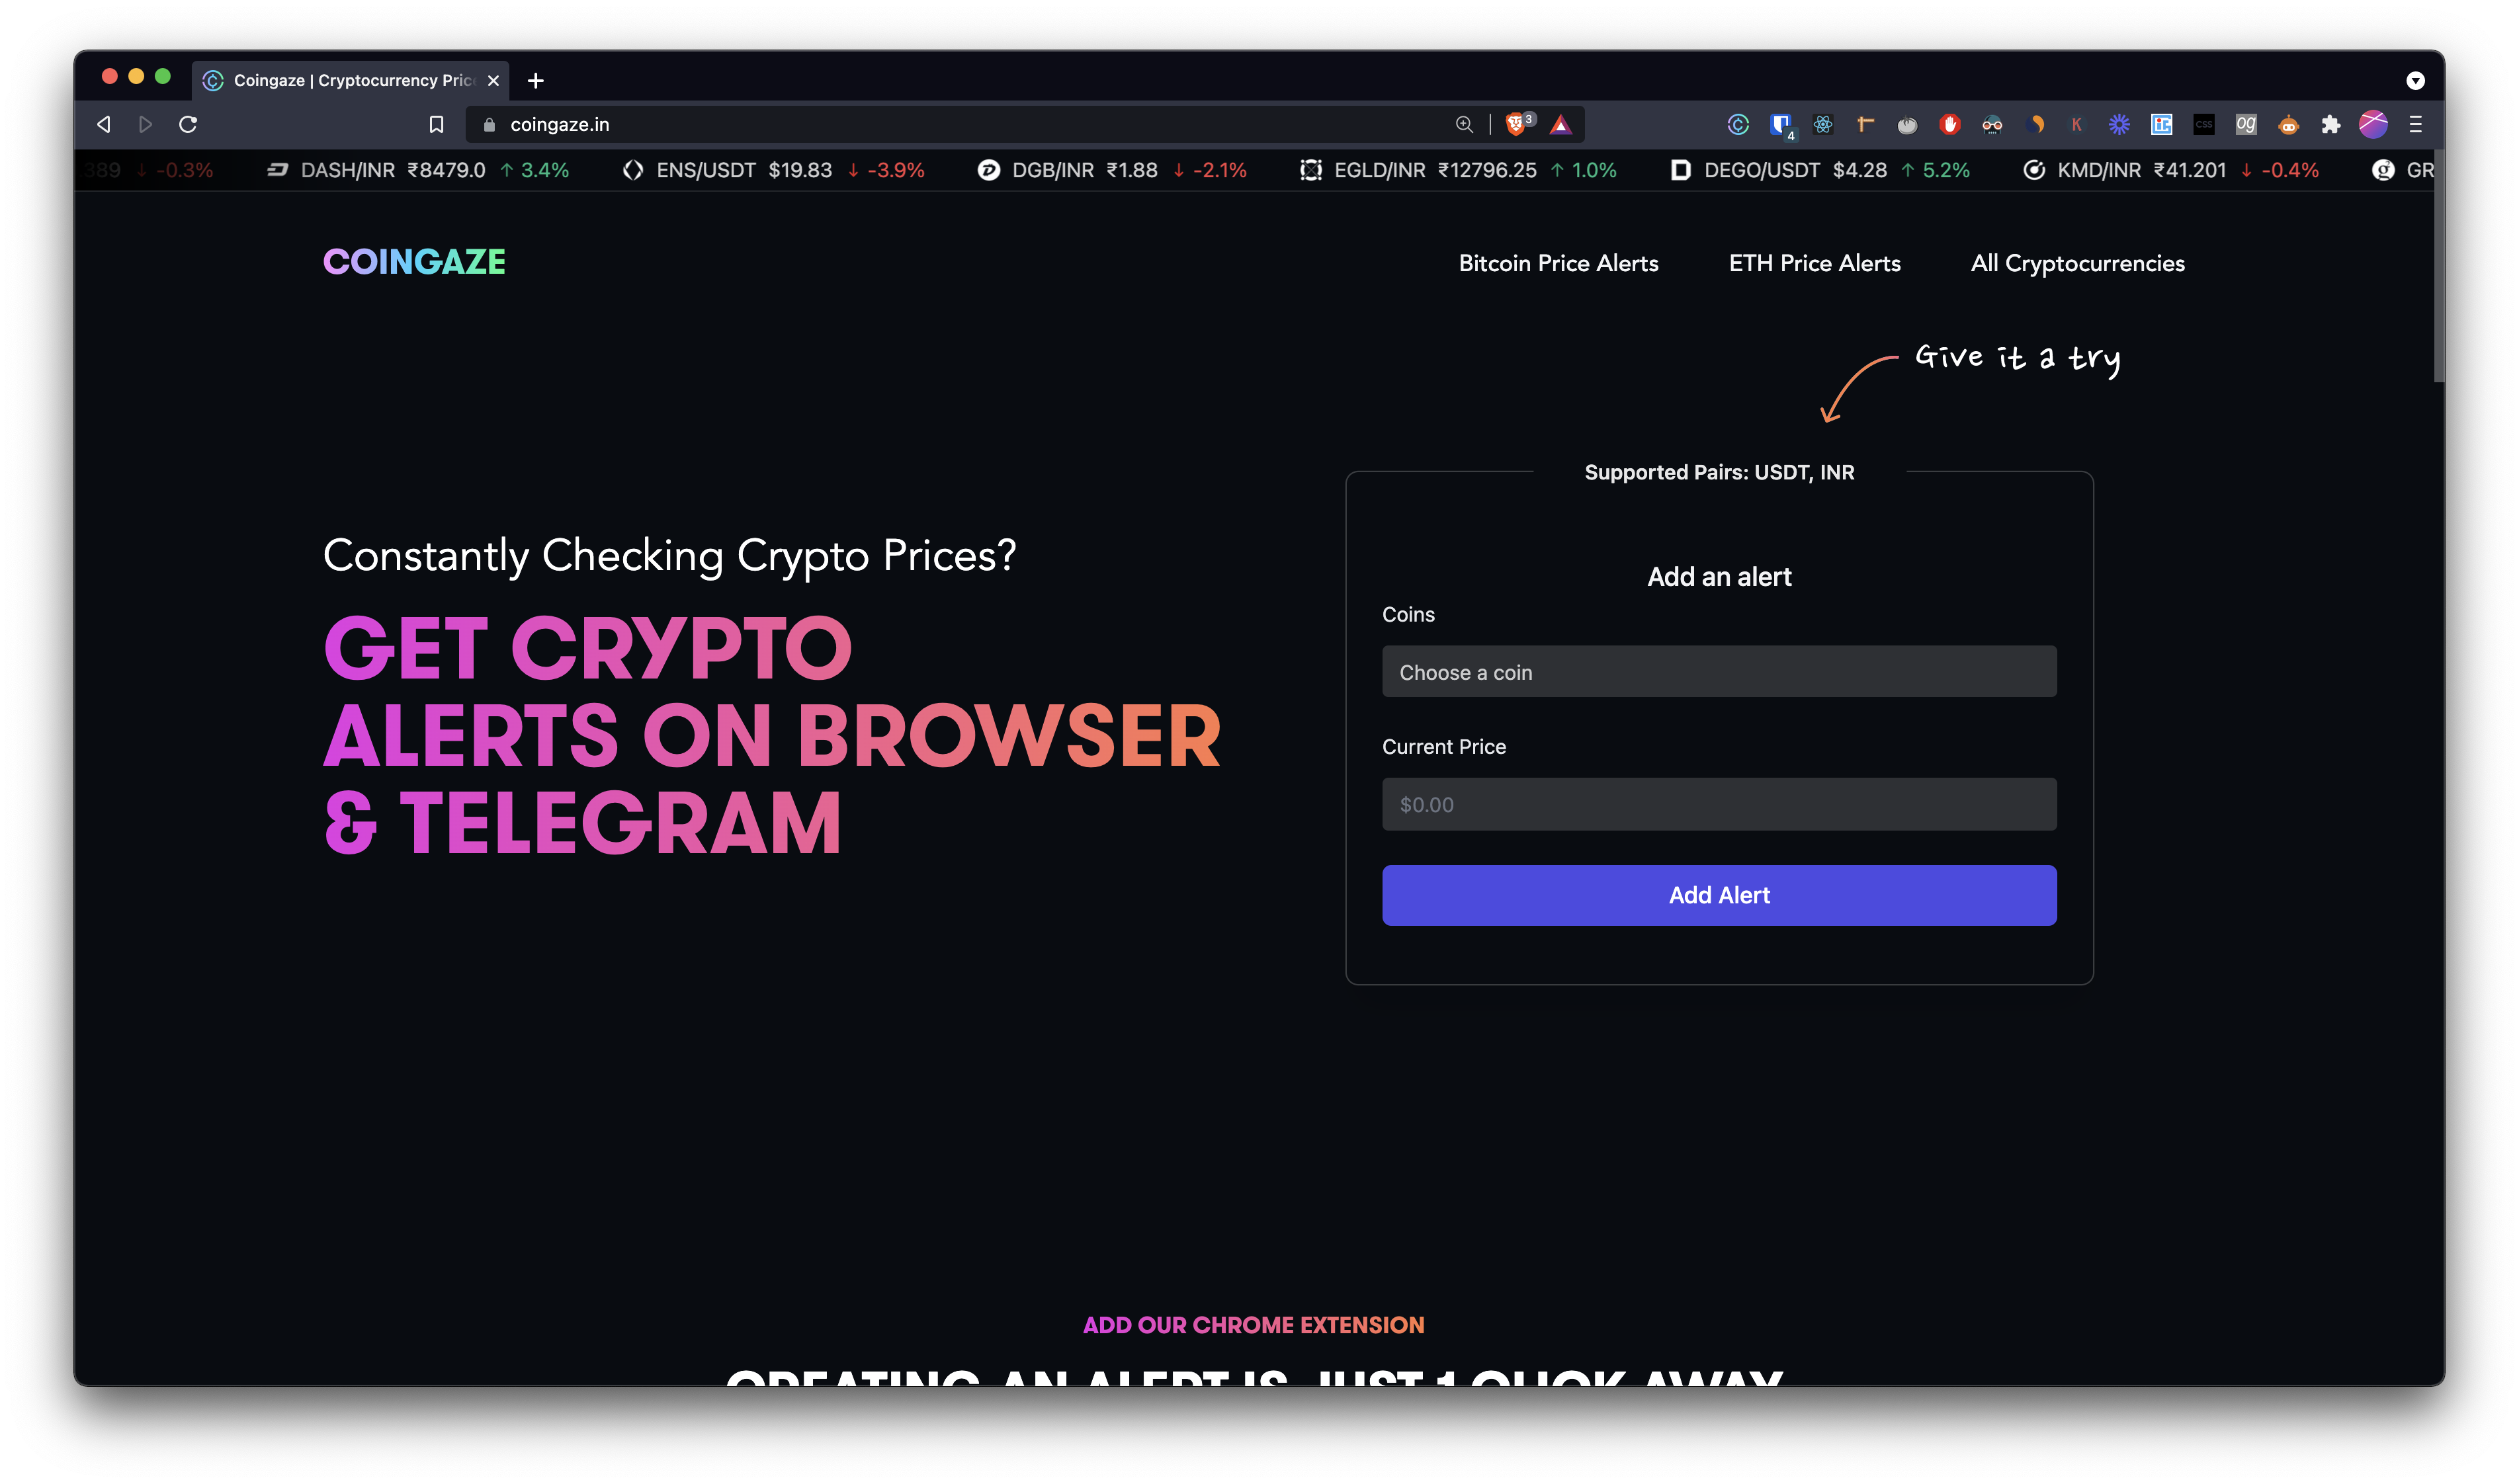
It also has Chrome Extension so you can create alerts right from the WazirX Website ๐Ÿš€

extension-flow-coingaze

That's basically it

Liked this or found this useful? Connect with me on Twitter or LinkedIn

Let's have a chat :)

wazirx-google-sheet-dashboard's People

Contributors

abhagsain avatar

Stargazers

 avatar  avatar  avatar  avatar  avatar  avatar  avatar  avatar  avatar  avatar  avatar  avatar

Watchers

 avatar  avatar  avatar

Forkers

praveen686

wazirx-google-sheet-dashboard's Issues

Feature Suggestion

As of now, it is only showing the value of my assets and their individual market prices.
I don't know if WazirX gives this data via free API but I will suggest to add a P/L column as well. Would be better.

Recommend Projects

  • React photo React

    A declarative, efficient, and flexible JavaScript library for building user interfaces.

  • Vue.js photo Vue.js

    ๐Ÿ–– Vue.js is a progressive, incrementally-adoptable JavaScript framework for building UI on the web.

  • Typescript photo Typescript

    TypeScript is a superset of JavaScript that compiles to clean JavaScript output.

  • TensorFlow photo TensorFlow

    An Open Source Machine Learning Framework for Everyone

  • Django photo Django

    The Web framework for perfectionists with deadlines.

  • D3 photo D3

    Bring data to life with SVG, Canvas and HTML. ๐Ÿ“Š๐Ÿ“ˆ๐ŸŽ‰

Recommend Topics

  • javascript

    JavaScript (JS) is a lightweight interpreted programming language with first-class functions.

  • web

    Some thing interesting about web. New door for the world.

  • server

    A server is a program made to process requests and deliver data to clients.

  • Machine learning

    Machine learning is a way of modeling and interpreting data that allows a piece of software to respond intelligently.

  • Game

    Some thing interesting about game, make everyone happy.

Recommend Org

  • Facebook photo Facebook

    We are working to build community through open source technology. NB: members must have two-factor auth.

  • Microsoft photo Microsoft

    Open source projects and samples from Microsoft.

  • Google photo Google

    Google โค๏ธ Open Source for everyone.

  • D3 photo D3

    Data-Driven Documents codes.