
![]()


For clearer initiation, method's parameters must be provided at the init:
xpl = SmartExplainer(model, backend, preprocessing, postprocessing, features_groups) instead of xpl.compile(x, model, backend, preprocessing, postprocessing, features_groups)
| Version | New Feature | Description | Tutorial |
|---|---|---|---|
| 2.0.x | Refactoring Shapash |
Refactoring attributes of compile methods and init. Refactoring implementation for new backends |  |
| 1.7.x | Variabilize Colors |
Giving possibility to have your own colour palette for outputs adapted to your design |  |
| 1.6.x | Explainability Quality Metrics article |
To help increase confidence in explainability methods, you can evaluate the relevance of your explainability using 3 metrics: Stability, Consistency and Compacity |  |
| 1.5.x | ACV Backend |
A new way of estimating Shapley values using ACV. More info about ACV here. |  |
| 1.4.x | Groups of features demo |
You can now regroup features that share common properties together. This option can be useful if your model has a lot of features. |
 |
| 1.3.x | Shapash Report demo |
A standalone HTML report that constitutes a basis of an audit document. |
Shapash is a Python library which aims to make machine learning interpretable and understandable by everyone. It provides several types of visualization that display explicit labels that everyone can understand.
Data Scientists can understand their models easily and share their results. End users can understand the decision proposed by a model using a summary of the most influential criteria.
Shapash also contributes to data science auditing by displaying usefull information about any model and data in a unique report.
- Readthedocs:
- Presentation video for french speakers
- Medium:


- Display clear and understandable results: plots and outputs use explicit labels for each feature and its values


- Allow Data Scientists to quickly understand their models by using a webapp to easily navigate between global and local explainability, and understand how the different features contribute: Live Demo Shapash-Monitor

- Summarize and export the local explanation
Shapash proposes a short and clear local explanation. It allows each user, whatever their Data background, to understand a local prediction of a supervised model thanks to a summarized and explicit explanation
-
Evaluate the quality of your explainability using different metrics
-
Easily share and discuss results with non-Data users
-
Deploy interpretability part of your project: From model training to deployment (API or Batch Mode)
-
Contribute to the auditability of your model by generating a standalone HTML report of your projects. Report Example
We hope that this report will bring a valuable support to auditing models and data related to a better AI governance. Data Scientists can now deliver to anyone who is interested in their project a document that freezes different aspects of their work as a basis of an audit report. This document can be easily shared across teams (internal audit, DPO, risk, compliance...).

Shapash is an overlay package for libraries dedicated to the interpretability of models. It uses Shap or Lime backend to compute contributions. Shapash builds on the different steps necessary to build a machine learning model to make the results understandable

Shapash works for Regression, Binary Classification or Multiclass problem.
It is compatible with many models: Catboost, Xgboost, LightGBM, Sklearn Ensemble, Linear models, SVM.
Shapash can use category-encoders object, sklearn ColumnTransformer or simply features dictionary.
- Category_encoder: OneHotEncoder, OrdinalEncoder, BaseNEncoder, BinaryEncoder, TargetEncoder
- Sklearn ColumnTransformer: OneHotEncoder, OrdinalEncoder, StandardScaler, QuantileTransformer, PowerTransformer
Shapash is intended to work with Python versions 3.6 to 3.9. Installation can be done with pip:
pip install shapash
In order to generate the Shapash Report some extra requirements are needed. You can install these using the following command :
pip install shapash[report]
If you encounter compatibility issues you may check the corresponding section in the Shapash documentation here.
The 4 steps to display results:
- Step 1: Declare SmartExplainer Object
You can declare features dict here to specify the labels to display
from shapash import SmartExplainer
xpl = SmartExplainer(
  features_dict=house_dict,  # Optional parameter
  model=regressor,
  preprocessing=encoder, # Optional: compile step can use inverse_transform method
  postprocessing=postprocess # Optional: see tutorial postprocessing
)
- Step 2: Compile Model, Dataset, Encoders, ...
There are 2 mandatory parameters in compile method: Model and Dataset
xpl.compile(
    x=Xtest,
    y_pred=y_pred, # Optional
)
- Step 3: Display output
There are several outputs and plots available. for example, you can launch the web app:
app = xpl.run_app()
- Step 4: Generate the Shapash Report
This step allows to generate a standalone html report of your project using the different splits of your dataset and also the metrics you used:
xpl.generate_report(
    output_file='path/to/output/report.html',
    project_info_file='path/to/project_info.yml',
    x_train=Xtrain,
    y_train=ytrain,
    y_test=ytest,
    title_story="House prices report",
    title_description="""This document is a data science report of the kaggle house prices tutorial project.
        It was generated using the Shapash library.""",
    metrics=[{‘name’: ‘MSE’, ‘path’: ‘sklearn.metrics.mean_squared_error’}]
)
- Step 5: From training to deployment : SmartPredictor Object
Shapash provides a SmartPredictor object to deploy the summary of local explanation for the operational needs. It is an object dedicated to deployment, lighter than SmartExplainer with additional consistency checks. SmartPredictor can be used with an API or in batch mode. It provides predictions, detailed or summarized local explainability using appropriate wording.
predictor = xpl.to_smartpredictor()
See the tutorial part to know how to use the SmartPredictor object
This github repository offers many tutorials to allow you to easily get started with Shapash.
Overview
Charts and plots
- Shapash Features Importance
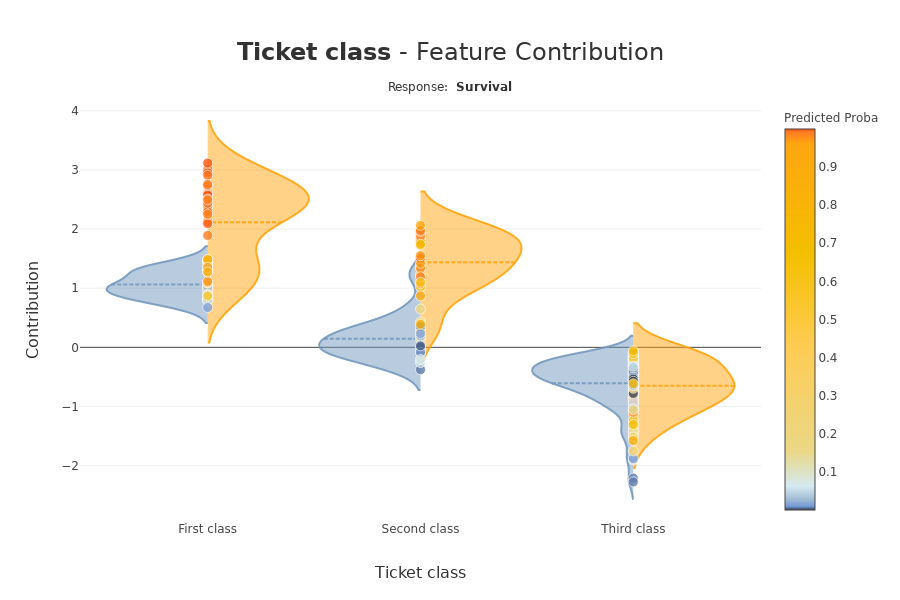
- Contribution plot to understand how one feature affects a prediction
- Summarize, display and export local contribution using filter and local_plot method
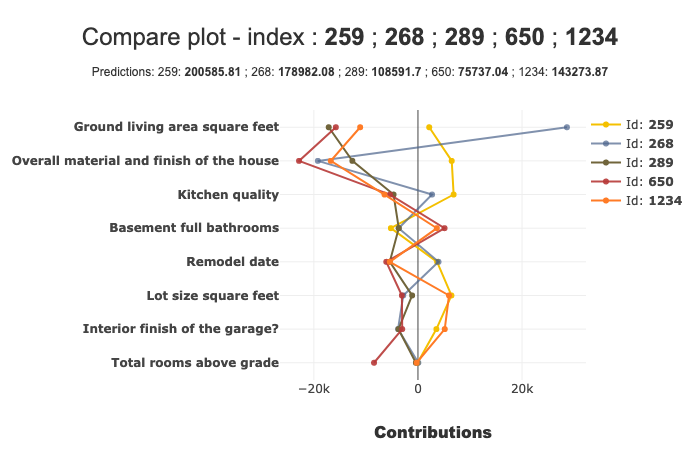
- Contributions Comparing plot to understand why predictions on several individuals are different
- Visualize interactions between couple of variables
- Customize colors in Webapp, plots and report


![dependabot[bot] avatar](https://avatars.githubusercontent.com/in/29110?v=4 "dependabot[bot]")


