Sarjitsu ingests a SAR (System Activity Reporter) binary data file (located under /var/log/sa/) ..and produces dynamic visualizations based on Grafana. The name is inspired from 'SAR + jistsu', so to speak, unleashing the power of SAR data.
You could also refer to this blog post on Sarjitsu to know more about this app and catch glimpses of some screenshots.
The app is composed of following containerized instances:
-
datasource: Used to store timeseries data and metadata. A full-text search engine powered by elasticsearch -
metricstore: PostgreSQL powered, used by the frontend (Grafana) to store metadata about dashboards, datasource and users. -
frontend: Powered by Grafana, a dynamic visualization frontend which sources data from elasticsearch, and stored metadata in metricstore. -
middleware: A Python-Flask powered API that talks to backend and metricstore; builds scriped dashboards -
backend: ANodeJS (rewritten in Flask)Python-Flask powered web app, which runs the web interface for users to upload a SA binary file and obtain visualizations. -
caching: Redis based caching solution for the web app. -
proxy: Nginx based proxy for web app.
Application flow is explained in detail in the section APP FLOW below.
Prerequisites: docker-compose
Copy env.example to .env. Then, run $ docker-compose up --build -d
- docker-compose self-help (from project root folder):
start: `docker-compose up -d`
cleanup: `docker-compose rm` or `docker-compose rm --all`
shutdown: `docker-compose down`
restart: `docker-compose restart`
kill: `docker-compose kill`
- To deploy on OpenShift, you could use kompose:
Get your openshift cluster up and running. Refer to ose-deployment.md
Once it's up, do this:
$ kompose convert -f docker-compose.yml  --provider openshift -o openshift/templates/
$ oc create -f openshift/templates/
or this:
$ kompose up --provider openshift

# either of:
$ oc get pods,svc -o wide
$ oc get pods -w
$ oc get pods --show-all=false
Once all the pods are running, do this:
$ oc expose svc nginx
# optionally, supply --hostname='' ..if a DNS hostname resolution entry is reserved for this application.
Sarjitsu is accessible through Nginx container's URL / IP address.
-
If deployed through docker-compose, access the nginx IP. If you've used default settings from
env.example, the URL should behttp://0.0.0.0:8001/ -
If deployed through openshift, use the exposed nginx route. Defaults to sample URL ->
http://nginx-myproject.<your IP address>.xip.io/
One could experiment with sample SA binaires included in test/ folder.
You could also upload files through the commandline tool vizit, from under utils/ folder. This is useful when you're working out of a remote server and unable to access SA binaries (since sarjitsu's web interface requires selection of files from your local machine).
For using vizit, you need to fulfill requirements as follows:
$ cd utils/
$ virtualenv venv -p python3
$ source venv/bin/activate
$ pip3 install -r requirements.txt
Now, edit conf/vizit.cfg under utils/ and update with sarjitsu server's nginx URL/address and Port.
  $ ./vizit [ options ] [ <datafile/dir path> ]

  Default: $ ./vizit <sa01 path> <sa02 path> ..

  Options are:
  	[-f path to a single SA binary file.]
  	[-d path to directory with a bunch of SA binary files in it.]
  	[-r path to pbench results dir. Recursively locates all sar.data]
Some examples:
$ ./vizit -f <path to sa binary file>"
$ ./vizit -d <path to dir w/ sa binaries>"
$ ./vizit -r <pbench latest results dir>
A sample of various outputs from vizit tool is present in docs/vizit_output_sample.txt
- In case Sarjitsu's backend container is not accessible outside, run
# iptables -Fto flush the IP tables in the server where it is running. Otherwise check your firewall settings. Or the proxy environment settings, like that of Nginx, if you've routed your application in that fashion.
-
Building docker images on first run would take some time, as the images are pulled from dockerhub, customized & built; then packages are installed and so on..
-
If you have custom HOST(s) configured, they should match the following versions (for sarjitsu compatibility reasons):
- Elasticsearch < 2.0 and > 1.5 (containerized version: 1.7.3)
- Grafana > 2.5 and <= 3.0 (containerized version: 3.0.1-1)
- Postgres == 9.5 (containerized version: 9.5 (dockerhub latest) ..utilizes UPSERT feature introduced in this version)
-
Without docker-compose (WARNING: not recommended / supported anymore), a container can be started using the following approach:
docker rm -f elastic_jitsu
docker build -t sarjitsu_elasticsearch --build-arg ES_PORT=9200 .
docker run --name elastic_jitsu -p 9601:9200 -d sarjitsu_elasticsearch

## OR single line:
docker rm -f elastic_jitsu; docker build -t saitsu_elasticsearch --build-arg ES_PORT=9200 . && docker run --name elastic_jitsu -p 9601:9200 -d sarjitsu_elasticsearch

## supply additional args if needed:  -v /sys/fs/cgroup:/sys/fs/cgroup:ro --privileged
## although there's a new method out there for running containers without systemd. Checkout the links:
1. https://developers.redhat.com/blog/2016/09/13/running-systemd-in-a-non-privileged-container/
2. https://github.com/RHsyseng/container-rhel-examples/tree/master/starter-systemd
To delete the pods / services as well as the openshift cluster itself, do this:
$ oc delete service,dc,is,bc datasource frontend metricstore middleware nginx redis web

$ kompose down --provider=openshift

$ oc cluster down
We've included a script that automates following steps lib/backend/activate_dev_mode.
But as of now, it only works with Fedora and Ubuntu OS. For other Operating Systems, refer below:
- Clone the repo
- run cp
cp env.example .env - Start the containers with
docker-compose up -d. - Kill the web container
docker-compose kill weband make sure rest are runningdocker-compose ps
Output should be like this:
Name                       Command                State             Ports
-------------------------------------------------------------------------------------------
sarjitsu_datasource_1    /docker-entrypoint.sh elastic    Up         0.0.0.0:9200->9200/tcp
sarjitsu_frontend_1      /docker-entrypoint.sh graf ...   Up         0.0.0.0:3000->3000/tcp
sarjitsu_metricstore_1   container-entrypoint run-p ...   Up         0.0.0.0:5432->5432/tcp
sarjitsu_middleware_1    /docker-entrypoint.sh api_ ...   Up         0.0.0.0:5000->5000/tcp
sarjitsu_nginx_1         /docker-entrypoint.sh prox ...   Up         0.0.0.0:8001->8001/tcp
sarjitsu_redis_1         docker-entrypoint.sh redis ...   Up         0.0.0.0:6379->6379/tcp
sarjitsu_web_1           /docker-entrypoint.sh backend    Exit 137
- Next, navigate to
sarjitsu/lib/backend/and run this:
echo '
[ElasticSearch]
host = 0.0.0.0
port = 9200

[Settings]
index_prefix = sarjitsu
index_version = 1
bulk_action_count = 2000
number_of_shards = 5
number_of_replicas = 1

[Grafana]
dashboard_url = http://0.0.0.0:3000
api_url = http://0.0.0.0:5000/db/create/
' > conf/sar-index.cfg

echo 'DEBUG = True' > src/config_local.py
echo 'CFG_PATH = "'$(realpath conf/sar-index.cfg)'"' >> src/config_local.py- Install following officially supported packages for your OS distribution:
For Ubuntu OS:
sudo apt-get install libgpgme11 libgpgme11-dev python3-gpgme python3-devFor Fedora OS:
sudo dnf install python3-devel gpgme-devel gpgme- Activate virtualenv for python3 and install
pipdependencies:
virtualenv -p python3 venv
source venv/bin/activate
pip install -r requirements.txt- Run this to connect
redishostname:echo '0.0.0.0 redis' | sudo tee -a /etc/hosts - Run this from
lib/backend:
export VOS_CONFIG_PATH="$(realpath conf/sar-index.cfg)"- Run server:
cd src/
./server.pyFrom docs/sarjitsu_architecture.png:
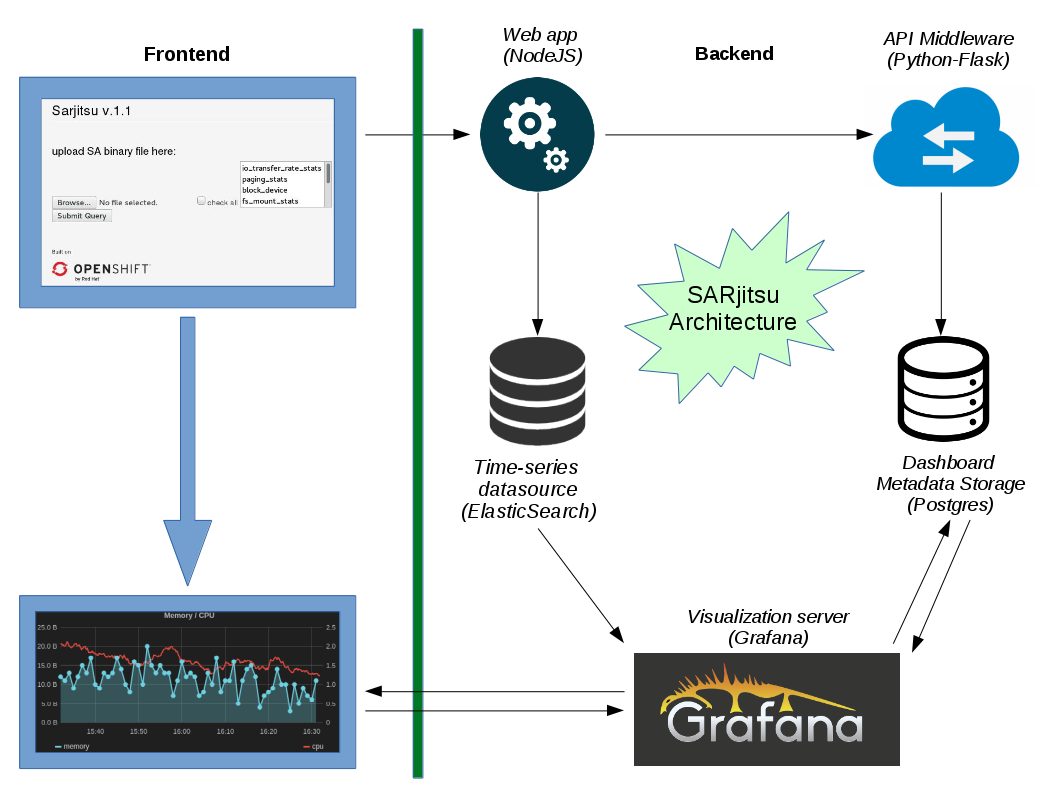
Following steps involved in visualizing SA binary file:
- Step 1: SA Binary upload --> Comptability checks and conversion (if needed)
- Step 2: Conversion to a temporary XML output --> ingestion into Elasticsearch
- Step 3: Creation of dashboard from metadata about the SAR data (time range inferred)
- Step 4: Grafana dashboard generated --> Output tagged with the appropriate nodename
Sarjitsu's frontend service segragates data into various panels, based on params like CPU, Disk, Network usage.
Description of those parameters could be obtained in detail by running the command
$ man sar on a linux terminal. Or you could read about them here on the official
man page for sar command
Files generated in RHEL 5 OS (old enough) ..upto the ones generated by the latest sysstat version.
What sarjitsu does, is it gives you the unique ability throw in any version of
sa binary files from your system's /var/log/sa/ folder, to produce visualizations
with all the SAR params supported till date. This makes it much easier for a user
to go see what's wrong / different about the system behavior by instantly getting
access to all the data indexed in a nice NoSQL based full-text search engine and
a dynamic visualization playground. It further simplifies this process by providing
a web interface to upload these files too!
Sarjitsu also automatically detects the time range of the sa files to display the time-series visualizations and names the dashboards based on the nodename of your system.
It is not tied to a specific machine, but is an independent solution, as a web app.
Sarjitsu is scalable since it keeps the datasource, frontend and backend separately and is based on completely scalable and portable solution, i.e., Elasticsearch, Postgres, Grafana et al, in their respective containerized environments using Docker.
Please use Github issues list and its features for contributions. Click here list of issues. If you think there's a bug in sarjitsu, you're welcome to open an issue here on github and could submit PRs for the same. Any refactoring suggestions/PRs to the app are also welcome.
The default GitHub Issues and Pull Requests interface.
- Statistics about top N devices. Example: CPUs, Disks or Network devices.
Options to integrate this within cloud ecosystem.<- Runs on openshift as well as docker-compose.Service Discovery for individual components.<- Covered by Docker-Compose / OSE feature- Nested documents support in Grafana (Network, CPU, Disks, ..). Refer to PR #4694 of grafana for more.
- Timeshift feature to compare 2 different sa binaries
Refer to GPL v3 LICENSE file included in the repo, for reference.


