GithubHelp home page GithubHelp logo

alphagriffin / asciichart Goto Github PK

View Code? Open in Web Editor NEW

This project forked from kroitor/asciichart

0.0 3.0 0.0 53 KB

Nice-looking lightweight console ASCII line charts ╭┈╯ for Python Command-line with no dependencies

License: The Unlicense

JavaScript 38.98% Python 45.75% HTML 15.27%

asciichart's Introduction

asciichart

npm Travis Coverage Status license

Console ASCII line charts in pure Javascript (for NodeJS and browsers) with no dependencies. This code is absolutely free for any usage, you just do whatever the fuck you want.

Console ASCII Line charts in pure Javascript (for NodeJS and browsers)

Usage

NodeJS

npm install asciichart
var asciichart = require ('asciichart')
var s0 = new Array (120)
for (var i = 0; i < s0.length; i++)
    s0[i] = 15 * Math.sin (i * ((Math.PI * 4) / s0.length))
console.log (asciichart.plot (s0))

Browsers

<!DOCTYPE html>
<html>
    <head>
        <meta http-equiv="Content-Type" content="text/html; charset=utf-8">
        <meta charset="UTF-8">
        <title>asciichart</title>
        <script src="asciichart.js"></script>
        <script type="text/javascript">
            var s0 = new Array (120)
            for (var i = 0; i < s0.length; i++)
                s0[i] = 15 * Math.sin (i * ((Math.PI * 4) / s0.length))
            console.log (asciichart.plot (s0))
        </script>
    </head>
    <body>
    </body>
</html>

Options

The width of the chart will always equal the length of data series. The height and range are determined automatically.

var s0 = new Array (120)
for (var i = 0; i < s0.length; i++)
    s0[i] = 15 * Math.sin (i * ((Math.PI * 4) / s0.length))
console.log (asciichart.plot (s0))

Console ASCII Line charts in pure Javascript (for NodeJS and browsers)

The output can be configured by passing a second parameter to the plot (series, config) function. The following options are supported:

var config = {

    offset:  3,          // axis offset from the left (min 2)
    padding: '       ',  // padding string for label formatting (can be overrided)
    height:  10,         // any height you want

    // the label format function applies default padding
    format:  function (x, i) { return (padding + x.toFixed (2)).slice (-padding.length) }
}

Scale To Desired Height

Console ASCII Line charts in pure Javascript (for NodeJS and browsers)

var s = []
for (var i = 0; i < 120; i++)
    s[i] = 15 * Math.cos (i * ((Math.PI * 8) / 120)) // values range from -15 to +15
console.log (asciichart.plot (s, { height: 6 }))     // this rescales the graph to ±3 lines

Console ASCII Line charts in pure Javascript (for NodeJS and browsers)

Auto-range

var s2 = new Array (120)
s2[0] = Math.round (Math.random () * 15)
for (i = 1; i < s2.length; i++)
    s2[i] = s2[i - 1] + Math.round (Math.random () * (Math.random () > 0.5 ? 2 : -2))
console.log (asciichart.plot (s2))

Console ASCII Line charts in pure Javascript (for NodeJS and browsers)

See Also

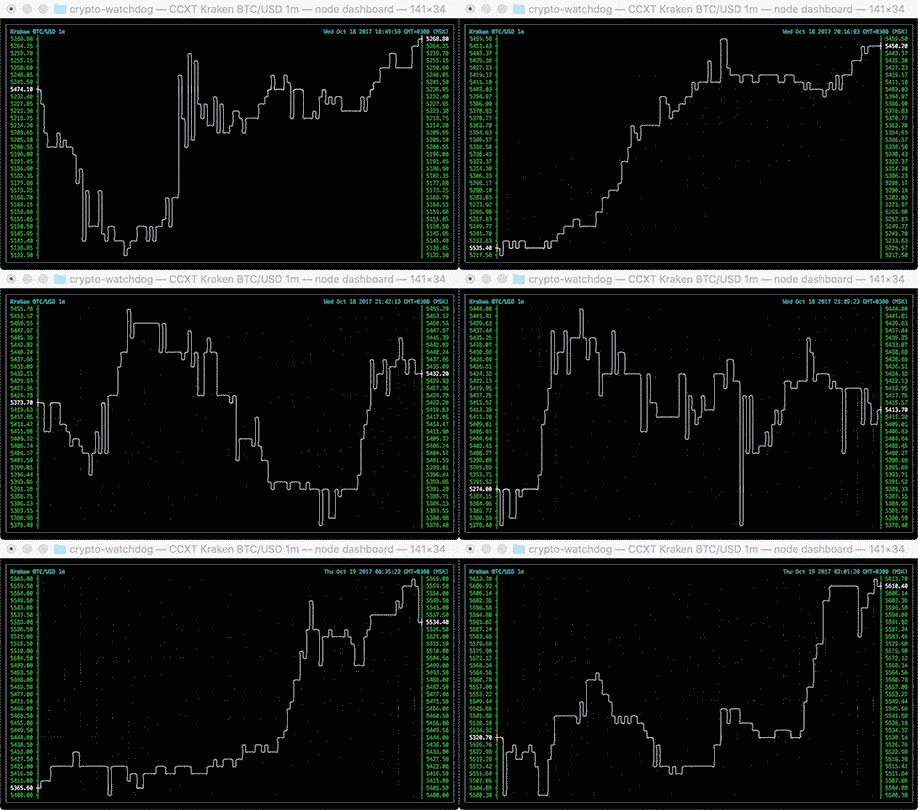
A util by madnight for drawing Bitcoin/Ether/altcoin charts in command-line console: bitcoin-chart-cli.

bitcoin-chart-cli

Ports

Special thx to all who helped port it to other languages, great stuff!

Future work (coming soon, hopefully)

  • multi-line colored charts in console!
  • levels and points on the graph!
  • even better value formatting and auto-scaling!

preview

asciichart's People

Contributors

kroitor avatar xpl avatar

Watchers

James Cloos avatar Eric Petersen avatar Shawn A. Wilson avatar

Recommend Projects

  • React photo React

    A declarative, efficient, and flexible JavaScript library for building user interfaces.

  • Vue.js photo Vue.js

    🖖 Vue.js is a progressive, incrementally-adoptable JavaScript framework for building UI on the web.

  • Typescript photo Typescript

    TypeScript is a superset of JavaScript that compiles to clean JavaScript output.

  • TensorFlow photo TensorFlow

    An Open Source Machine Learning Framework for Everyone

  • Django photo Django

    The Web framework for perfectionists with deadlines.

  • D3 photo D3

    Bring data to life with SVG, Canvas and HTML. 📊📈🎉

Recommend Topics

  • javascript

    JavaScript (JS) is a lightweight interpreted programming language with first-class functions.

  • web

    Some thing interesting about web. New door for the world.

  • server

    A server is a program made to process requests and deliver data to clients.

  • Machine learning

    Machine learning is a way of modeling and interpreting data that allows a piece of software to respond intelligently.

  • Game

    Some thing interesting about game, make everyone happy.

Recommend Org

  • Facebook photo Facebook

    We are working to build community through open source technology. NB: members must have two-factor auth.

  • Microsoft photo Microsoft

    Open source projects and samples from Microsoft.

  • Google photo Google

    Google ❤️ Open Source for everyone.

  • D3 photo D3

    Data-Driven Documents codes.