GithubHelp home page GithubHelp logo

areski / python-nvd3 Goto Github PK

View Code? Open in Web Editor NEW
660.0 660.0 194.0 2.32 MB

Python Wrapper for NVD3 - It's time for beautiful charts

License: Other

Makefile 0.60% Python 79.79% HTML 18.48% Shell 1.12%

python-nvd3's Introduction

Python Wrapper for NVD3 - It's time for beautiful charts

Description

Python-nvd3 is a wrapper for NVD3 graph library

NVD3

NVD3 http://nvd3.org/

D3

Data-Driven Documents http://d3js.org/

Maintainers

Areski & Oz

Contributors

list of contributors

image

Latest Version

Downloads

Supported Python versions

License

NVD3 is an attempt to build re-usable charts and chart components for d3.js without taking away the power that d3.js offers you.

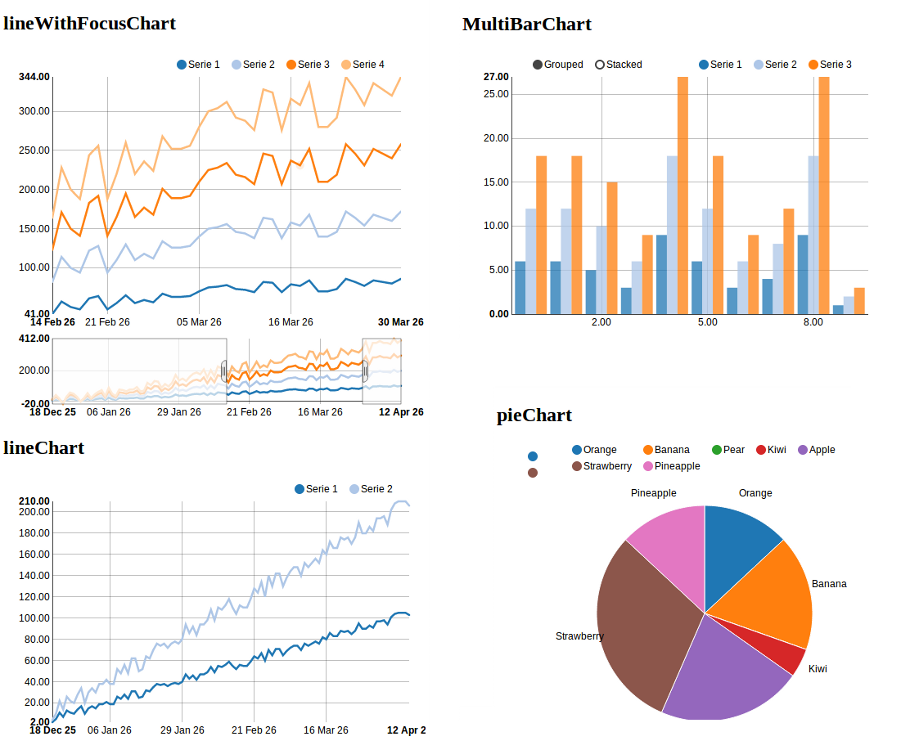
Python-NVD3 makes your life easy! You write Python and the library renders JavaScript for you! These graphs can be part of your web application:

image

Want to try it yourself? Install python-nvd3, enter your python shell and try this quick demo:

>>> from nvd3 import pieChart
>>> chart_name = 'pieChart'
>>> chart = pieChart(name=chart_name, color_category='category20c', height=450, width=450)
>>> xdata = ["Orange", "Banana", "Pear", "Kiwi", "Apple", "Strawberry", "Pineapple"]
>>> ydata = [3, 4, 0, 1, 5, 7, 3]
>>> extra_serie = {"tooltip": {"y_start": "", "y_end": " cal"}}
>>> chart.add_serie(y=ydata, x=xdata, extra=extra_serie)
>>> chart.buildcontent()
>>> print chart.htmlcontent

This will output the following HTML to render a live chart. The HTML could be stored into a HTML file, used in a Web application, or even used via Ipython Notebook:

<div id="pieChart"><svg style="width:450px;height:450px;"></svg></div>
<script>
data_pieChart=[{"values": [{"value": 3, "label": "Orange"},
               {"value": 4, "label": "Banana"},
               {"value": 0, "label": "Pear"},
               {"value": 1, "label": "Kiwi"},
               {"value": 5, "label": "Apple"},
               {"value": 7, "label": "Strawberry"},
               {"value": 3, "label": "Pineapple"}], "key": "Serie 1"}];

nv.addGraph(function() {
    var chart = nv.models.pieChart();
    chart.margin({top: 30, right: 60, bottom: 20, left: 60});
    var datum = data_pieChart[0].values;
            chart.tooltipContent(function(key, y, e, graph) {
                var x = String(key);
                var y =  String(y)  + ' cal';
                tooltip_str = '<center><b>'+x+'</b></center>' + y;
                return tooltip_str;
            });
        chart.showLegend(true);
        chart.showLabels(true);
        chart.donut(false);
    chart
        .x(function(d) { return d.label })
        .y(function(d) { return d.value });
    chart.width(450);
    chart.height(450);
    d3.select('#pieChart svg')
        .datum(datum)
        .transition().duration(500)
        .attr('width', 450)
        .attr('height', 450)
        .call(chart);
});
</script>

Documentation

Check out the documentation on Read the Docs for some live Chart examples!

Installation

Install, upgrade and uninstall python-nvd3 with these commands:

$ pip install python-nvd3
$ pip install --upgrade python-nvd3
$ pip uninstall python-nvd3

Dependencies

D3 and NvD3 can be installed through bower (which itself can be installed through npm). See http://bower.io/ and https://npmjs.org for further information. To install bower globally execute:

$ npm install -g bower

Note : you might prefer to save your npm dependencies locally in a package.json file.

Then in the directory where you will use python-nvd3, just execute the following commands:

$ bower install d3#3.5.17
$ bower install nvd3#1.8.6

This will create a directory "bower_components" where d3 & nvd3 will be saved.

Note : you might prefer to save your bower dependencies locally in a bower.json file. You can also configure the directory where your bower dependencies will be saved adding a .bowerrc file in your project root directory.

Django Wrapper

There is also a django wrapper for nvd3 available: https://github.com/areski/django-nvd3

IPython Notebooks

Python-NVD3 works nicely within IPython Notebooks (thanks to @jdavidheiser)

See the examples directory for an Ipython notebook with python-nvd3.

License

Python-nvd3 is licensed under MIT, see MIT-LICENSE.txt.

Maintainers

If you want to help maintain this project, please get in touch.

python-nvd3's People

Contributors

agorrod avatar airyshift avatar apatil avatar areski avatar ayee avatar bolkedebruin avatar chrissimpkins avatar chrissmejia avatar danmeakin avatar davidbt avatar dzpm avatar freeseacher avatar frewie avatar imom0 avatar jdavidheiser avatar jmduke avatar jnishiyama avatar kbsali avatar ksolan avatar nzjrs avatar oz123 avatar petrdlouhy avatar pignacio avatar prikhi avatar quetzaluz avatar shrenik avatar tnt avatar vdloo avatar virtustate avatar zebulon2 avatar

Stargazers

 avatar  avatar  avatar  avatar  avatar  avatar  avatar  avatar  avatar  avatar  avatar  avatar  avatar  avatar  avatar  avatar  avatar  avatar  avatar  avatar  avatar  avatar  avatar  avatar  avatar  avatar  avatar  avatar  avatar  avatar  avatar  avatar  avatar  avatar  avatar  avatar  avatar  avatar  avatar  avatar  avatar  avatar  avatar  avatar  avatar  avatar  avatar  avatar  avatar  avatar  avatar  avatar  avatar  avatar  avatar  avatar  avatar  avatar  avatar  avatar  avatar  avatar  avatar  avatar  avatar  avatar  avatar  avatar  avatar  avatar  avatar  avatar  avatar  avatar  avatar  avatar  avatar  avatar  avatar  avatar  avatar  avatar  avatar  avatar  avatar  avatar  avatar  avatar  avatar  avatar  avatar  avatar  avatar  avatar  avatar  avatar  avatar  avatar  avatar  avatar

Watchers

 avatar  avatar  avatar  avatar  avatar  avatar  avatar  avatar  avatar  avatar  avatar  avatar  avatar  avatar  avatar  avatar  avatar  avatar  avatar  avatar  avatar  avatar  avatar  avatar  avatar  avatar  avatar  avatar  avatar  avatar  avatar  avatar  avatar  avatar

python-nvd3's Issues

Support for chart titles

While its not an explicit nvd3 feature, it is a d3 one, and I think the Python bindings would be pleasantly simple (passing it as an optional kwarg to the chart object) -- I jerry-rigged something together but if this is something you'd be amenable to I'd love to send over a PR.

will multi chart be supported at some point?

hi,
I'm working on creating line plus stacked bar chart, seems it's supported in nv d3 model: multi chart. Just wonder will this be supported in python wrapper? If already supported, is there example some where I can reference to?

Thx!

python-nvd3 shows nothing and strange look on ipython notebook

The output html by python-nvd3 can not be shown

https://gist.github.com/poc7667/0f2203231fa6d01a3f39

The output on iPython notebook looks terrible(it is so narrow).

CODE

# load nvd3
import random
from IPython import display as d
import nvd3
nvd3.ipynb.initialize_javascript(use_remote=True)


chart3=nvd3.lineWithFocusChart(name="focusChart",height=600)
xdata = [ i['_id'] for i in DATA_SOURCE ]
ydata = [ i['count'] for i in DATA_SOURCE ]
chart3.add_serie(x=xdata,y=ydata,name="monthly allergic", x_is_date=True, x_axis_format="%Y/%m/%d")
chart3.buildhtml()
chart3

with open('demo3.html','w') as f:    
    f.write(chart3.htmlcontent)

Version of iPython and nvd3

% pip3 list | grep ipython                                                                                                     (git)-[master]
ipython (3.1.0)
python-nvd3 (0.13.8)

Sample code errors

The instructions at:

Introduction Page, specifically:

from nvd3 import pieChart

# Open File to write the D3 Graph
output_file = open('test-nvd3.html', 'w')

type = 'pieChart'
chart = pieChart(name=type, color_category='category20c', height=450, width=450)
chart.set_containerheader("\n\n<h2>" + type + "</h2>\n\n")

xdata = ["Orange", "Banana", "Pear", "Kiwi", "Apple", "Strawberry", "Pineapple"]
ydata = [3, 4, 0, 1, 5, 7, 3]

extra_serie = {"tooltip": {"y_start": "", "y_end": " cal"}}
chart.add_serie(y=ydata, x=xdata, extra=extra_serie)
chart.buildhtml()
output_file.write(chart.htmlcontent)

# close Html file
output_file.close()

render html that doesn't work due to some malformed cloudflare refs (missing "http:"):

<link href="//cdnjs.cloudflare.com/ajax/libs/nvd3/1.7.0/nv.d3.min.css" rel="stylesheet" />
<script src="//cdnjs.cloudflare.com/ajax/libs/d3/3.5.5/d3.min.js"></script>
<script src="//cdnjs.cloudflare.com/ajax/libs/nvd3/1.7.0/nv.d3.min.js"></script>

This happens if you do a:

pip install python-nvd3

The problem seems to be present only in the master branch, but seems fixed in develop, so if I PR a fix to the docs, the docs will be inaccurate when a new release goes. Thoughts?

Str conversion of x-axis dates issue

Hi,

I have tried working out from the code, but I cannot figure out why there is a string conversion of x-axis dates in NVD3Chart.py at line 168.

This appears to be causing problems with graphs using dates for their x-axis where the values straddle a boundary between factors of 10, e.g. between 99 and 100. This is because when stored as integers and sorted, they will be listed:

[99, 100]

However, when stored as strings and sorted they will be listed:

['100', '99']

If there is no reason for the string conversion, I would suggest that lines 167-168 simply be erased. However, as there may be a reason for this I have not made the changes myself and made a pull request.

Could you let me know if there is a reason for this conversion? If not, I would be happy to make the necessary (short) changes.

Thanks!

rendering options for the x-axis (e.g. string as opposed to integer)

Hello :)

I am using django-nvd3, and I am wondering how I can have the x-axis render in python-nvd3 as a string, as opposed to an integer.

In reality, the number I want to display is a date and time concatenated together. Are there more elegant rendering options (e.g. only date, and then tooltip with the date and time)?

Vielen dank!

How to render HTML output in Sublime Text

Hey,

fist, I am really sorry for bringing this up here, but I have no idea whereelse to post this.

I am used to work with R Studio and as I like my output to be available on a Django-based website, I started using Python more for the analytical part aswell. One of the problems I have is finding an editor similar to RStudio as it allows me to plot interactive charts just like any other output. I have not found an equivalent for Python . It would be fantastic to render to HTML output provided by python-nvd3 in Sublime. I know it is possible in IPyhon, but for a number of reasons I can't say I like working with IPython. Can you help me finding a solution for Sublime? I have been googling, but not knowing what I am looking for, I have not been successful.

Thank you for your time and patience.
I am really looking forward to use Python-NVD3.

colon in content.html when adding additional chart attributes

Hi All,
in content.html in line 83 there is a colon at the and.
{% if value is string and value.startswith(".") %}:

Since I use that code:
chart_attr['yAxis'] = str(".tickFormat(function(d){return d3.format('.2s')(d).replace('k', '%s').replace('M', '%s').replace('G', '%s')});" % (tsd, mio, mrd))

I have this colon in the generate JS and it throws an error: Uncaught SyntaxError: Unexpected token :

Not sure if I'm doing something wrong here and the colon is needed for something other reason I connot see ...

ipynb.py not installed via pip in version 0.11.0

When running "pip install python-nvd3==0.11.0" the file ipynb.py is not installed as part of the package despite appearing in the repository.

This means a standard installation via pip does not support the IPython Notebook integration defined in the README.

Ipython demo does not work

Current Ipython demo code doesn't work

image

Out[3] will always be an empty space as showed above

tested with
-python2.7.7/3.4.0
-ipython 1.2.1/2.0.0/2.1.0
-python-nvd3 0.12.2/master

change the last lline of In[3] from

chart2

to

d.HTML(str(chart2))

solves the problem

Add Donut Option to Pie Chart

I don't doubt that I am missing something, but it seems as though there is no donut option for the pie chart... I made the tiny addition, and I can make a PR if desired. By the way, great library!

Chart names with spacing

Creating a lineChart (and presumably any other chart) with a name that has spaces in the name (e.g. name="Price over time") results in some seriously bad mojo, as it appearspython-nvd3` doesn't parse those characters correctly, resulting in output like:

    d3.select('#Price over time svg')
        .datum(data_Price over time)
        .transition().duration(500)
        .attr('width', 400)

Which of course is invalid.

There are, I'd imagine, a few ways to approach this problem: since the string is primarily used internally (setting the id, deduping the data object), I'd argue the best way to handle this is pass the whole thing through a stripper regex.

Enable dashed lines

Effectively allow the wrapper to take options for the style property stroke-dasharray

"slugify chart names" breaks existing code

The slugify call added with dd7077d breaks existing code as slugify converts underscores to dashes leading to broken javascript:

$(function(){nv.addGraph(function() {
        var chart = nv.models.pieChart();
        chart.x(function(d) { return d.label })
            .y(function(d) { return d.value });
        chart.height(450);

        chart.margin({top: 30, right: 60, bottom: 20, left: 60})
        chart.showLegend(true);
        chart.showLabels(true);
        chart.donut(false);
        d3.select('#piechart-container svg')
            .datum(data_piechart-container[0].values)
            .transition().duration(500)
            .attr('height', 450)
            .call(chart);

    return chart;
});
});data_piechart-container=[{"values": [{"value": "0.03558216", "label": "X"}, {"value": "0.01824000", "label": "Y"}, {"value": "0.00000322", "label": "Z"}, {"value": "1234.43777452", "label": "A"}], "key": "Serie 1"}];

Outputting to pdf

Hi, thanks for an awesome library!

I can't seem to find a way to output the graphs to .pdf or a similar format? Have you implemented that? Or is that something you've considered implementing?

Not show tooltips for discreteBarChart

Is there currently a way to not show tooltips for a discreteBarChart? Basically the resultant chart would be in the style of this chart: http://nvd3.org/examples/discreteBar.html where it calls tooltips(false).

This would be handy because currently the way that NVD3 renders tooltips seems to allow for the tooltip to extend past the edges of the chart itself, which then means that the tooltip can be cut off for certain values.

No data available error in resulting html

Hi! Im trying to use python-nvd3-0.13.2 with python-3.4.1 on MacOS 10.9.4 and there is some issue.
PieChart from examples works fine, but multiBarChart - not really
Code:

#!/usr/bin/env python3

import nvd3
import random

#Open File to write the D3 Graph
output_file = open('test4.html', 'w')

chart = nvd3.multiBarChart(name="multiBarChart",height=450)

xdata = [1,2,3,4,5]
ydata = xdata
print (xdata, ydata)
chart.add_serie(x=xdata,y=ydata,name="Test")
chart.buildhtml()

output_file.write(chart.htmlcontent)

#close Html file
output_file.close()

No data in resulting html.

Documentation down

The documentation site http://python-nvd3.readthedocs.org/ leads me to a blank page. Has it moved, or am I missing something?

nvd3 fork and new base project maintainer (thoughts and impact)

Hi All, very nice project. :)

We've been scoping a few js visualization libraries for supporting some interactive analysis with a Python based analysis tool. With our heavy use of IPython notebook internally for interactive sessions, we naturally discovered thepython-nvd3 library.

I wanted to get an understanding for the recent forking of the nvd3 library, and how that might impact this project? Any thoughts and feelings, I would be interested to hear:
https://github.com/liquidpele/nvd3

Forgive me in advance if I've overlooked something already mentioned about this, it's late where I am, and I'm ๐Ÿ˜ช !

Again, thank you.

Running python-nvd3 within IPython

Hi -

I'm having issues installing python nvd3 on a vm to run with Python 3.3 and a new IPython notebook:

Uninstalling python-nvd3:
  Successfully uninstalled python-nvd3
Downloading/unpacking python-nvd3
  Downloading python-nvd3-0.11.0.tar.gz
  Running setup.py (path:/tmp/pip_build_root/python-nvd3/setup.py) egg_info for package python-nvd3

    file nvd3.py (for module nvd3) not found
    warning: no previously-included files matching '*.pyc' found anywhere in distribution
Requirement already satisfied (use --upgrade to upgrade): setuptools in /usr/local/lib/python3.3/dist-packages (from python-nvd3)
Installing collected packages: python-nvd3
  Running setup.py install for python-nvd3
    file nvd3.py (for module nvd3) not found
    file nvd3.py (for module nvd3) not found

    file nvd3.py (for module nvd3) not found
    Installing nvd3 script to /usr/local/bin
    file nvd3.py (for module nvd3) not found
Successfully installed python-nvd3
Cleaning up...

Then as per the demo notebook:

import random
from IPython import display as d
import nvd3
nvd3.ipynb.initialize_javascript(use_remote=True)

which gives:

---------------------------------------------------------------------------
AttributeError                            Traceback (most recent call last)
<ipython-input-27-854c4a3cb276> in <module>()
      2 from IPython import display as d
      3 import nvd3
----> 4 nvd3.ipynb.initialize_javascript(use_remote=True)

AttributeError: 'module' object has no attribute 'ipynb'

I thought I maybe using a stale version of the package, but same effect after running pip3 install --upgrade pip.

What am I missing?

Scatter Plot uses `chart.scatter.onlyCircles(false);`

The part chart.scatter.onlyCircles(false); in the javascript code generated by the scatter plot example is throwing a javascript error: Uncaught TypeError: undefined is not a function.

Uncommenting this line cures the problem. Are there any API changes or typos in the examples?

color_category not handled in pieChart

Hello,

I have found a small bug. The color_categoryparam is not taken into account in pieChart. This is due to a missing section in the piechart.html template overriding the default.
Adding this section solves the problem.

{% if not chart.color_list and chart.color_category %}
        chart.color(d3.scale.{{ chart.color_category }}().range());
{% endif %}

Changing location of linked Javascript and CSS (assets_directory and more...)

Hi and thanks a lot for the effort that has gone into this code! I have been trying out the library in the past days and I am very satisfied. However, I faced a little problem that maybe is related to a an unnecessary design issue.

Python-nvd3 depends on the availability of D3 and nvd3, currently resolved by requiring bower as yet another dependency. This is not very nice, as D3 and nvd3 are just Javascripts that could be simply linked to their original sources, or placed anywhere else in the server.

What is really annoying is that the relative location of the scripts is, at the time of writing, hard-coded as an attribute to the class NVD3Chart which is then used to reconstruct three (3!) paths with more hard-coded bits (paths to d3.min.js, nv.d3.min.js and nv.d3.css). This works just fine if one is statically generating HTML in the same folder as the python script, but it breaks if the web server works on virtual directories, like Flask, see the question at http://stackoverflow.com/questions/19576918/not-able-to-use-python-nvd3

Is it possible to pass python-nvd3 different locations for these scripts?

multiBarHorizontalChart svg style bug

I have done the following sequence and got the HTML svg tag - the style in the svg is corrupted. I use version - 0.12.2 of nvd3.

chart = multiBarHorizontalChart(name='multiBarHorizontalChart', height=400, width=400)
chart.buildhtmlheader()
chart.buildcontainer()
chart.set_containerheader("\n\n<h2>hello world</h2>\n\n")
chart.add_serie(name="Serie 1", y=ydata, x=xdata)
chart.add_serie(name="Serie 2", y=y2data, x=xdata)
chart.buildhtml()
chart.htmlcontent

The output:

 <svg style="style="width:400px;height:400px;"width:400px;height:400px;"></svg>

Avoid tags being intepreted data passed to templates

To avoid generating javascript that contains tags and therefore breaks a page (or worse xss) sanitise the data coming in.

e.g.

from nvd3 import pieChart
type = 'pieChart'
chart = pieChart(name=type, color_category='category20c', height=450, width=450)
xdata = ["</script>Orange", "Banana", "Pear", "Kiwi", "Apple", "Strawberry", "Pineapple"]
ydata = [3, 4, 0, 1, 5, 7, 3]
extra_serie = {"tooltip": {"y_start": "", "y_end": " cal"}}
chart.add_serie(y=ydata, x=xdata, extra=extra_serie)
chart.buildcontent()
print chart.htmlcontent

Will generate:

    <div id="piechart"><svg style="width:450px;height:450px;"></svg></div>
    <script>
      data_piechart=JSON.parse([{"values": [{"value": 3, "label": "</script>Orange"}, {"value": 4, "label": "Banana"}, {"value": 0, "label": "Pear"}, {"value": 1, "label": "Kiwi"}, {"value": 5, "label": "Apple"}, {"value": 7, "label": "Strawberry"}, {"value": 3, "label": "Pineapple"}], "key": "Serie 1"}]);

    nv.addGraph(function() {
        var chart = nv.models.pieChart();
        chart.margin({top: 30, right: 60, bottom: 20, left: 60});
        var datum = data_piechart[0].values;

    chart.tooltipContent(function(key, y, e, graph) {
          var x = String(key);
              var y =  String(y)  + ' cal';

              tooltip_str = '<center><b>'+x+'</b></center>' + y;
              return tooltip_str;
              });
        chart.showLabels(true);
            chart.donut(false);
    chart.showLegend(true);

        chart
            .x(function(d) { return d.label })
            .y(function(d) { return d.value });

        chart.width(450);
        chart.height(450);

            d3.select('#piechart svg')
            .datum(datum)
            .transition().duration(500)
            .attr('width', 450)
            .attr('height', 450)
            .call(chart);
        });
    </script>

This could be fixed by stripping the tags from the incoming data, another approach would be to use a filter like escapejs that is in django with JSON.parse.

diff --git a/nvd3/templates/piechart.html b/nvd3/templates/piechart.html
index 63d8ca5..cc89569 100644
--- a/nvd3/templates/piechart.html
+++ b/nvd3/templates/piechart.html
@@ -4,7 +4,7 @@
 {% extends "content.html" %}
 {% block body %}

-    data_{{ chart.name }}={{ chart.series_js }};
+    data_{{ chart.name }}={{ chart.series_js|striptags }};

     nv.addGraph(function() {
         var chart = nv.models.{{ chart.model }}(){% if chart.use_interactive_guideline %}.useInteractiveGuideline(true){% endif %};

Feature Request: Support numpy.int64 in IPython notebook.

Currently, loading data from pandas DataFrames seems to be problematic as pandas uses numpy.int64 types, which apparently (?) aren't fully supported by python-nvd3 when displayed in IPython. It would be great if this was natively supported, so one could take data directly from the pandas DataFrame without converting back to long/int.

For example:

# This demo requires the installation of the python-nvd3 module.
# This can be downloaded from https://github.com/areski/python-nvd3 (the zip on the right)
# and installed via "pip install path_to_zip".
import random
from IPython import display as d
import nvd3
nvd3.ipynb.initialize_javascript(use_remote=True)

import numpy as np
import pandas as pd

df = pd.DataFrame({'x': range(nb_element), 'y': [i * random.randint(1, 10) for i in     range(nb_element)]})


chart3=nvd3.lineWithFocusChart(name="focusChart",height=450)
nb_element = 100
xdata = list(df['x'].values)
ydata = list(df['y'].values)
chart3.add_serie(x=xdata,y=ydata,name="random data")
chart3

yields "<nvd3.lineWithFocusChart.lineWithFocusChart instance at 0x0000000008BDE988>", while

# This demo requires the installation of the python-nvd3 module.
# This can be downloaded from https://github.com/areski/python-nvd3 (the zip on the right)
# and installed via "pip install path_to_zip".
import random
from IPython import display as d
import nvd3
nvd3.ipynb.initialize_javascript(use_remote=True)

import numpy as np
import pandas as pd

df = pd.DataFrame({'x': range(nb_element), 'y': [i * random.randint(1, 10) for i in     range(nb_element)]})


chart3=nvd3.lineWithFocusChart(name="focusChart",height=450)
nb_element = 100
xdata = list(long(x) for x in df['x'].values)
ydata = list(long(x) for x in df['y'].values)
chart3.add_serie(x=xdata,y=ydata,name="random data")
chart3

yields the correct graph displayed inline in IPython notebook.

charts under ssl

Hi,

I'm having an issue with ssl connections.

The link to nvd3.org is hard coded in:
https://github.com/areski/python-nvd3/blob/master/nvd3/NVD3Chart.py#L139
and
https://github.com/areski/python-nvd3/blob/master/nvd3/NVD3Chart.py#L143

When ssl is invoked, browser (e.g. chrome) return:

[blocked] The page at xxx ran insecure content from http://nvd3.org/src/nv.d3.css.
[blocked] The page at xxx ran insecure content from http://nvd3.org/lib/d3.v2.js.
[blocked] The page at xxx ran insecure content from http://nvd3.org/nv.d3.js.

One alternative would be write url as //nvd3.org/src/nv.d3.css instead of http://nvd3.org/src/nv.d3.css. But nvd3.org DOES NOT HAVE SSL protocol enabled :(

Any ideas ?

ps.: I'm asking because this could lead to copy the css and js from nvd3.org to project and i don't like this idea.

String label problem in multiBarChart

Hi

Thanks for your work.
I have a problem. String are replaced by NaN in bar chart. See for example this code:

thanks again

from nvd3 import multiBarChart


# Open File for test
output_file = open('test_multiBarChart.html', 'w')

type = "multiBarChart"
chart = multiBarChart(name='mygraphname', height=400, width=600)
chart.set_containerheader("\n\n<h2>" + type + "</h2>\n\n")
xdata = ["A", "B", "C", "D", "E", "F", "G"]
ydata = [3, 12, -10, 5, 25, -7, 2]

extra_serie = {"tooltip": {"y_start": "", "y_end": " cal"}}
chart.add_serie(y=ydata, x=xdata, extra=extra_serie)

chart.buildhtml()
output_file.write(chart.htmlcontent)
# ---------------------------------------

# close Html file
output_file.close()

slugify_unicode in NVD3Chart.py

I'm getting an error as follows when I try to use NVD3Chart.py:

from .NVD3Chart import NVD3Chart
  File "/usr/local/lib/python2.7/dist-packages/nvd3/NVD3Chart.py", line 15, in <module>
    from slugify import slugify_unicode
ImportError: cannot import name slugify_unicode

Indeed:

>>> from slugify import slugify_unicode
Traceback (most recent call last):
  File "<stdin>", line 1, in <module>
ImportError: cannot import name slugify_unicode

slugify.slugify_unicode is being used once as follows:

from slugify import slugify_unicode
def slugify_name(self, name):
        """Slufigy name with underscore"""
        self.name = slugify_unicode(name, separator='_')

So this is a simple fix:

import slugify
def slugify_name(self, name):
        """Slufigy name with underscore"""
        self.name = slugify.slugify(name, separator='_')

The fix works for me without any new issues.

add option to set chart attr like forceY

Hi,

I would like to add some support for setting a chart attr (eg. forcing the range of my y axis:

chart.forceY([-10,10]);

Going through the code, the place to add this seems to be in 'buildjschart'.

Regarding the implementation: would you pass this type of config via the init (eg force_y, y_domain parameters) like show_legend? Another option would be to pass a chart_attr dict. This could make setting various attr more easy (new to nvd3 so do not yet know if there are many :))?

Regards

show axis labels in lineChart

Hey,

does python-nvd3 support showing the axis labels for line Charts? I'm using the create_x_axis() function as found in the documention to specify the label name, but noticed that in the underlying generated D3 code, showLabels(true) is not called to enable them.

When digging into the source code, I also found this comment suggesting it's only supported in the pieChart.

Would it be possible to add axis label support to the line chart, or could you point me to an example how to enable it? Thanks guys!

Build shown as broken in pypi

Hi,

If you look at:
https://pypi.python.org/pypi/python-nvd3/

You will see indaction that the build is not working. That is because the old README.rst there is still pointing to the master branch. The development is now taking place on the branch develop, so we better update this.

It looks much more inviting to install a software with a green light :-)

Maybe it's time to release 0.12.3 ?

Oz

rotateLabels is not found. Is there any other way to handle it now?

I noticed that the older version that I was using (0.11.0) allowed for '.rotateLabels()' to be set for creating xAxis and yAxis but having updated to the latest version, this no longer works.

Is there now a different way of doing something like this? I was not able to find any mention of it anywhere.
Thanks!

strings as tick labels

Is it possible to make strings as axis tick labels? Like a factor in R. If not, I can try to put it in.

How to manually specify color to line chart

I am trying to manually specify color for a lineChart. And the **kwargs method is not picking up the colors that I am specifying. Below is the code. Am I doing something wrong?

chart = nvd3.lineChart(name='lineChart', height=400, width=800, x_is_date=False, y_axis_format=".0f")

xdata = np.arange(len(af.DATE)).tolist()
ydata1 = af.A.astype('float').tolist()
ydata2 = af.B.astype('float').tolist()
ydata3 = af.C.astype('float').tolist()


kwargs_a = {'color': '#E01B5D'}
kwargs_b = {'color': "blue"}
kwargs_c = {'color': '#FFFFFF'}

chart.add_serie( name="A", y=ydata1, x=xdata, **kwargs_a)
chart.add_serie( name="B", y=ydata2, x=xdata, **kwargs_b)
chart.add_serie( name="C", y=ydata3, x=xdata, **kwargs_c)

chart.buildhtml()
fd=open("testnvd3.html", "w")
fd.write(chart.htmlcontent)
fd.close()

Is it possible to add a Y axis range?

This is talked about previously in Issue #13. The proposed solution is to use add_chart_extras(extras), but it's not clear to me how to use this to set the forceY axis property. I've tried about a dozen different specifications, but the information doesn't seem to pass through. Since it's pretty important that my charts start at 0 on the Y axis, I just want to make sure I am not missing something obvious before I delve into the code and fork the project.

EDIT:
To add an example, it seems to me like:

mychart.add_chart_extras("chart.forceY([0]);")

should allow for the chart to start at 0.

Recent refactoring breaks chart_attr argument parsing

Hi,

Possibly due to patch acea32f, I have errors with latest python-nvd3 0.12.2 (and django-nvd3 0.7.4) when using chart_attr attributes.

An example: I succesfully used to use to display my graph with log scale on the X axis, with labels and forcing min/max on the Y axis:

    charttype = "lineChart"
    context['data'] = {
                        'charttype': charttype,
                        'chartdata': chartdata,
                        'chartcontainer': chartcontainer,
                        'extra': {
                                  'x_is_date': False,
                                  'x_axis_format': '',
                                  'tag_script_js': True,
                                  'jquery_on_ready': False,
                                  'chart_attr': {
                                                 'xScale':'(d3.scale.log())',
                                                 'xAxis.tickValues':xdata,
                                                 'forceY':[0, maxValue],
                                                 'xAxis.axisLabel':'"concentration"',
                                                 'yAxis.axisLabel':'"time"',
                                                 },
                                  }
                        }

None of these chart_attr attributes work anymore. If I leave at least one them I get this error in Django 1.5:

/usr/local/lib/python2.7/dist-packages/nvd3/templates/content.html in top-level template code

            {% if type(value) == str and value.startswith(".") %}:

    ...

โ–ผ Local vars
Variable    Value
attr    'xScale'
self    <TemplateReference u'./content.html'>
chart   <nvd3.lineChart.lineChart instance at 0x443ad40>
value   '(d3.scale.log())'
range   <type 'xrange'>
dict    <function <lambda> at 0x4925938>
lipsum  <function generate_lorem_ipsum at 0x48a3410>
str     Undefined
cycler  <class 'jinja2.utils.Cycler'>
joiner  <class 'jinja2.utils.Joiner'>
type    Undefined
loop    <LoopContext 3/2>

Note the type Undefined and the value (which could be any of my chart_attr strings). I looked further, it seems the issue is linked to the new nvd3/templates/content.html file (as shown in the error above).

Is there an API change, or has a bug been introduced?

Thanks.

'nvd3_tags' is not a valid tag library

The lib show me this:

'nvd3_tags' is not a valid tag library: Template library nvd3_tags not found, tried django.templatetags.nvd3_tags,django.contrib.staticfiles.templatetags.nvd3_tags,django.contrib.admin.templatetags.nvd3_tags

iPython and nvd3-python

The readme says iPythone is broken but the example just has to be updated.

    from IPython.display import HTML
    import nvd3
    nvd3.ipynb.initialize_javascript(use_remote=True)
    // ...
    chart2.buildcontent()
    HTML(chart2.htmlcontent)

Python 3 Support

I'm running Django + Python 3.4 and had to make a couple of tweaks to get this to work (I'm using django-nvd3, but the issue seem to be in this package)

Basically it was as simple as replacing calls to unicode() with calls to str() in django_nvd3/templatetags/nvd3_tags.py lines 48 and 94

(also see comment on here areski/django-nvd3#22 which was a different Python 3 tweak needed to some of the demo code for django-nvd3)

Recommend Projects

  • React photo React

    A declarative, efficient, and flexible JavaScript library for building user interfaces.

  • Vue.js photo Vue.js

    ๐Ÿ–– Vue.js is a progressive, incrementally-adoptable JavaScript framework for building UI on the web.

  • Typescript photo Typescript

    TypeScript is a superset of JavaScript that compiles to clean JavaScript output.

  • TensorFlow photo TensorFlow

    An Open Source Machine Learning Framework for Everyone

  • Django photo Django

    The Web framework for perfectionists with deadlines.

  • D3 photo D3

    Bring data to life with SVG, Canvas and HTML. ๐Ÿ“Š๐Ÿ“ˆ๐ŸŽ‰

Recommend Topics

  • javascript

    JavaScript (JS) is a lightweight interpreted programming language with first-class functions.

  • web

    Some thing interesting about web. New door for the world.

  • server

    A server is a program made to process requests and deliver data to clients.

  • Machine learning

    Machine learning is a way of modeling and interpreting data that allows a piece of software to respond intelligently.

  • Game

    Some thing interesting about game, make everyone happy.

Recommend Org

  • Facebook photo Facebook

    We are working to build community through open source technology. NB: members must have two-factor auth.

  • Microsoft photo Microsoft

    Open source projects and samples from Microsoft.

  • Google photo Google

    Google โค๏ธ Open Source for everyone.

  • D3 photo D3

    Data-Driven Documents codes.