Use graphviz with pure java. Create graphviz models using java code and convert them into nice graphics.
To execute the graphviz layout engine, one of these options is used:
- If the machine has graphviz installed and a
dotcommand is available, spawn a new process runningdot. - Use this javascript version of graphviz and execute it on the V8 javascript engine. This is done with the bundled J2V8 library.
- Alternatively, the javascript can be executed on Java's own Nashorn or GraalVM engine.
The method(s) to be used can be configured with the Graphviz.useEngine() method.
This project is available via Maven:
<dependency>
    <groupId>guru.nidi</groupId>
    <artifactId>graphviz-java</artifactId>
    <version>0.12.1</version>
</dependency>Graphviz-java uses the SLF4J facade to log. Users must therefore provide a logging implementation like LOGBack
<dependency>
    <groupId>ch.qos.logback</groupId>
    <artifactId>logback-classic</artifactId>
    <version>1.2.3</version>
</dependency>
or Log4j
<dependency>
    <groupId>org.apache.logging.log4j</groupId>
    <artifactId>log4j-core</artifactId>
    <version>2.12.0</version>
</dependency>
<dependency>
    <groupId>org.apache.logging.log4j</groupId>
    <artifactId>log4j-slf4j-impl</artifactId>
    <version>2.12.0</version>
</dependency>The API is separated into a mutable and immutable part.
The basic usage is as follows (assuming import static guru.nidi.graphviz.model.Factory.*).
Graph g = graph("example1").directed()
        .graphAttr().with(Rank.dir(LEFT_TO_RIGHT))
        .with(
                node("a").with(Color.RED).link(node("b")),
                node("b").link(to(node("c")).with(Style.DASHED))
        );
Graphviz.fromGraph(g).height(100).render(Format.PNG).toFile(new File("example/ex1.png"));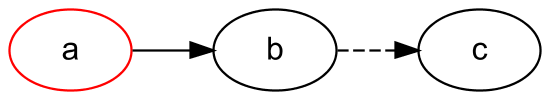
Global attributes are set using the graphAttr, linkAttr and nodeAttr methods.
Nodes are styled using the with method.
To style edges, use the static method to which returns a Link that also has a with method.
The with method accepts predefined attributes like Style, Arrow or Shape
as well as everything defined in the Graphviz reference
e.g. with("weight", 5)
Attention: Node a = node("a"); a.with(Color.RED); Is not working as it might be expected.
All "mutating" methods like with on nodes, links and graphs create new objects and leave the original object unchanged.
So in the example above, variable a contains a node that is NOT red.
If you want a red node, do a = a.with(Color.RED) or use the mutable API.
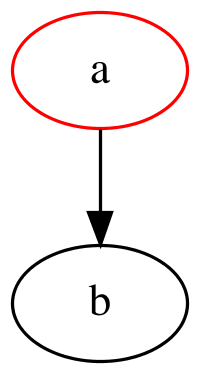
MutableGraph g = mutGraph("example1").setDirected(true).add(
        mutNode("a").add(Color.RED).addLink(mutNode("b")));
Graphviz.fromGraph(g).width(200).render(Format.PNG).toFile(new File("example/ex1m.png"));
There is a third possibility to use the API, based on the mutable version.
Its form is closer to the way dot files are written.
In the lambda of the MutableGraph.use method, all referenced nodes, links and graphs are automatically added to the parent graph,
without explicitly calling the add method.
MutableGraph g = mutGraph("example1").setDirected(true).use((gr, ctx) -> {
    mutNode("b");
    nodeAttrs().add(Color.RED);
    mutNode("a").addLink(mutNode("b"));
});
Graphviz.fromGraph(g).width(200).render(Format.PNG).toFile(new File("example/ex1i.png"));
This corresponds to the following dot file:
digraph example1 {
    b
    node[color=red]
    a -> b
}
Kotlin DSL is still experimental. Things can change and any feedback is very welcome.
<dependency>
    <groupId>guru.nidi</groupId>
    <artifactId>graphviz-kotlin</artifactId>
    <version>0.12.1</version>
</dependency>
The kotlin DSL based on the imperative API. It defines that following elements:
edge,node,graphvariables to define global attributes.-,/,[]operators on MutableNode which link, define ports, set attributes.-,/,[]operators on String so that strings can be used directly to define nodes.-,[]operators on Link which allow to chain links and set attributes.
To enable the functions, use import guru.nidi.graphviz.*
graph(directed = true) {
    edge["color" eq "red", Arrow.TEE]
    node[Color.GREEN]
    graph[Rank.dir(LEFT_TO_RIGHT)]

    "a" - "b" - "c"
    ("c"[Color.RED] - "d"[Color.BLUE])[Arrow.VEE]
    "d" / NORTH - "e" / SOUTH
}.toGraphviz().render(PNG).toFile(File("example/ex1.png"))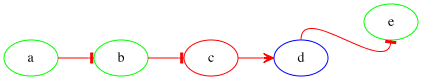
Dot files can be parsed and thus manipulated. Given this file color.dot:
graph {
    { rank=same; white}
    { rank=same; cyan; yellow; pink}
    { rank=same; red; green; blue}
    { rank=same; black}

    white -- cyan -- blue
    white -- yellow -- green
    white -- pink -- red

    cyan -- green -- black
    yellow -- red -- black
    pink -- blue -- black
}
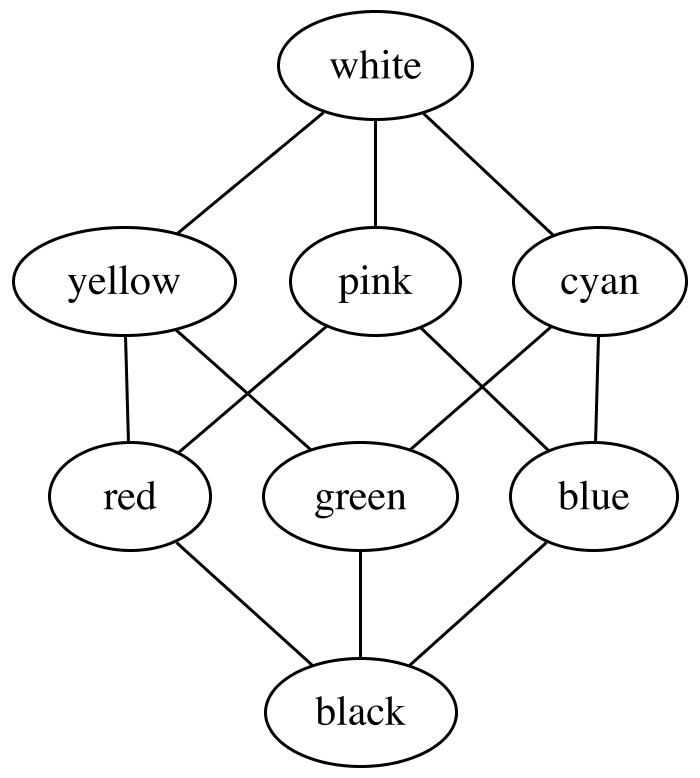
Then running this program:
try (InputStream dot = getClass().getResourceAsStream("/color.dot")) {
MutableGraph g = new Parser().read(dot);
Graphviz.fromGraph(g).width(700).render(Format.PNG).toFile(new File("example/ex4-1.png"));
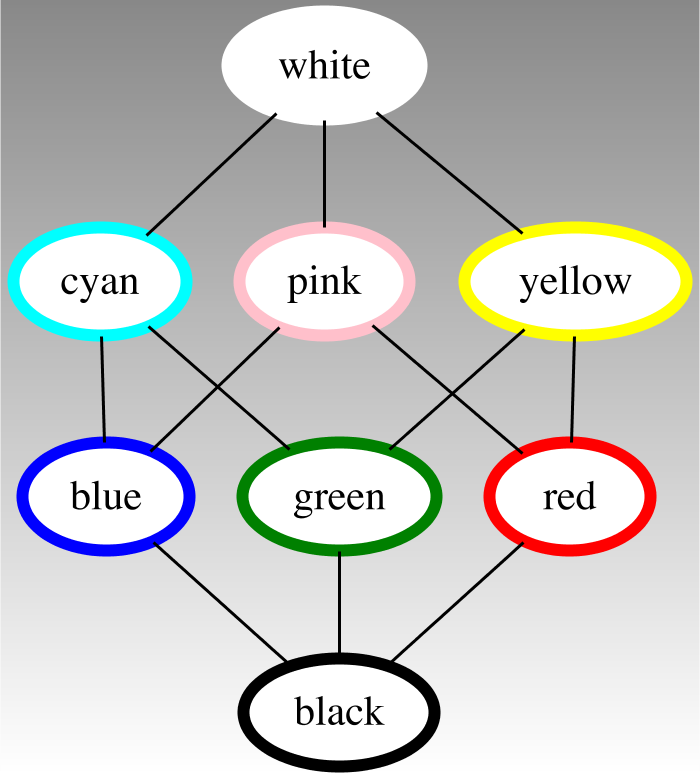
g.graphAttrs()
.add(Color.WHITE.gradient(Color.rgb("888888")).background().angle(90))
.nodeAttrs().add(Color.WHITE.fill())
.nodes().forEach(node ->
node.add(
Color.named(node.name().toString()),
Style.lineWidth(4).and(Style.FILLED)));
Graphviz.fromGraph(g).width(700).render(Format.PNG).toFile(new File("example/ex4-2.png"));
}results in this graphics:
Node
        main = node("main").with(Label.html("<b>main</b><br/>start"), Color.rgb("1020d0").font()),
        init = node(Label.markdown("**_init_**")),
        execute = node("execute"),
        compare = node("compare").with(Shape.RECTANGLE, Style.FILLED, Color.hsv(.7, .3, 1.0)),
        mkString = node("mkString").with(Label.lines(LEFT, "make", "a", "multi-line")),
        printf = node("printf");

Graph g = graph("example2").directed().with(
        main.link(
                to(node("parse").link(execute)).with(LinkAttr.weight(8)),
                to(init).with(Style.DOTTED),
                node("cleanup"),
                to(printf).with(Style.BOLD, Label.of("100 times"), Color.RED)),
        execute.link(
                graph().with(mkString, printf),
                to(compare).with(Color.RED)),
        init.link(mkString));

Graphviz.fromGraph(g).width(900).render(Format.PNG).toFile(new File("example/ex2.png"));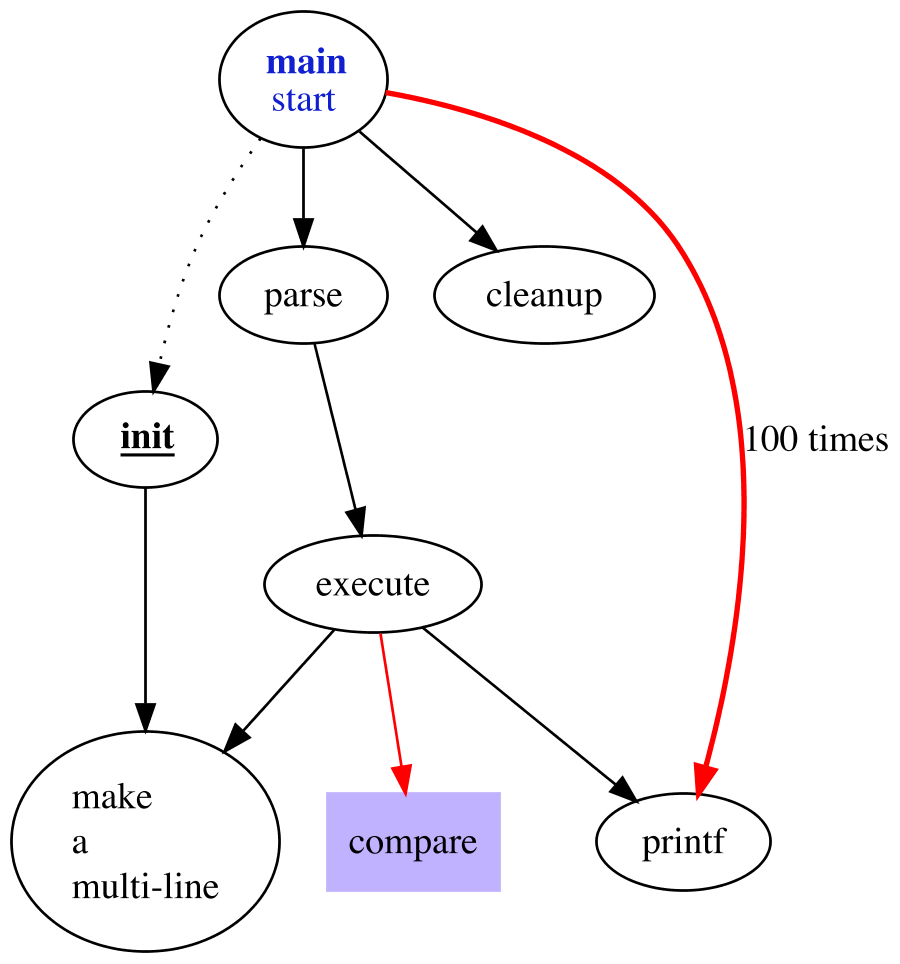
import static guru.nidi.graphviz.attribute.Records.*;
import static guru.nidi.graphviz.model.Compass.*;
Node
node0 = node("node0").with(Records.of(rec("f0", ""), rec("f1", ""), rec("f2", ""), rec("f3", ""), rec("f4", ""))),
node1 = node("node1").with(Records.of(turn(rec("n4"), rec("v", "719"), rec("")))),
node2 = node("node2").with(Records.of(turn(rec("a1"), rec("805"), rec("p", "")))),
node3 = node("node3").with(Records.of(turn(rec("i9"), rec("718"), rec("")))),
node4 = node("node4").with(Records.of(turn(rec("e5"), rec("989"), rec("p", "")))),
node5 = node("node5").with(Records.of(turn(rec("t2"), rec("v", "959"), rec("")))),
node6 = node("node6").with(Records.of(turn(rec("o1"), rec("794"), rec("")))),
node7 = node("node7").with(Records.of(turn(rec("s7"), rec("659"), rec(""))));
Graph g = graph("example3").directed()
.graphAttr().with(Rank.dir(LEFT_TO_RIGHT))
.with(
node0.link(
between(port("f0"), node1.port("v", SOUTH)),
between(port("f1"), node2.port(WEST)),
between(port("f2"), node3.port(WEST)),
between(port("f3"), node4.port(WEST)),
between(port("f4"), node5.port("v", NORTH))),
node2.link(between(port("p"), node6.port(NORTH_WEST))),
node4.link(between(port("p"), node7.port(SOUTH_WEST))));
Graphviz.fromGraph(g).width(900).render(Format.PNG).toFile(new File("example/ex3.png"));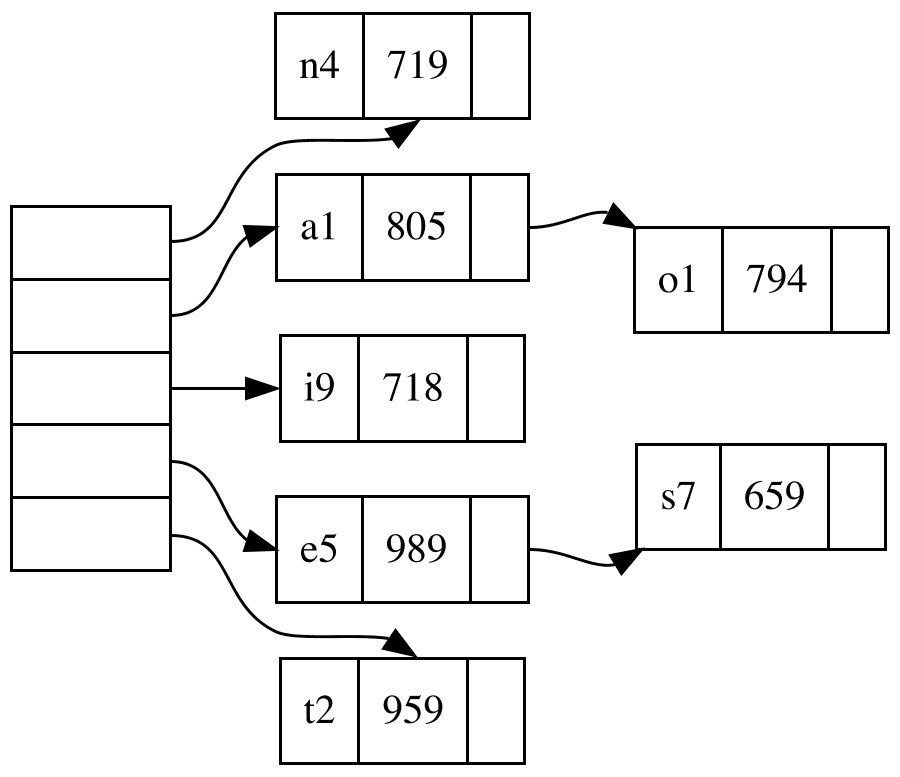
Images can be included in graphviz in two ways.
One possibility is using the <img> tag inside a HTML label:
Graphviz.useEngine(new GraphvizCmdLineEngine());
Graphviz g = Graphviz.fromGraph(graph()
        .with(node(Label.html("<table border='0'><tr><td><img src='graphviz.png' /></td></tr></table>"))));
g.basedir(new File("example")).render(Format.PNG).toFile(new File("example/ex7.png"));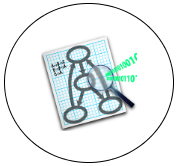
Because viz.js does not support <img> tags, this works only when using the command line engine.
The other possibility is the image attribute of a node:
Graphviz g = Graphviz.fromGraph(graph()
        .with(node(" ").with(Size.std().margin(.8, .7), Image.of("graphviz.png"))));
g.basedir(new File("example")).render(Format.PNG).toFile(new File("example/ex8.png"));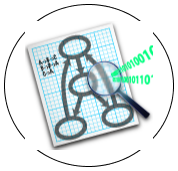
This works with all engines.
In both cases, the basedir() method can be used to define where relative paths are looked up.
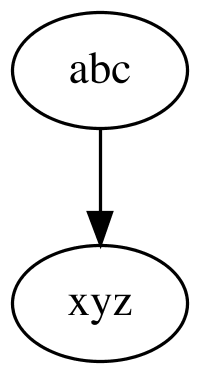
The size of the resulting image, the rendering engine and the output format can be configured:
Graphviz.useEngine(new GraphvizCmdLineEngine()); // Rasterizer.builtIn() works only with CmdLineEngine
Graph g = graph("example5").directed().with(node("abc").link(node("xyz")));
Graphviz viz = Graphviz.fromGraph(g);
viz.width(200).render(Format.SVG).toFile(new File("example/ex5.svg"));
viz.width(200).rasterize(Rasterizer.BATIK).toFile(new File("example/ex5b.png"));
viz.width(200).rasterize(Rasterizer.SALAMANDER).toFile(new File("example/ex5s.png"));
viz.width(200).rasterize(Rasterizer.builtIn("pdf")).toFile(new File("example/ex5p"));
String dot = viz.render(Format.DOT).toString();
String json = viz.engine(Engine.NEATO).render(Format.JSON).toString();
BufferedImage image = viz.render(Format.PNG).toImage();

To rasterize with batik, provide this library on the classpath:
<dependency>
    <groupId>org.apache.xmlgraphics</groupId>
    <artifactId>batik-rasterizer</artifactId>
    <version>1.10</version>
</dependency>The layout of a graph is done with Javascript / natively and the rendering with Java.
The two environments are not guaranteed to calculate the width of text the same way.
This can lead to node labels that are too broad for their box or not correctly centered.
To help with this, there is the fontAdjust option to adjust the font size after the layout has been done.
To help finding the correct fontAdjust, FontTools.java
can be used.
Node width = node("Very long node labels can go over the border");
Node center = node(Label.html("HTML labels on the other side, can get uncentered"));
Graphviz g = Graphviz.fromGraph(graph()
        .nodeAttr().with(Font.name("casual"), Shape.RECTANGLE)
        .with(width.link(center)));
g.render(Format.PNG).toFile(new File("example/ex6d.png"));
g.fontAdjust(.87).render(Format.PNG).toFile(new File("example/ex6a.png"));

To use graphviz inside javadoc comments, add this to pom.xml:
<build>
  <plugins>
    <plugin>
      <artifactId>maven-javadoc-plugin</artifactId>
      <version>3.1.0</version>
      <configuration>
        <taglet>guru.nidi.graphviz.GraphvizTaglet</taglet>
        <tagletArtifact>
          <groupId>guru.nidi</groupId>
          <artifactId>graphviz-taglet</artifactId>
          <version>0.12.1</version>
        </tagletArtifact>
      </configuration>
    </plugin>
  </plugins>
</build>
To use this with JDK 9 or later, replace graphviz-taglet
with graphviz-taglet9.
The usage inside javadoc is then as follows:
/**
 * Support graphviz inside javadoc.
 * <p>
 * {@graphviz
 * graph test { a -- b }
 * }
 * </p>
 * So easy.
 */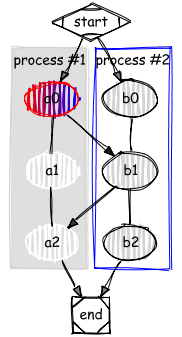
public class GraphvizTaglet implements Taglet {}To change the appearance of the graph into something more sketchy / hand drawn, the RoughFilter can be used.
First, add the rough module to the dependencies:
<dependency>
    <groupId>guru.nidi</groupId>
    <artifactId>graphviz-rough</artifactId>
    <version>0.12.1</version>
</dependency>
Then, apply the RoughFilter to the graph:
final Graph g = graph("ex1").directed().with(
        graph().cluster()
                .nodeAttr().with(Style.FILLED, Color.WHITE)
                .graphAttr().with(Style.FILLED, Color.LIGHTGREY, Label.of("process #1"))
                .with(node("a0").link(node("a1").link(node("a2")))),
        graph("x").cluster()
                .nodeAttr().with(Style.FILLED)
                .graphAttr().with(Color.BLUE, Label.of("process #2"))
                .with(node("b0").link(node("b1").link(node("b2")))),
        node("start").with(Shape.mDiamond("", "")).link("a0", "b0"),
        node("a0").with(Style.FILLED, Color.RED.gradient(Color.BLUE)).link("b1"),
        node("b1").link("a2"),
        node("a2").link("end"),
        node("b2").link("end"),
        node("end").with(Shape.mSquare("", ""))
);

Graphviz.fromGraph(g)
        .filter(new RoughFilter()
                .bowing(2)
                .roughness(1)
                .fillStyle(FillStyle.hachure().width(2).gap(5).angle(0))
                .font("*serif", "Comic Sans MS"))
        .render(Format.PNG)
        .toFile(new File("example/ex1-rough.png"));