In December 2017 we helped do data analysis as part of radio 5Live's James Graham report on the proportion of income being spent on Christmas by households in different parts of the country.
The story was based on Centre for Retail Research (CRR) spending forecasts for Christmas, which needed to be matched with ONS regional income figures. However, whereas the CRR spending forecasts referred to households, the ONS "disposable income" (money left after tax and benefits are paid) was calculated per head or per region.
To make the figures compatible, we used the total number of households by region for 2015 (the year covered by the disposable income figures).
We then calculated the total after tax income per household by taking the total for the region and dividing it by the number of households.
We then divided this figure (total annual disposable income per household per region) by 12 to get a month's disposable income per household.
We then took the CRR figure on Christmas to calculate the % of a month's after tax/benefits income that goes on Christmas.
- CSV: spending forecasts for Christmas (Centre for Retail Research)
- ONS: Gross disposable household income - cached here
- ONS: total number of households by region for 2015 - cached here
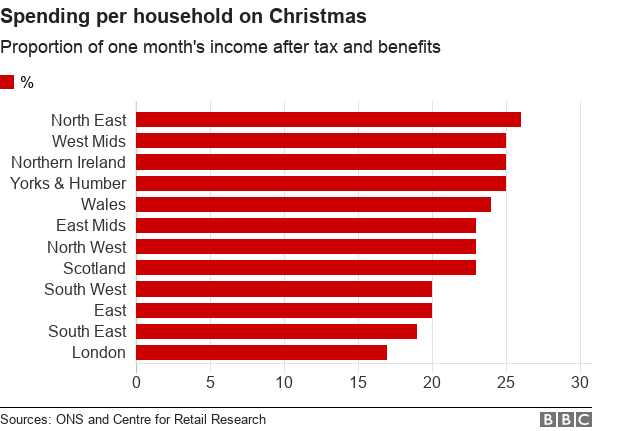
- Bar chart: Spending per household on Christmas


