A Python 3 library for programmatically generating SVG images (vector drawings) and rendering them or displaying them in an iPython notebook.
Most common SVG tags are supported and others can easily be added by writing a small subclass of DrawableBasicElement or DrawableParentElement.
An interactive Jupyter notebook widget, drawSvg.widgets.DrawingWidget, is included that can update drawings based on mouse events.
drawSvg is available on PyPI:
$ pip3 install drawSvg
import drawSvg as draw

d = draw.Drawing(200, 100, origin='center')

d.append(draw.Lines(-80, -45,
                    70, -49,
                    95, 49,
                    -90, 40,
                    close=False,
            fill='#eeee00',
            stroke='black'))

d.append(draw.Rectangle(0,0,40,50, fill='#1248ff'))
d.append(draw.Circle(-40, -10, 30,
            fill='red', stroke_width=2, stroke='black'))

p = draw.Path(stroke_width=2, stroke='green',
              fill='black', fill_opacity=0.5)
p.M(-30,5)  # Start path at point (-30, 5)
p.l(60,30)  # Draw line to (60, 30)
p.h(-70)    # Draw horizontal line to x=-70
p.Z()       # Draw line to start
d.append(p)

d.append(draw.ArcLine(60,-20,20,60,270,
            stroke='red', stroke_width=5, fill='red', fill_opacity=0.2))
d.append(draw.Arc(60,-20,20,60,270,cw=False,
            stroke='green', stroke_width=3, fill='none'))
d.append(draw.Arc(60,-20,20,270,60,cw=True,
            stroke='blue', stroke_width=1, fill='black', fill_opacity=0.3))

d.setPixelScale(2)  # Set number of pixels per geometry unit
#d.setRenderSize(400,200)  # Alternative to setPixelScale
d.saveSvg('example.svg')
d.savePng('example.png')

# Display in iPython notebook
d.rasterize()  # Display as PNG
d  # Display as SVG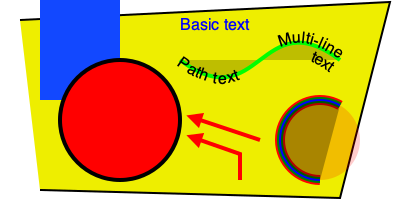
import drawSvg as draw

d = draw.Drawing(1.5, 0.8, origin='center')

d.draw(draw.Rectangle(-0.75,-0.5,1.5,1, fill='#ddd'))

# Create gradient
gradient = draw.RadialGradient(0,-0.35,0.7*10)
gradient.addStop(0.5/0.7/10, 'green', 1)
gradient.addStop(1/10, 'red', 0)

# Draw a shape to fill with the gradient
p = draw.Path(fill=gradient, stroke='black', stroke_width=0.002)
p.arc(0,-0.35,0.7,30,120)
p.arc(0,-0.35,0.5,120,30,cw=True, includeL=True)
p.Z()
d.append(p)

# Draw another shape to fill with the same gradient
p = draw.Path(fill=gradient, stroke='red', stroke_width=0.002)
p.arc(0,-0.35,0.75,130,160)
p.arc(0,-0.35,0,160,130,cw=True, includeL=True)
p.Z()
d.append(p)

# Another gradient
gradient2 = draw.LinearGradient(0.1,-0.35,0.1+0.6,-0.35+0.2)
gradient2.addStop(0, 'green', 1)
gradient2.addStop(1, 'red', 0)
d.append(draw.Rectangle(0.1,-0.35,0.6,0.2,
                        stroke='black', stroke_width=0.002,
                        fill=gradient2))

# Display
d.setRenderSize(w=600)
d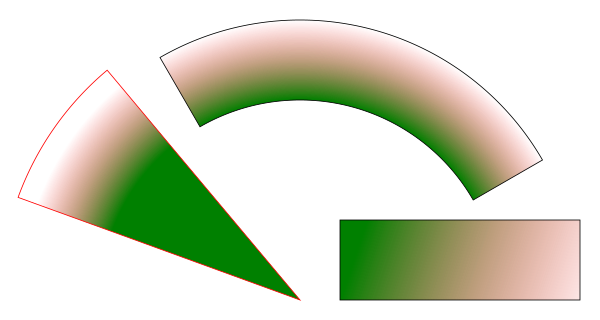
import drawSvg as draw

d = draw.Drawing(1.4, 1.4, origin='center')

# Define clip path
clip = draw.ClipPath()
clip.append(draw.Rectangle(-.25,.25-1,1,1))

# Draw a cropped circle
c = draw.Circle(0,0,0.5, stroke_width='0.01', stroke='black',
                         fill_opacity=0.3, clip_path=clip,
                         id='circle')
d.append(c)

# Make a transparent copy, cropped again
g = draw.Group(opacity=0.5, clip_path=clip)
g.append(draw.Use('circle', 0.25,0.1))
d.append(g)

# Display
d.setRenderSize(400)
d.rasterize()
import drawSvg as draw

# Subclass DrawingBasicElement if it cannot have child nodes
# Subclass DrawingParentElement otherwise
# Subclass DrawingDef if it must go between <def></def> tags in an SVG
class Hyperlink(draw.DrawingParentElement):
    TAG_NAME = 'a'
    def __init__(self, href, target=None, **kwargs):
        # Other init logic...
        # Keyword arguments to super().__init__() correspond to SVG node
        # arguments: stroke_width=5 -> stroke-width="5"
        super().__init__(href=href, target=target, **kwargs)

d = draw.Drawing(1, 1.2, origin='center')

# Create hyperlink
hlink = Hyperlink('https://www.python.org', target='_blank',
                  transform='skewY(-30)')
# Add child elements
hlink.append(draw.Circle(0,0,0.5, fill='green'))
hlink.append(draw.Text('Hyperlink',0.2, 0,0, center=0.6, fill='white'))

# Draw and display
d.append(hlink)
d.setRenderSize(200)
d
import drawSvg as draw
from drawSvg.widgets import DrawingWidget
import hyperbolic.poincare.shapes as hyper  # pip3 install hyperbolic

# Create drawing
d = draw.Drawing(2, 2, origin='center')
d.setRenderSize(500)
d.append(draw.Circle(0, 0, 1, fill='orange'))
group = draw.Group()
d.append(group)

# Update the drawing based on user input
click_list = []
def redraw(points):
    group.children.clear()
    for x1, y1 in points:
        for x2, y2 in points:
            if (x1, y1) == (x2, y2): continue
            p1 = hyper.Point.fromEuclid(x1, y1)
            p2 = hyper.Point.fromEuclid(x2, y2)
            if p1.distanceTo(p2) <= 2:
                line = hyper.Line.fromPoints(*p1, *p2, segment=True)
                group.draw(line, hwidth=0.2, fill='white')
    for x, y in points:
        p = hyper.Point.fromEuclid(x, y)
        group.draw(hyper.Circle.fromCenterRadius(p, 0.1),
                   fill='green')
redraw(click_list)

# Create interactive widget and register mouse events
widget = DrawingWidget(d)
@widget.mousedown
def mousedown(widget, x, y, info):
    if (x**2 + y**2) ** 0.5 + 1e-5 < 1:
        click_list.append((x, y))
    redraw(click_list)
    widget.refresh()
@widget.mousemove
def mousemove(widget, x, y, info):
    if (x**2 + y**2) ** 0.5 + 1e-5 < 1:
        redraw(click_list + [(x, y)])
    widget.refresh()
widget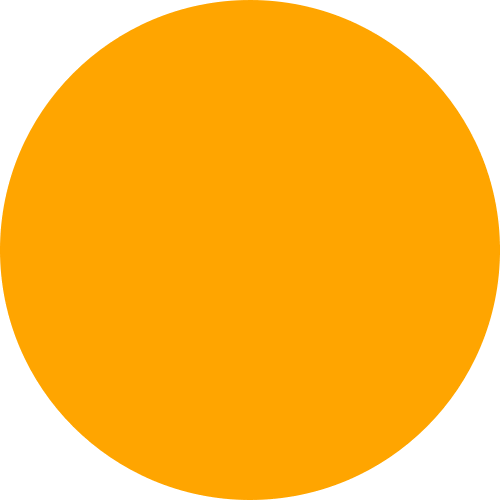
import drawSvg as draw

# Draw a frame of the animation
def draw_frame(t):
    d = draw.Drawing(2, 6.05, origin=(-1,-1.05))
    d.setRenderSize(h=300)
    d.append(draw.Rectangle(-2, -2, 4, 8, fill='white'))
    d.append(draw.Rectangle(-1, -1.05, 2, 0.05, fill='brown'))
    t = (t + 1) % 2 - 1
    y = 4 - t**2 * 4
    d.append(draw.Circle(0, y, 1, fill='lime'))
    return d

with draw.animate_jupyter(draw_frame, delay=0.05) as anim:
# Or:
#with draw.animate_video('example6.gif', draw_frame, duration=0.05
#                       ) as anim:
    # Add each frame to the animation
    for i in range(20):
        anim.draw_frame(i/10)
    for i in range(20):
        anim.draw_frame(i/10)
    for i in range(20):
        anim.draw_frame(i/10)