The goal of fluxpal is to accurately calculate the emission line flux of lines in the Far Ultraviolet(FUV) range. This range contains information that can help clue in on exoplanetary atmospheres with the measurements providing insight into FUV radiation from host stars. Integrating UV spectra with X-ray data allows us to estimate the stellar corona, adding to the toolkit of exoplanet atmosphere data.
The script accomplishes the task of calculating flux by:
- Grouping emission lines using a preset tolerance, which can be adjusted if using a different DEM (CSV) file.
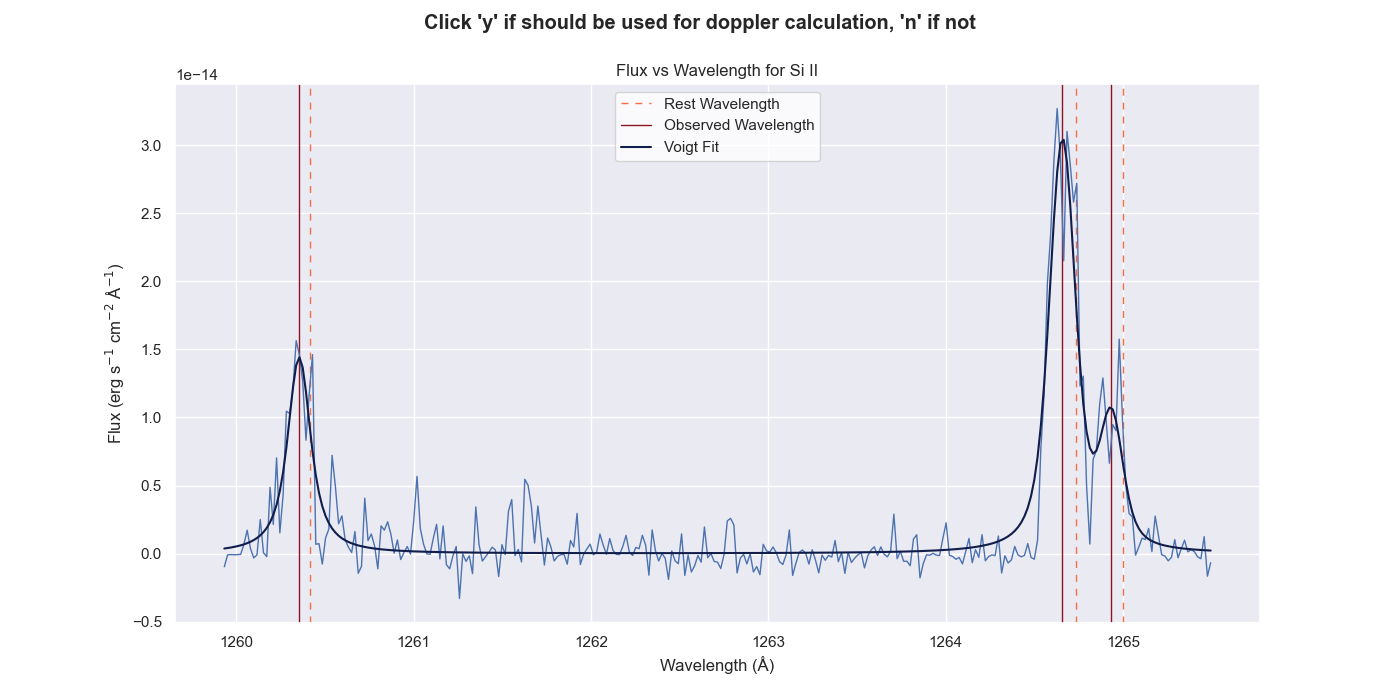
- Calculating the Doppler shift by fitting a composite Voigt profile to the strongest emission lines, and comparing Voigt peaks to rest wavelength to calculate.
- Iterating through each line, determining if noise, and then calculating the flux either using the Voigt profile or the original data.
- Presents a final plot of all of the final emission lines, and exports the calculations as a FITS and ECSV file.
-
Clone the repository
git clone https://github.com/bellalongo/fluxpal.git
-
Move the fits file being used to calculate flux into the 'spectra' folder.
-
Adjust the 'fresh_start' parameter depending on whether you want to adjust calculations on a new run
(if first run, set to True)fresh_start = True
-
Adjust the 'gaussian_smoothing' parameter depending on whether you to smooth the spectrum
(if first run, set to False)gaussian_smoothing = False
-
Run the script:
python3 main.py spectra/fits_file.fits 'instrument' 'grating' 'star name'
The script can be run on its own without any adjustments, but if the star is a little finicky:
- adjust the mask used to isolate emission lines
- edit header if want different header information
- adjust peak_width in 'peak_width_finder'
- adjust tolerance used to group emission lines in 'grouping_emission_lines'
- adjust voigt fit initial parameters
A plot will appear of the 'best' emission lines, with a Voigt fit fitted to it. Click 'y' if you think the line should be used to calculate Doppler shift (these lines will automatically not be considered as noise), and 'n' if the emission line if not.
All lines not selected for Doppler calculation will appear, some with a Voigt profile fitted if possible to be selected as noise or not noise. Click 'y' if you think the line is noise, and 'n' if the line is not noise.
Not noise:

Noise:

After all emission line selections and calculations have been made, a final plot will appear showing the spectrum and each labeled emission line. Matplotlib gives the ability to zoom into the plot, so please do so to double-check the lines. This plot is saved to the 'plots' folder.

Header contains:
- DATE: date flux was calculated
- FILENAME: name of the fits file used to for flux calc
- TELESCP: telescope used to measure spectrum
- INSTRMNT: active instrument to measure spectrum
- GRATING: grating used to measure spectrum
- TARGNAME: name of star used in measurement
- DOPPLER: doppler shift used to measure flux
- WIDTH: average peak width of the emissoin lines
- RANGE: flux range used to isolate emission line
- WIDTHPXL: average emission line peak width in pixels
- UPPRLIMIT: upper limit used for noise
ECSV Data: File columns are Ion, Rest Wavelength, Flux, Error, Blended Line, each row representing a grouped emission line.
FITS Data: FITS Table containing the same data as the ECSV file.
Note: Noise is marked as having the negative of the upper limit (3*error) as the flux and an error of 0.
