GithubHelp home page GithubHelp logo

binioter / pyg2plot Goto Github PK

View Code? Open in Web Editor NEW

This project forked from hustcc/pyg2plot

0.0 0.0 0.0 35 KB

🎨 Python3 binding for `@AntV/G2Plot` Plotting Library .

License: MIT License

Python 92.19% HTML 7.81%

pyg2plot's Introduction

PyG2Plot

🎨 PyG2Plot 是 @AntV/G2Plot 在 Python3 上的封装。 G2Plot 是一套简单、易用、并具备一定扩展能力和组合能力的统计图表库,基于图形语法理论搭建而成。

Latest Stable Version build Status

相关文档英文介绍 · 绘制常用统计图表 · 在 Jupyter 中使用 · 技术原理

安装

$ pip install pyg2plot

使用

渲染成 HTML

from pyg2plot import Plot

line = Plot("Line")

line.set_options({
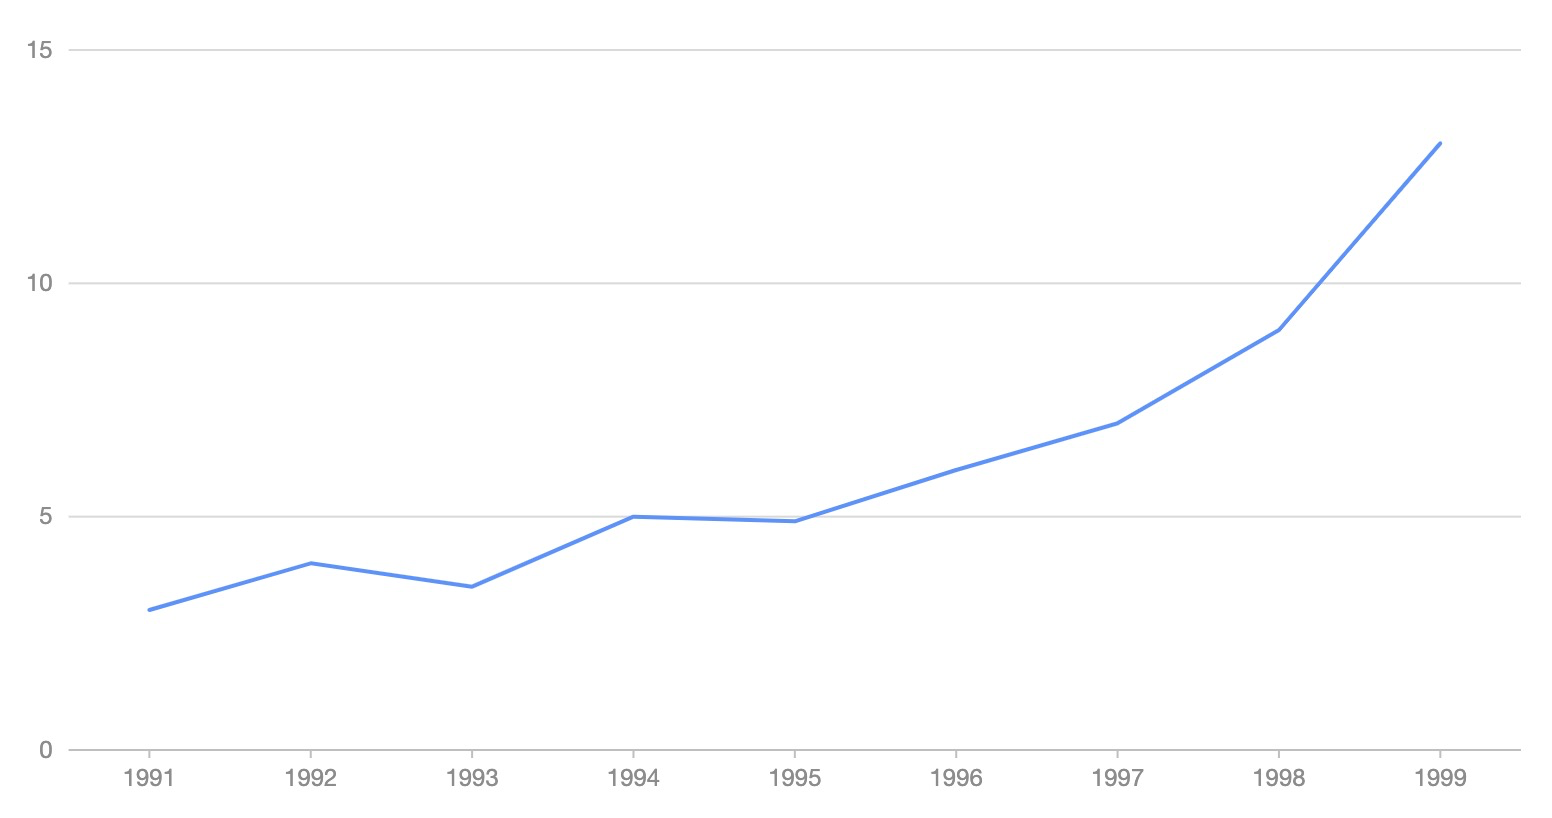
  "data": [
    { "year": "1991", "value": 3 },
    { "year": "1992", "value": 4 },
    { "year": "1993", "value": 3.5 },
    { "year": "1994", "value": 5 },
    { "year": "1995", "value": 4.9 },
    { "year": "1996", "value": 6 },
    { "year": "1997", "value": 7 },
    { "year": "1998", "value": 9 },
    { "year": "1999", "value": 13 },
  ],
  "xField": "year",
  "yField": "value",
})

# 1. 渲染成 html 文件
line.render("plot.html")
# 2. 渲染成 html 字符串
line.render_html()

image

在 Jupyter 中使用

from pyg2plot import Plot

line = Plot("Line")

line.set_options({
  "height": 400, # set a default height in jupyter preview
  "data": [
    { "year": "1991", "value": 3 },
    { "year": "1992", "value": 4 },
    { "year": "1993", "value": 3.5 },
    { "year": "1994", "value": 5 },
    { "year": "1995", "value": 4.9 },
    { "year": "1996", "value": 6 },
    { "year": "1997", "value": 7 },
    { "year": "1998", "value": 9 },
    { "year": "1999", "value": 13 },
  ],
  "xField": "year",
  "yField": "value",
})

line.render_notebook()

API

目前 pyg2plot 只提供简单的一个 API。

  • Plot
  1. Plot(plot_type: str): 获取 Plot 对应的类实例。

  2. plot.set_options(options: object): 给图表实例设置一个 G2Plot 图形的配置,文档可以直接参考 G2Plot 官网,未进行任何二次数据结构包装。

  3. plot.render(path, env, **kwargs): 渲染出一个 HTML 文件,同时可以传入文件的路径,以及 jinja2 env 和 kwargs 参数。

  4. plot.render_notebook(env, **kwargs): 将图形渲染到 jupyter 的预览。

  5. plot.render_html(env, **kwargs): 渲染出 HTML 字符串,同时可以传入 jinja2 env 和 kwargs 参数。

  6. plot.dump_js_options(env, **kwargs): 输出 Javascript 的 option 配置结构,同时可以传入 jinja2 env 和 kwargs 参数,可以用于 Server 中的 HTTP 结构返回数据结构。

更多区分 Plot 级别的语法糖 API 还在筹备中。

协议

MIT@hustcc.

pyg2plot's People

Contributors

hustcc avatar

Recommend Projects

  • React photo React

    A declarative, efficient, and flexible JavaScript library for building user interfaces.

  • Vue.js photo Vue.js

    🖖 Vue.js is a progressive, incrementally-adoptable JavaScript framework for building UI on the web.

  • Typescript photo Typescript

    TypeScript is a superset of JavaScript that compiles to clean JavaScript output.

  • TensorFlow photo TensorFlow

    An Open Source Machine Learning Framework for Everyone

  • Django photo Django

    The Web framework for perfectionists with deadlines.

  • D3 photo D3

    Bring data to life with SVG, Canvas and HTML. 📊📈🎉

Recommend Topics

  • javascript

    JavaScript (JS) is a lightweight interpreted programming language with first-class functions.

  • web

    Some thing interesting about web. New door for the world.

  • server

    A server is a program made to process requests and deliver data to clients.

  • Machine learning

    Machine learning is a way of modeling and interpreting data that allows a piece of software to respond intelligently.

  • Game

    Some thing interesting about game, make everyone happy.

Recommend Org

  • Facebook photo Facebook

    We are working to build community through open source technology. NB: members must have two-factor auth.

  • Microsoft photo Microsoft

    Open source projects and samples from Microsoft.

  • Google photo Google

    Google ❤️ Open Source for everyone.

  • D3 photo D3

    Data-Driven Documents codes.