Data driven architecture - Describe your architecture once. With data.
The problem with most visual architecture tools like Visio is that they break down when dealing with larger architectures. You end up making multiple views of the same architecture and things become hard to maintain. Also describing the architecture is a pain when you need to drag and drop too many boxes and lines.
The MVP is a system where I can describe the static architecture (similar to a UML component diagram) using a directed graph. It will have the following features
- I can create the architecture graph very quickly using a fancy drag and drop interface or a table (like excel)
- I can zoom in and out to see more and less detail of the architecture
- Persist the created architecture
- Look at the architecture from different views, and still only have one directed graph describing the whole thing
- An activity diagram view
- A data entity view
- Create the concept of baseline and target architecture and a diff between the two
- Position the components in various diagrams since the auto-layout will not be perfect. (Still we keep only a single representation of the architecture)
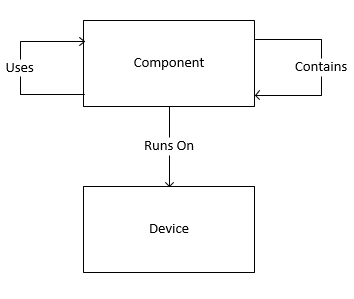
The graph will have nodes representing
- "Component": Logical buiding block
- "Device": Server, Mobile Phone, Laptop, PC, etc.
A node will be related to other nodes using edges. These edges will describe the relations between the components. I will start with the following relations
- "Contains": A "contains" relations between node a and node b means that b is contained within a. When zooming in the architecture you will be zooming through the "contains" relationships in the graph.
- "Uses": A "uses" relation between node a and node b means that a uses b (to get its job done).
- "RunsOn": A "runsOn" relation beweeen node a and node b means that node a runs on node b. Further more it also means that node b is a "Device".