GithubHelp home page GithubHelp logo

blackcowmoo / grafana-google-analytics-datasource Goto Github PK

View Code? Open in Web Editor NEW
34.0 5.0 14.0 1.12 MB

Grafana Google Analytics datasource

Home Page: https://grafana.com/grafana/plugins/blackcowmoo-googleanalytics-datasource/

License: Apache License 2.0

JavaScript 0.40% Go 58.21% TypeScript 40.99% Dockerfile 0.39%
grafana korean grafana-plugin google-analytics

grafana-google-analytics-datasource's Introduction

CodeQL

Google Analytics datasource

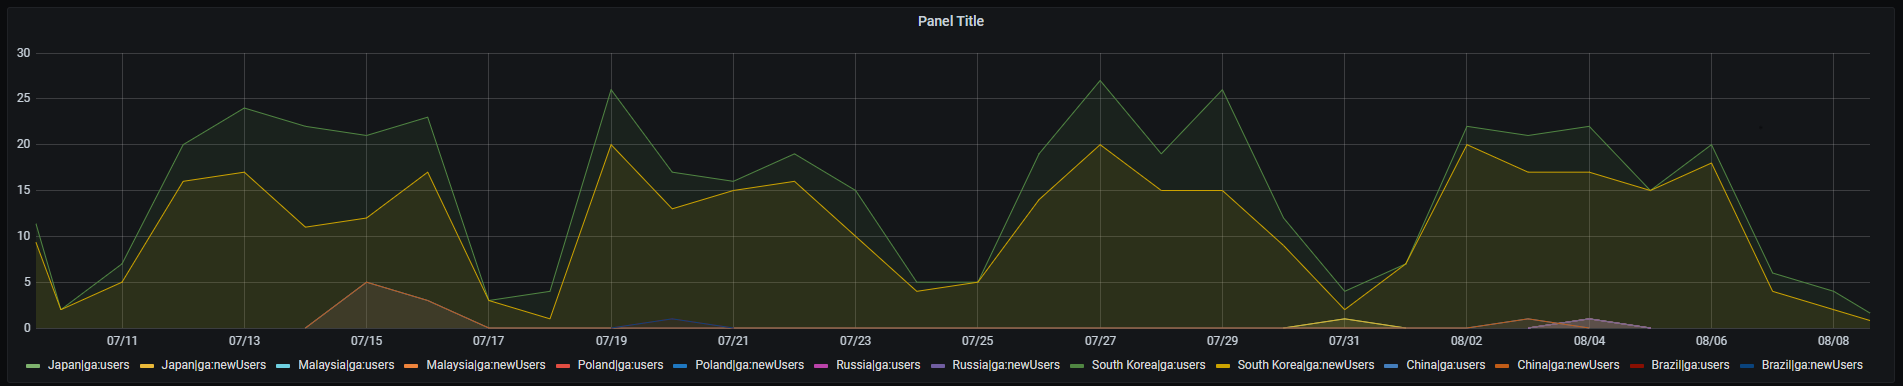
Visualize data from Google Analytics UA And GA4(beta)

Feature

  • AutoComplete AccountID & WebpropertyID & ProfileID
  • AutoComplete Metrics & Dimensions
  • Query using Metrics & Dimensions
  • Setting with json

query

Preparations

Generate a JWT file

  1. if you don't have gcp project, add new gcp project. link
  2. Open the Credentials page in the Google API Console.
  3. Click Create Credentials then click Service account.
  4. On the Create service account page, enter the Service account details.
  5. On the Create service account page, fill in the Service account details and then click Create
  6. On the Service account permissions page, don't add a role to the service account. Just click Continue
  7. In the next step, click Create Key. Choose key type JSON and click Create. A JSON key file will be created and downloaded to your computer
  8. Note your service account email ex) @.iam.gserviceaccount.com
  9. Open the Google Analytics API in API Library and enable access for your account
  10. Open the Google Analytics Reporting API in API Library and enable access for your GA Data

Google Analytics Setting

  1. Open the Google Analytics
  2. Select Your Analytics Account And Open Admin Page
  3. Click Account User Management on the Account Tab
  4. Click plus Button then Add users
  5. Enter service account email at Generate a JWT file 8th step and Permissions add Read & Analyze

Grafana

Go To Add Data source then Drag the file to the dotted zone above. Then click Save & Test.
The file contents will be encrypted and saved in the Grafana database.

FAQ

FAQ

How To Dev

build directory

grafana-google-analytics-datasource's People

Contributors

dependabot[bot] avatar illflavored avatar jonbloom avatar lcc3108 avatar micalgenus avatar pjainxido avatar

Stargazers

 avatar  avatar  avatar  avatar  avatar  avatar  avatar  avatar  avatar  avatar  avatar  avatar  avatar  avatar  avatar  avatar  avatar  avatar  avatar  avatar  avatar  avatar  avatar  avatar  avatar  avatar  avatar  avatar  avatar  avatar  avatar  avatar  avatar  avatar

Watchers

 avatar  avatar  avatar  avatar  avatar

grafana-google-analytics-datasource's Issues

[BUG] When giving the json file and testing it, it shows "invalid config"

Describe the bug
I followed the exact way of getting the JWT file

Grafana Version & Plugin Version
Grafana 8.3.0

To Reproduce
Steps to reproduce the behavior:

  1. After downloading the JWT file
  2. I dragged and dropped in Grafana
  3. Clicked on the save and test button
  4. This is the error I get

WhatsApp Image 2022-06-30 at 2 12 40 PM

Additional context
Could you help me with it as I followed each step and tried it twice already?

[BUG] Timezone ploblem

Describe the bug
There is a problem displaying time data because the plugin uses UTC timezone and the GA API uses timezone for each profile.

Grafana Version & Plugin Version
Grafana : 7.4.3
Plugin: no version

To Reproduce
Steps to reproduce the behavior:

  1. Go to dashboard
  2. Send query
  3. my timezone Asia/Seoul but data timezone UTC

Expected behavior
data timezone same as my timezone

Screenshots

Additional context

How can I get more recent data

Hello,

I set up a visualization in Grafana with different GA4 metrics, the problem is that for every visualization that I have the last data it shows it's from 10-12h ago, is there anything I need to configure in Google Analytics or Grafana to receive the most recent data?

Thanks in advance for any help ๐Ÿ˜„

Last 30 days timepicker incorrect

Describe the bug
When choosing the "last 30 days" (or the like) in the timepicker the start date isn't processed correctly, but instead shows 12 hours ago. But when I manually select the time period in the panel by using "hardcoded" dates, it works. Alternatively, when I use the "Explore" mode for the same panel then also the last 30 days works.

Grafana Version & Plugin Version
Grafana v10.0.1 (5a30620b85)
Chrome browser
We are using the latest analytics datasource/plugin version

This is how it looks in a regular panel (incorrect):
image

But when we view the same panel in "Explore" mode it does display it accurately:
image

[FEATURE] Add ga filter

Is your feature request related to a problem? Please describe.
No, additional feature

Describe the solution you'd like
GA API Support filters metricFilterClauses, dimensionFilterClauses.
Use plugin those filters
GA API Docs
Describe alternatives you've considered
No
Additional context

Analytics data not showing in the Grafana panel

Hi I have completed all the required steps like Created JWT token from gcp side and added permission to the service account created , then upload the JWT to grafana side but somehow whenever I am trying to see the data by inserting the metrics and dimensions it is showing that "Field request.dimensions.name is required., badRequest" and sometimes "Fail query" error="failed to read query: error reading query: json: cannot unmarshal object into Go struct field QueryModel.dimensions of type []string" and sometimes this Error 400: Selected dimensions and metrics cannot be queried together., badRequest". Can you please guide me on this.

[BUG] - Duplicates in Landing Page Dimension

Describe the bug
When I select New Users as Metrics, First Session as Time Dimension and Landing Page as Dimension receive duplicates. Check the screenshot below. Please find a way to remove them.

Grafana Version & Plugin Version
0.2.3

Screenshot
Screenshot 2023-11-26 at 14 17 48

Account Properties as variable

Hi everyone.

Today I installed GA datasource plugin and found a problem.
In my GA account I have a lot of properties, and for each grafana panel I can only select a single property.

Would be possible somehow to repeat the same chart (total users i.e.) for all account properties available?

I tried to setup a dashboard variable but in the query it doesn't get the variable value and doens't get any data.

I could setup a panel per property manually but I have a lot of them and would like to have something more dynamic.

Best Regards,
Nuno

Support for Grafana v9

Hi,

Can't install the plugin on the Grafana Cloud due to the plugin not supporting the new version (9).

image

[BUG] How to remove Time Dimension?

In order to build a report which is reflecting the number of visitors grouped by 'Landing Page + query string', I would like to use only one dimension 'Landing Page + query string' with the timeframe that I can set in the time panel in the top right corner.

But in the current configuration, Time Dimension choosing is mandatory. So I'm getting date rows and columns with Landing Pages, please check out the following screenshot:
image

I suggest getting the table as we see on Google Analytics. Rows are dimensions, columns are metrics. With options to get rid of Time Dimension.
image

Please, let me know if it is possible to implement or fix it in the upcoming days.

[FEATURE] Real Time dashboard, It is possible?

Is your feature request related to a problem? Please describe.
Request: It is possible to obtain the number of users in real time and be able to generate a board with several sites...

Describe the solution you'd like
The Google Analytics plugin is using the runReport API to load data.
Since there is a runRealtimeReport API, it could be used in some option to use that API.

Describe alternatives you've considered
...

Additional context
...

get viewId at ga management API v3

viewId๋Š” ์„ค์ •์—์„œ ๋„ฃ๋Š”๊ฒŒ ์•„๋‹Œ, ๋Œ€์‹œ๋ณด๋“œ์—์„œ ์„ ํƒํ•  ์ˆ˜ ์žˆ๋Š” ๊ฐ’์ด๋ฉด ์ข‹์„ ๊ฒƒ ๊ฐ™์Šต๋‹ˆ๋‹ค. ์„ค์ •์— ๋“ค์–ด๊ฐ€๋ฉด ํ•˜๋‚˜ ์ถ”๊ฐ€ํ•˜๊ณ  ์‹ถ์„ ๋•Œ ๋งˆ๋‹ค ๋ฐ์ดํ„ฐ์†Œ์Šค๋„ ํ•˜๋‚˜์”ฉ ์ถ”๊ฐ€ํ•ด์•ผํ•ด์š”.

Originally posted by @micalgenus in #10 (comment)

[BUG] - Unavailability to set a required timeframe

Describe the bug
When I select the time interval above in the filter it doesn't impact the dataset. I see all dates in the table, but would like to cut irrelevant days including unknown NaN which all of them have not been set in the time filter.

Grafana Version & Plugin Version
0.2.3

Screenshot:
Screenshot 2023-11-26 at 14 40 37

[FEATURE] Support custom metrics and dimensions

Is your feature request related to a problem? Please describe.
#54 (comment)
Is support for Event Scope Custom Metrics present already / can it be added? I cannot find it in the metrics picker

image

Originally posted by @aa-matthias in #54 (comment)

Describe the solution you'd like
Get metrics with propertyId

Describe alternatives you've considered
A clear and concise description of any alternative solutions or features you've considered.

Additional context
Add any other context or screenshots about the feature request here.

Release grafana community plugin

current situation

  • plugin submit
  • review
  • required change
  • register

Detail

  • 2021-11-11: plugin submit and review request

  • 2022-04-25 : review end and change request

  • required change

    • Update plugin.json

    Need to change "grafanaDependency": "7.x.x" to support Grafana 8 since it currently means only Grafana v7.x.x versions are supported . Since grafana packages dependencies are 8.2.0 would recommend "grafanaDependency": ">=8.2 <9". However, verified the plugin works with v7.3.0 and v8.5.0 so maybe "grafanaDependency": ">=7.3 <9" is more suitable?

    • Lack of instance management

    We strongly recommend to use instance management so that you can cache Google Analytic client for each configured datasource in Grafana and by that be able to make use of reusing HTTP connections. In main.go, please use datasource.Manage. See working example here https://github.com/grafana/grafana-plugin-examples/blob/master/examples/datasource-basic/pkg/main.go. As you can see in this code that will be called each time a Google Analytics datasource is created/updated in Grafana which gives you a perfect opportunity to instantiate your GA client and store it on the Datasource struct. Then you can access the client from the Datasource struct when handling QueryData, CheckHealth and resource calls.

    • Error logging

    Error logging should include error key, e.g. rather than log.DefaultLogger.Error("Fail LoadSetting", err.Error()) use log.DefaultLogger.Error("Fail LoadSetting", "error", err)

    • LoadSettings

    Reference to profileId which doesn't seem to be configurable from the UI and read from secureJsonData, what's the idea with this?
    The LoadSettings function seems like it could be optimized,

  • Suggested changes

    • Replace Info log level with debug level

    Would be nice if Info logging is replaced with debug level since it no outputs a lot of information with info level in Grafana server log.

    logger=context traceID=00000000000000000000000000000000 userId=0 orgId=1 uname= t=2022-04-26T12:14:49.84+0000 lvl=info msg="Request Completed" method=GET path=/api/live/ws status=0 remote_addr=172.19.0.1 time_ms=0 duration=447.724ยตs size=0 referer= traceID=00000000000000000000000000000000
    logger=plugin.blackcowmoo-googleanalytics-datasource t=2022-04-26T12:14:50+0000 lvl=info msg="query timezone" timezone=Europe/Stockholm
    logger=plugin.blackcowmoo-googleanalytics-datasource t=2022-04-26T12:14:50+0000 lvl=info msg=getReport queries="unsupported value type"
    logger=plugin.blackcowmoo-googleanalytics-datasource t=2022-04-26T12:14:50+0000 lvl=info msg=getReport reportRequests="unsupported value type"
    logger=plugin.blackcowmoo-googleanalytics-datasource t=2022-04-26T12:14:50+0000 lvl=info msg="Doing GET request from analytics reporting" req="unsupported value type"
    logger=plugin.blackcowmoo-googleanalytics-datasource t=2022-04-26T12:14:50.5+0000 lvl=info msg="Do GET report" report="unsupported value type" reportlen=1
    logger=plugin.blackcowmoo-googleanalytics-datasource t=2022-04-26T12:14:50.5+0000 lvl=info msg=Elapsed GetreportdataatGAAPI=502.927991ms
    logger=plugin.blackcowmoo-googleanalytics-datasource t=2022-04-26T12:14:59.04+0000 lvl=info msg=getWebpropertiesList WebpropertiesList="unsupported value type"
    logger=plugin.blackcowmoo-googleanalytics-datasource t=2022-04-26T12:14:59.9+0000 lvl=info msg=getReport queries="unsupported value type"
    logger=plugin.blackcowmoo-googleanalytics-datasource t=2022-04-26T12:14:59.9+0000 lvl=info msg=getReport reportRequests="unsupported value type"
    logger=plugin.blackcowmoo-googleanalytics-datasource t=2022-04-26T12:14:59.9+0000 lvl=info msg="Doing GET request from analytics reporting" req="unsupported value type"
    logger=plugin.blackcowmoo-googleanalytics-datasource t=2022-04-26T12:15:00.64+0000 lvl=info msg="Do GET report" report="unsupported value type" reportlen=1
    logger=plugin.blackcowmoo-googleanalytics-datasource t=2022-04-26T12:15:00.64+0000 lvl=info msg=Elapsed GetreportdataatGAAPI=737.515163ms
    logger=plugin.blackcowmoo-googleanalytics-datasource t=2022-04-26T12:15:00.64+0000 lvl=info msg=HTTPStatusCode status=200
    logger=plugin.blackcowmoo-googleanalytics-datasource t=2022-04-26T12:15:00.64+0000 lvl=info msg=res
    logger=plugin.blackcowmoo-googleanalytics-datasource t=2022-04-26T12:15:00.64+0000 lvl=info msg="%s: %s" ga:sessions=2
    
    • Upgrade of Go/dependencies
    • Use grafana/google-sdk for auth

    Might want to consider using https://www.npmjs.com/package/@grafana/google-sdk for the configuration/JWT support to reuse the support already implemented for configuring a JWT token. See this example https://github.com/grafana/grafana-google-sdk-react/blob/8b6502c912c32300b86b92502abdbe64ca5a9571/src/ConnectionConfig.tsx#L68-L93. Guess the default service account functionality, https://github.com/grafana/grafana-google-sdk-react/blob/8b6502c912c32300b86b92502abdbe64ca5a9571/src/ConnectionConfig.tsx#L58-L66, if running in GCP is not needed and/or is not working for Google Analytics why I suggest only the use of JWTConfigEditorcomponent rather than the ConnectionConfig component.

[FEATURE] Create more detailed plugin setup instructions

Is your feature request related to a problem? Please describe.
#92
Setup instructions are not visual and summarized to enter the grafana plug-in page
Describe the solution you'd like
Write wiki or more detailed instructions

Describe alternatives you've considered
A clear and concise description of any alternative solutions or features you've considered.

Additional context
Add any other context or screenshots about the feature request here.

[BUG]

Grafana Version & Plugin Version
Latest
To Reproduce
Steps to reproduce the behavior:

  1. Go to 'the url on grafana cloud to add a jwt token'
  2. Click on 'add the token when you get after you download the plugin successfully.'
  3. Scroll down to 'add a new dashboard and select google analytics as the source'
  4. See error 'Required AccountID
    (Trace ID: 2e6e9ffbd5509665fa95d9206a854e17)'

Expected behavior
Data supposed to appear.

Screenshots
image

[FEATURE] Add padding dataframe

Is your feature request related to a problem? Please describe.
The line graph is strangely displayed when there is less data.
For infulxdb, the option allows you to choose whether to fill with zero.

Describe the solution you'd like
Add Padding Data with 0 Value

Describe alternatives you've considered
X

Additional context
X

[FEATURE] Support `andGroup` for DimensionFilter

Is your feature request related to a problem? Please describe.
With current release v0.2.3, it's only supported orGroup nested dimensionFilter in the query.

Describe the solution you'd like
When is your team planning to release support for andGroup?

Direct traffic not in the list

Nice plugin.

But I am missing Direct traffic.
We have:

  • Organic Searches
  • Clicks

But how can I also graph direct traffic?

[BUG]: GoggleAnalytics Datasource broken in 0.2.1

Describe the bug
I just updated from 0.2.0 to 0.2.1. The old Google Analystics datasource is not recognized anymore. When I create a new datasource, Grafana show the snackbar "Datasource added". I also see it in the list. When I click on it, I get a blank screen, with only the info: "Type: Google Analytics" and the options to delete the datasource and go back. I cannot edit it, nor test it - see image.

Screenshot 2023-09-04 at 16 52 01

Grafana Version & Plugin Version
0.2.1

Expected behavior
I expect to be able to edit + test the datasource.

[BUG]

Describe the bug

I am not sure this is a bug rather something I have missed on configuration but I have followed the instructions for GA4 data source.

When creating a dashboard with GA4 I get an exception and cant run a query

Grafana Version & Plugin Version

0.2.1

To Reproduce

I have performed the instruction for setting up google analytics with grafana plugin,
please note in step 5 I can only add a user and the additional 8th step and setting permissions I dont have in GA4
I have tested the connection and everything is testing as success.
I then start a dashboard and immediately an exception is raised

Expected behavior

I can start a query

Screenshots

attached

Additional context

These are the logs I see


     2023-09-06 22:05:59 logger=plugin.blackcowmoo-googleanalytics-datasource t=2023-09-06T22:05:59.711710955Z level=error msg=Query error="Required AccountID"```

[BUG] Improvement of preparations

Describe the bug
I have issues finding the right settings with the preparations.

Grafana Version & Plugin Version
Grafana v10.1.1 (0cfa76b22d)
Plugin: 0.2.2

To Reproduce
Steps to reproduce the behavior:

  1. Try to follow setup instructions

On step 9 I am not sure if I have done this the right way:
It shows me this screen below, is it now setup correctly for step 9?
image

On step 10 how do I enable access for my GA data?
It looks like this:
image

Expected behavior
Explain with the exact text labels that I have to click or provide screenshots how to handle the setup.

Screenshots
See above

Additional context
Add any other context about the problem here.

Support for Grafana v11

Hi there ๐Ÿ‘‹

I noticed in your plugin.json you've got the grafanaDependency set so that it will not install in Grafana 11 so wanted to reach out to check whether this is intentional?

remove auth-type API Key

in GA API Authoriztion docs

Your application must use OAuth 2.0 to authorize requests. No other authorization protocols are supported. If your application uses Google Sign-In, some aspects of authorization are handled for you.

[FEATURE] Use grafana google-sdk

Is your feature request related to a problem? Please describe.
support google service account

Describe the solution you'd like
use grafana google-sdk

Describe alternatives you've considered
A clear and concise description of any alternative solutions or features you've considered.

Additional context
google-sdk
example code

Plugin health check failed

I have follow and double check all introduction step but still receive plugin health check failed

Grafana a v10.1.0 & Google Analytics v0.2.0

here is my log:
2023-08-31 09:23:13 logger=context userId=1 orgId=1 uname=admin t=2023-08-31T07:23:13.716521425Z level=error msg="Plugin unavailable" error="plugin unavailable" remote_addr=172.17.0.1 traceID=
2023-08-31 09:23:13 logger=context userId=1 orgId=1 uname=admin t=2023-08-31T07:23:13.716696498Z level=error msg="Request Completed" method=GET path=/api/datasources/uid/e7ffe070-f3c7-458f-9eb2-4fed4471972e/health status=503 remote_addr=172.17.0.1 time_ms=1 duration=1.327593ms size=45 referer=http://localhost:3000/connections/datasources/edit/e7ffe070-f3c7-458f-9eb2-4fed4471972e handler=/api/datasources/uid/:uid/health

image

Google Analytics API and Google Analytics Reporting API are both installed:
image

[FEATURE] Support metrics and dimensions compatibility check

Is your feature request related to a problem? Please describe.
"Selected dimensions and metrics cannot be queried together"

Describe the solution you'd like
https://developers.google.com/analytics/devguides/reporting/data/v1/rest/v1beta/properties/checkCompatibility?hl=en
use checkCompatibility api compatibiliy check

Describe alternatives you've considered
A clear and concise description of any alternative solutions or features you've considered.

Additional context
Add any other context or screenshots about the feature request here.

[BUG] Data difference between gav4 and gav3

Describe the bug
Collect data with gav3 and gav4 on the same site.
The two data are different.
In case of gav4, yesterday's data is not inquired

Grafana Version & Plugin Version
grafana : 9.5.2
plugin : 0.2.0(not released)
To Reproduce
Steps to reproduce the behavior:

  1. Go to '...'
  2. Click on '....'
  3. Scroll down to '....'
  4. See error

Expected behavior
same data

Screenshots
in
gav4(https://developers.google.com/analytics/devguides/reporting/data/v1/rest/v1beta/properties/runReport?hl=ko)
image

Click to toggle contents of `response`
{
  "dimensionHeaders": [
    {
      "name": "dateHour"
    }
  ],
  "metricHeaders": [
    {
      "name": "active1DayUsers",
      "type": "TYPE_INTEGER"
    }
  ],
  "metadata": {
    "currencyCode": "KRW",
    "timeZone": "Asia/Seoul"
  },
  "kind": "analyticsData#runReport"
}
gav3(https://developers.google.com/analytics/devguides/reporting/core/v4/rest/v4/reports/batchGet?hl=ko) image
Click to toggle contents of `response`
{
  "reports": [
    {
      "columnHeader": {
        "dimensions": [
          "ga:dateHour"
        ],
        "metricHeader": {
          "metricHeaderEntries": [
            {
              "name": "ga:1dayUsers",
              "type": "INTEGER"
            }
          ]
        }
      },
      "data": {
        "rows": [
          {
            "dimensions": [
              "2023060201"
            ],
            "metrics": [
              {
                "values": [
                  "1"
                ]
              }
            ]
          },
          {
            "dimensions": [
              "2023060202"
            ],
            "metrics": [
              {
                "values": [
                  "2"
                ]
              }
            ]
          },
          {
            "dimensions": [
              "2023060208"
            ],
            "metrics": [
              {
                "values": [
                  "4"
                ]
              }
            ]
          },
          {
            "dimensions": [
              "2023060209"
            ],
            "metrics": [
              {
                "values": [
                  "1"
                ]
              }
            ]
          },
          {
            "dimensions": [
              "2023060210"
            ],
            "metrics": [
              {
                "values": [
                  "1"
                ]
              }
            ]
          },
          {
            "dimensions": [
              "2023060211"
            ],
            "metrics": [
              {
                "values": [
                  "1"
                ]
              }
            ]
          },
          {
            "dimensions": [
              "2023060213"
            ],
            "metrics": [
              {
                "values": [
                  "3"
                ]
              }
            ]
          },
          {
            "dimensions": [
              "2023060214"
            ],
            "metrics": [
              {
                "values": [
                  "7"
                ]
              }
            ]
          },
          {
            "dimensions": [
              "2023060215"
            ],
            "metrics": [
              {
                "values": [
                  "3"
                ]
              }
            ]
          },
          {
            "dimensions": [
              "2023060216"
            ],
            "metrics": [
              {
                "values": [
                  "3"
                ]
              }
            ]
          },
          {
            "dimensions": [
              "2023060217"
            ],
            "metrics": [
              {
                "values": [
                  "2"
                ]
              }
            ]
          },
          {
            "dimensions": [
              "2023060218"
            ],
            "metrics": [
              {
                "values": [
                  "1"
                ]
              }
            ]
          },
          {
            "dimensions": [
              "2023060221"
            ],
            "metrics": [
              {
                "values": [
                  "1"
                ]
              }
            ]
          },
          {
            "dimensions": [
              "2023060223"
            ],
            "metrics": [
              {
                "values": [
                  "4"
                ]
              }
            ]
          },
          {
            "dimensions": [
              "2023060309"
            ],
            "metrics": [
              {
                "values": [
                  "1"
                ]
              }
            ]
          },
          {
            "dimensions": [
              "2023060311"
            ],
            "metrics": [
              {
                "values": [
                  "1"
                ]
              }
            ]
          },
          {
            "dimensions": [
              "2023060314"
            ],
            "metrics": [
              {
                "values": [
                  "1"
                ]
              }
            ]
          },
          {
            "dimensions": [
              "2023060319"
            ],
            "metrics": [
              {
                "values": [
                  "1"
                ]
              }
            ]
          },
          {
            "dimensions": [
              "2023060320"
            ],
            "metrics": [
              {
                "values": [
                  "1"
                ]
              }
            ]
          },
          {
            "dimensions": [
              "2023060323"
            ],
            "metrics": [
              {
                "values": [
                  "2"
                ]
              }
            ]
          }
        ],
        "totals": [
          {
            "values": [
              "41"
            ]
          }
        ],
        "rowCount": 20,
        "minimums": [
          {
            "values": [
              "1"
            ]
          }
        ],
        "maximums": [
          {
            "values": [
              "7"
            ]
          }
        ]
      }
    }
  ]
}

in grafana(7days) image

Additional context
Add any other context about the problem here.

[BUG] Wrong time filter

Describe the bug
I've created a panel on Grafana to get total website sessions, but when I select on Grafana something like "Last 6 hours" and current time is 03 AM, it counts entire last day.

Grafana Version & Plugin Version
Grafana 10.3, Plugin 0.2.3

To Reproduce
Create a simple panel using any metric and select some date time that get part of one day.

Expected behavior
It should get/count values only from selected time.

Screenshots
image

Recommend Projects

  • React photo React

    A declarative, efficient, and flexible JavaScript library for building user interfaces.

  • Vue.js photo Vue.js

    ๐Ÿ–– Vue.js is a progressive, incrementally-adoptable JavaScript framework for building UI on the web.

  • Typescript photo Typescript

    TypeScript is a superset of JavaScript that compiles to clean JavaScript output.

  • TensorFlow photo TensorFlow

    An Open Source Machine Learning Framework for Everyone

  • Django photo Django

    The Web framework for perfectionists with deadlines.

  • D3 photo D3

    Bring data to life with SVG, Canvas and HTML. ๐Ÿ“Š๐Ÿ“ˆ๐ŸŽ‰

Recommend Topics

  • javascript

    JavaScript (JS) is a lightweight interpreted programming language with first-class functions.

  • web

    Some thing interesting about web. New door for the world.

  • server

    A server is a program made to process requests and deliver data to clients.

  • Machine learning

    Machine learning is a way of modeling and interpreting data that allows a piece of software to respond intelligently.

  • Game

    Some thing interesting about game, make everyone happy.

Recommend Org

  • Facebook photo Facebook

    We are working to build community through open source technology. NB: members must have two-factor auth.

  • Microsoft photo Microsoft

    Open source projects and samples from Microsoft.

  • Google photo Google

    Google โค๏ธ Open Source for everyone.

  • D3 photo D3

    Data-Driven Documents codes.