bvaughn / react-devtools-experimental Goto Github PK
View Code? Open in Web Editor NEWExperimental rewrite of the React DevTools extension
Home Page: https://react-devtools-experimental.now.sh
License: MIT License
Experimental rewrite of the React DevTools extension
Home Page: https://react-devtools-experimental.now.sh
License: MIT License
Will try to get a better repro tomorrow. For now just writing up so I don’t forget.
I noticed that if the height is small enough, sometimes messing with items close to the end of the list abruptly scrolls me just a bit above. In other words it doesn’t let me scroll to end myself.
Not sure when it happens but eventually the horizontal selection doesn't apply to the whole line:

Changing between the Elements and Profilers tab loses the vertical scroll position of each.

Happens because there's no subHooks property:

Steps to reproduce:
You'll see the crash.
It might be nice if we had a way to show what the app looked like at the time of each commit (when profiling). I believe this would be possible using the chrome.tabs.captureVisibleTab API, although I don't know how much overhead this might add. Maybe we should only do it when explicitly requested?
I recently added screenshots to the Profiler UI (c111288). But because of how this was implemented, it may not capture screenshots for the first few commits in the case of reload-and-profile.
Maybe it would be possible to move the logic for when a screenshot should be captured to the backend (which gets injected early) and then lazily request the screenshot data like we do with other suspense info.
Notes from a chat with Benoit:
It would be nice if starting profiling (or reload and profiling) in the browser auto-started profiling in DevTools.
It would also be nice if viewing a range of time in the Performance tab narrowed down the commits within the Profiler. At least starting the profilers at the same time would enable a manual match-up.
To my knowledge, none of the currently available APIs (including experimental) would enable us to support this level of integration.
It would be nice if there was an easy way to navigate to the parent node. For example by pressing "left" on keyboard. Currently there's no obvious way to do it — which makes navigation in a tree with deeply nested siblings challenging. (Recording is my unsuccessful attempt to find a parent node)

I got this on FB.com sandbox:

Before this becomes stable, we need to check if we are regressing accessibility on any important existing interactions.
At least, we should probably make the tree view focusable.
Are error, target, shimhash, children[1] nulls? Undefineds? Empty strings? Would be cool if there were clarifying hints for empty values.


When I scroll up a deep tree, the horizontal scrolling adjusts. This is great because I don't lose sight of what I'm scrolling. It's probably not intentional and just follows from decreasing width, but it's still helpful.
However, I find scrolling down a deep tree to be a painful experience. I always eventually see blanks, and have to either click (causing a slightly disorienting jump) or manually scroll right horizontally.

I wonder if we could make this experience better.
We know line numbers for some elements through JSX __source. Can we surface that? I think current DevTools does that for currently selected element although not 100% sure.
Maybe in the owner stack somehow.
Seems a bit cluttering when they're unused:

The feature I do wish was there (when not searching) is some kind of back-forward navigation between last selected items there. But that's more of a feature request.
It is possible to get the browser extension stuck in some sort of fast loop of sending "inspectElement" messages across the bridge. Not sure of repro steps here, but when it happens it sucks up a lot of CPU and eventually crashes the extension.
I think it's a bit weird how component name gets trimmed vertically by an opaque white border at the top.

Can we remove it to match how scroll views usually work?
Shows up as 0x0 thing in the corner. While this might make sense as findDOMNode behavior, Ideally we'd highlight the fallback instead in this case.
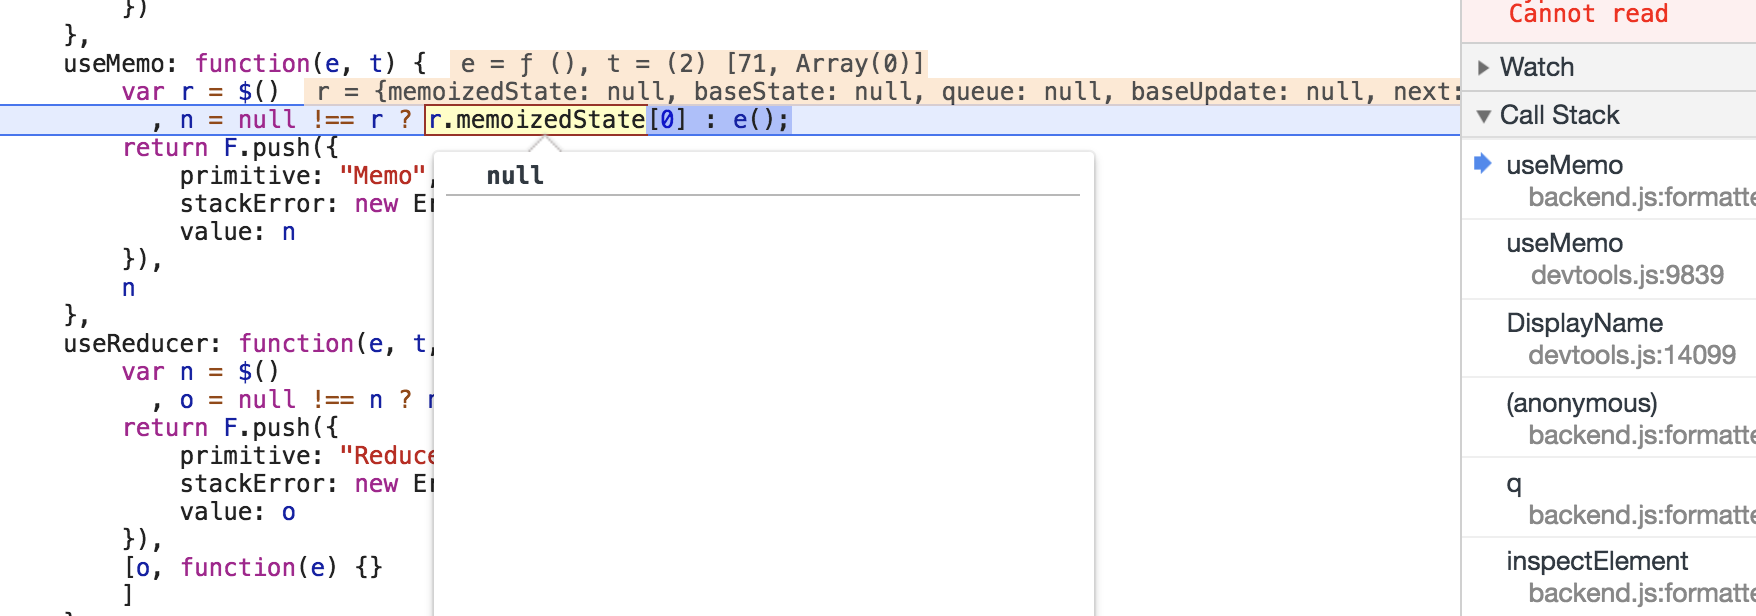
Not sure how this happened, and where the code lives. Is this from debug-tools?
hooks.memoizedState is null but we read [0] from it.
You can see the actual hook is the context one. Maybe it's the issue you fixed on master.


Really looking forward to React DevTools 4.0.0 turning stable!
Here's a little glitch I realised whilst using it, couldn't find any related issue yet:
Tab – change won't be appliedEnter – changes will be applied)While not necessarily a bug, I found it confusing as pressing tab is what I usually do in chrome dev tools.
Pretty sure this string isn't shown/wrapped fully. It seems like it goes outside the screen but I can't scroll it either.

With 10,000 item nesting in DeeplyNestedComponents case:

Not super realistic but we could fix this by avoiding recursion in the traversal.
I love this mode but it's pretty hard to click and not land on the scrollbar.

Repro sandbox: https://ojw06w365q.codesandbox.io/
Visual bug:

In this case, it looks like the tree base duration of the Suspense node is correct, but the chart incorrectly shows both the fallback and suspended children so they don't fit.
I miss the behavior of old DevTools that kept Chrome Elements and the React Components selection state in sync. I don't know how hard it would be to implement, but filing to look later.
Maybe somebody in open source can contribute?
(f1fc4b0) It would be nice if up/down arrows worked inside of it (instead of tabbing). Similar to how dropdowns are usually implemented.
(d6bd3dc) There's a weird buggy condition but I can't reproduce it now. Worth keeping an eye on: #7 (comment)
I expect to be able to inspect an element without actually interacting with it. Since in many cases that would cause an undesirable action (such as with buttons and popups).

This only happens for components at the bottom of the scroll:

Maybe we could make them fixed (but noops) while it's loading data? Otherwise it flickers when navigating between many items.

They're not really blank. But it would be nice if every selection change ensured the name of the currently selected component was always in the view horizontally.

Seems a bit weird to me it's centered.

This also looks odd:

Profiler views aren't searchable, and so you can't easily go from a problematic component to its source code. Maybe we could cross link for Fibers that happen to still be in the tree?
Benoit shared feedback that it would be helpful to show the base duration for the tree (and/or selected element) to get a sense of the total cost over time. (Not sure yet what we'd call this.)
I don't see the need for a hand cursor over the whole area. It's fairly obvious those are selectable, and they're not links. I would suggest a default cursor.
I would suggest focusing/selecting an element on mousedown rather than click. It's not a button. That's how selection works in Chrome elements, MacOS finder, text boxes, etc. It would also make right pane feel subjectively faster since it would start loading earlier.

This was introduced by #53.
You can only see the unevenness when the tree is small enough to fit on a single screen:

I think we can just hide that focus ring altogether, and instead either show a custom one in the right area (e.g. via focus events), or not show it altogether (somewhat worse).
An ideal version would be to show it in the right place and only if you navigated into the area by tabbing.
This could enable us to provide a better user experience than the flash of "Loading.." text when selection changes.
Ideally it would also be nice to...
Maybe we could introduce the concept of a hovered element/index to the tree context. I'm not sure if this would make the already complicated code too complicated. Potentially it would... conceptually though, we could avoid requesting props for hovered elements entirely. We could even (potentially) style an unconfirmed hover differently from the way we'd style a regular one. Suspense would be a prerequisite for this sort of feature, since we can't conditionally use hooks to e.g. subscribe.
Not sure how useful this particular view is, but I forgot to implement it.
I think, rather than building a whole new chart type for this, I could maybe just show the commits (and their durations) in the right hand properties panel, like I do with interactions. Clicking on a commit would select that commit.
With this case:
import React, { Suspense, useState } from 'react';

function SuspenseTree() {
  return (
    <>
      <h1>Suspense</h1>
      <Suspense fallback={<h2>Loading outer</h2>}>
        <Parent />
      </Suspense>
    </>
  );
}

function Never() {
  throw new Promise(resolve => {});
}

function Parent() {
  return (
    <div>
      <Suspense fallback={<h3>Loading inner 1</h3>}>
        <Child>Hello</Child>
      </Suspense>
      <Suspense fallback={<h3>Loading inner 2</h3>}>
        <Child>World</Child>
      </Suspense>
      <Suspense fallback={<h3>This will never load</h3>}>
        <Never />
      </Suspense>
      <LoadLater />
    </div>
  );
}

function LoadLater() {
  const [loadChild, setLoadChild] = useState(0);
  return (
    <Suspense
      fallback={<h4 onClick={() => setLoadChild(true)}>Click to load</h4>}
    >
      {loadChild ? (
        <h4 onClick={() => setLoadChild(false)}>
          Loaded! Click to suspend again.
        </h4>
      ) : (
        <Never />
      )}
    </Suspense>
  );
}

function Child({ children }) {
  return <p>{children}</p>;
}
Clicking on "load" / "suspend" / "load" three times causes an error:
Uncaught TypeError: Cannot read property 'parentID' of undefined
    at _loop (devtools.js:13988)
    at Bridge.<anonymous> (devtools.js:14059)
    at Bridge.emit (devtools.js:1623)
    at devtools.js:13195
    at devtools.js:22390
_loop @ devtools.js:13988
(anonymous) @ devtools.js:14059
emit @ devtools.js:1623
(anonymous) @ devtools.js:13195
(anonymous) @ devtools.js:22390
postMessage (async)
send @ backend.js:14977
send @ backend.js:14504
(anonymous) @ backend.js:12211
(anonymous) @ devtools.js:21895
emit @ devtools.js:21894
flushPendingEvents @ backend.js:12983
handleCommitFiberRoot @ backend.js:13380
onCommitFiberRoot @ devtools.js:21933
(anonymous) @ app.js:3565
(anonymous) @ app.js:3559
onCommitRoot @ app.js:3567
commitRoot @ app.js:5089
completeRoot @ app.js:5418
performWorkOnRoot @ app.js:5399
performWork @ app.js:5381
performSyncWork @ app.js:5379
interactiveUpdates$2 @ app.js:5431
interactiveUpdates @ app.js:2098
dispatchInteractiveEvent @ app.js:2744
Seems like this is not very useful. I keep doing it by accident.

Can we disable selection and make the cursor a pointer instead of a text caret?
It would be nice to stay on the last selected component. Currently it seems like we're jumping to the initial empty state. I just want to exit the mode — not lose the selection context.

Uncaught TypeError: Failed to execute 'getComputedStyle' on 'Window': parameter 1 is not of type 'Element'.
    at devtools.js:16187
    at commitHookEffectList (devtools.js:6110)
    at commitLifeCycles (devtools.js:6110)
    at commitAllLifeCycles (devtools.js:6323)
    at HTMLUnknownElement.callCallback (devtools.js:2943)
    at Object.invokeGuardedCallbackDev (devtools.js:2963)
    at invokeGuardedCallback (devtools.js:2979)
    at commitRoot (devtools.js:6355)
    at devtools.js:6667
    at Object.unstable_runWithPriority (devtools.js:11970
I think it crashes because ownerStack.length has changed but we're already hiding them so there's actually just two children.
We need to make it so that change in owner stack size forces it to not overflow at first, so we can measure it again.
Noticed this debugging DevTools itself.
While not critical, I think it would be nice if changes that were not initiated by the developer (such as actual scrolling or clicks) wouldn't cause the selected element to jump. In other words, I would expect that below the first scroll "page", prepends anywhere earlier in the tree would keep the perceived scroll position instead of shifting it up and down.
Not sure if it's inherent to the current virtual scrolling implementation or something that would be easy to fix. Maybe virtual scrolling actually makes it easier to fix because we control everything?

The new devtools look really amazing and are a huge level-up! The interface is much nicer and feels smoother to me 👍 I'm currently working my way through the Overview document and have a few questions:
1. What counts as an owner?
We don't have something like that in Preact, but I guess this is a pointer to the parent vnode/fiber?
2. What's the shape of an inspectElement message?
The document has a section about requesting additional information (props, states, maybe hooks?) via a a dedicated inspectElement message. The definition for it is not present in the paper. Maybe it's currently in progress (the repo has "experimental" in the title after all :) )
3. Strict message order like in the current devtools?
The current devtools expect the events to be sent in a very specific order. The document mentions that the goal is to only sent patches across the barrier. If I understand it correctly it means that the strict order isn't necessary anymore, but could be encouraged for performance reasons depending on how the extension works. When we're just sending patches, can effectively skip generating an event for a fiber that hasn't changed at all?
4. Is there any rough ETA?
I'm mainly asking because at some point we'll need to switch to the new protocol for preact. Do we need to start working on it right now or is the release a few weeks/months off in the future?
All in all I love the direction the devtools are taking! That's some really cool stuff you're working on 👍 Moving the instance detection to the adapter instead of doing it inside the extension is a great move and will make our integration a lot easier. Really looking forward to this 💯
This seems to happen if I open DevTools before the page fully loads.
Then searching will select first root instead of first matching element.

Hey,
while trying to add it as temporary add-on it results in an error, no matter how I do it. Current React Devtools is disabled.
Firefox Version: Developer Edition 67.0b4 (64-bit)
Full error message:
There was an error during installation: Error while loading 'jar:file:///Users/deanhidri/Downloads/packed.zip!/manifest.json' (NS_ERROR_FILE_CORRUPTED)
I've seen some cases where the Profiler reports a Suspense component as the slowest rendering component in a commit. This seems very unlikely. In hindsight, I think the problem is with calculateSelfDuration which assumes it should always subtract the actualDuration of immediate children. I think that in the case of a suspended Suspense, we need to skip over the immediate Fragment and subtract the time of the fallback tree.
Show a "throttled" placeholder or something in the UI
The owner stack navigation is not great when there's horizontal overflow:

It would be nice to use a dynamic layout that only showed the current horizontal navigation if all items fit within the available space. When items can't fit, the UI could show a more minimal form:
[ x ] [ ⋮ ] LegacyContextComponent
Clicking the "⋮" would show a drop down menu with the full list, e.g.:
[ x ] [ ⋮ ] LegacyContextComponent
      ┌────────────────────────┐
      │ InspectableElements    │
      │ Contexts               │
      │ LegacyContextComponent │
      └────────────────────────┘
A declarative, efficient, and flexible JavaScript library for building user interfaces.
🖖 Vue.js is a progressive, incrementally-adoptable JavaScript framework for building UI on the web.
TypeScript is a superset of JavaScript that compiles to clean JavaScript output.
An Open Source Machine Learning Framework for Everyone
The Web framework for perfectionists with deadlines.
A PHP framework for web artisans
Bring data to life with SVG, Canvas and HTML. 📊📈🎉
JavaScript (JS) is a lightweight interpreted programming language with first-class functions.
Some thing interesting about web. New door for the world.
A server is a program made to process requests and deliver data to clients.
Machine learning is a way of modeling and interpreting data that allows a piece of software to respond intelligently.
Some thing interesting about visualization, use data art
Some thing interesting about game, make everyone happy.
We are working to build community through open source technology. NB: members must have two-factor auth.
Open source projects and samples from Microsoft.
Google ❤️ Open Source for everyone.
Alibaba Open Source for everyone
Data-Driven Documents codes.
China tencent open source team.
