
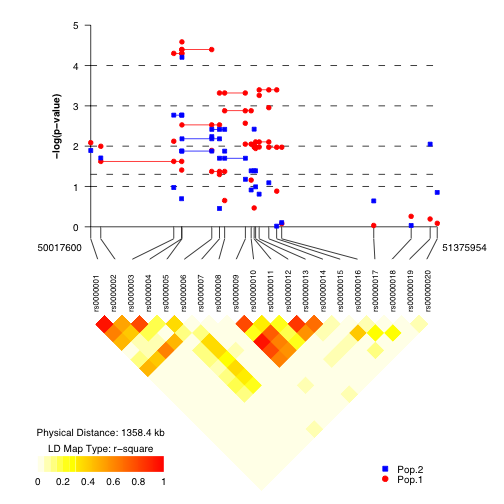
snp.plotter is an R package that creates publishable-quality plots of p-values using single SNP and/or haplotype data. Main features of the package include options to display a linkage disequilibrium (LD) plot and the ability to plot multiple sets of results simultaneously. Plots can be created using global and/or individual haplotype p-values along with single SNP p-values. Images are created as either Portable Document Format (PDF) or Encapsulated (EPS) files.
Here is a sample image as both a PDF and a EPS image. PDF images can be viewed using the free Adobe Reader software. EPS (or PDF) images can be viewed using front-end software for Ghostscript, a Postscript and PDF interpreter: Ghostview and GV for Unix/X11 systems and GSView for Windows.
Researchers conducting gene association studies who need to create images showing results in the form of p-values of their work along with a linkage disequilibrium plot to show the underlying structure of the study population. Because snp.plotter is a visualization tool, the type of study design used either family-based, case-control, or a combination is irrelevant.
- Publishable-quality graphics in resolution-independent formats
- Free and open source
- Visualization of global or individual haplotype p-values
- Visualization of results either physically spaced or evenly spaced
- Ability to plot multiple sets of results
- Optional web interface
- Customizable parameters
- Labels
- Symbols
- Colors/color schemes
- LD metric
- P-value threshold
snp.plotter requires the installation of R, the statistical computing software, freely available here for Linux, Windows, or MacOS. snp.plotter uses three contributed packages: grid, lattice, and genetics available from the R Project website. snp.plotter can be downloaded CRAN. Packages in the current working directory of R can be installed using the install.packages command.
install.packages("snp.plotter")
In Windows, make sure that you have downloaded the .zip version of a package, which is a pre-compiled binary. Change the word PACKAGE_FILENAME to the name of the package being installed.
install.packages("PACKAGE_FILENAME.zip", repos=NULL)
In Unix/Linux, make sure that you have downloaded a source package, the .tar.gz version, of a package. Change the word PACKAGE_FILENAME to the name of the package being installed.
install.packages("PACKAGE_FILENAME.tar.gz", repos=NULL)
The following error indicates that additional packages need to be installed: PACKAGE_FILENAME can be grid or genetics. These packages can be downloaded from CRAN. and installed using the same process described above.
Error: package 'PACKAGE_FILENAME' could not be loaded
install.packages("devtools")
library(devtools)
install_github(repo="cannin/snp_plotter",
  build_vignette=FALSE,
  dependencies=TRUE,
  args="--no-multiarch",
  subdir="snp.plotter"
)
Once snp.plotter and its dependencies are installed, snp.plotter can be loaded into R using this command:
library(snp.plotter)
snp.plotter is then run using the following command. Explanation of snp.plotter configuration files and input files is provided in the file formats section. The configuration file specifies all the characteristics for the plot to be produced and the names of the data files to be used as input. Example configuration and input files are also provided.
snp.plotter(config.file="config.txt")
Information about the configuration options is provided in the documentation on CRAN, which can viewed from within R using this command.
?snp.plotter
The listing below shows the most common scenarios for inclusion of a figure into a publication; methods will vary based on the intended publication type:
- Inclusion of PDF into Word document: PDF images can be selected and copied using the Adobe Reader snapshot tool. These images can then be pasted into a Word document.
- Inclusion of PDF/EPS into LaTeX document: Images included into DVI file using latex must be in the EPS format. PDF documents created by pdflatex cannot use files in the EPS format and requires the PDF format. The following is basic LaTeX code for including an image. FILENAME must be changed to the appropriate filename.
\documentclass{article}
\usepackage{graphicx}
\begin{document}
\begin{figure}
\includegraphics{FILENAME}
\end{figure}
\end{document}
- Conversion of PDF/EPS file into other formats using Ghostscript: Ghostscript can be used to convert PDF and EPS files into a variety of raster formats such as JPG, BMP, PNG, etc. The following commandline converts an EPS image into a JPG image; the resulting image has a resolution of 300 DPI and pixel dimension of 1050x1050 pixels. Further information on the usage of Ghostscript can be found here. FILENAME must be changed to the appropriate filename.
gs -q -dNOPAUSE -dSAFER -dBATCH -r300 -g1050x1050 -sOutputFile=FILENAME.jpg -sDEVICE=jpeg FILENAME.eps
snp.plotter uses tab-delimited text files as input files. These files can be created in a basic text editor such as Notepad in Windows or Excel saved as tab-delimited files using the "Save As" option. A dataset is composed a configuration file, a SNP and haplotype file for each result set, one genotype file, and an optional palette file. More information about these files can be found in the documentation on CRAN.
- Configuration file: The configuration file is the preferred method of running snp.plotter; it allows users to save preferred settings and avoids the inconvenience of writing extended R commands, repeatedly. There cannot be spaces after commas. A complete description of all possible plot characteristics can be found in the documentation on CRAN. Result sets without haplotype results should be placed after those with results; no HAP.FILE entry should be specified in this case.
SNP.FILE=snp8_ss.txt,snp8_ss2.txt
HAP.FILE=snp8_haplo.txt,snp8_haplo2.txt
PALETTE.FILE=palette.txt
EVEN.SPACED=TRUE
USE.GBL.PVAL=TRUE
DISP.HAP=TRUE
DISP.LDMAP=FALSE
LD.COLOR.SCHEME=heat
COLOR.LIST=blue,red
SYMBOLS=circle,NA
PVAL.THRESHOLD=1
LAB.Y=ln
GENOTYPE.FILE=snp8_geno.txt
LD.TYPE=rsquare
DISP.COLOR.BAR=TRUE
DISP.TYPE=symbol
DISP.LEGEND=TRUE
SAMPLE.LABELS=Sample 1,Sample 2
IMAGE.TYPE=eps
DISP.SNP=TRUE
IMAGE.TITLE="8 SNP Example"
IMAGE.NAME=snp8_example
IMAGE.SIZE=3.5
- SNP.FILE: SNP.FILE includes four necessary columns ASSOC, SNP.NAME, LOC, and SS.PVAL corresponding to positive or negative association (indicating protective or susceptibility alleles, a SNP label, the location, and a p-value for each SNP. SNP labels may not start with numbers. In the figure, SNPs are indicated by the symbols chosen for the data, if symbol type 'NA' is specified, the SNP.FILE ASSOC column is read and an up-triangle and down-triangle are used to indicate positive and negative association (indicating susceptibility or protective alleles), respectively.
ASSOC	SNP.NAME	LOC	SS.PVAL
+	rs10_8	126272509	0.065
-	rs11_8	126274467	0.029
+	rs12_8	126275017	0.046
-	rs13_8	126275750	0.005
+	rs14_8	126283659	0.258
+	rs15_8	126284467	0.036
-	rs16_8	126298007	0.05
-	rs17_8	126299520	0.202
- HAP.FILE: HAP.FILE includes three necessary columns ASSOC, G.PVAL, and I.PVAL corresponding to positive or negative association (indicating protective or susceptibility alleles, a global p-value and an individual p-value for each haplotype followed by a set of columnns of SNPs with corresponding haplotypes. Haplotypes are presented in a step-wise fashion with the major allele given as 1 and the minor allele as 2; haplotype variants for a set of SNPs should be grouped. SNP labels in HAP.FILE must be the same as in SNP.FILE, and only SNPs with corresponding haplotypes need to be included. In the figure, unfilled symbols connected by solid lines are used to indicate global haplotype p-values, (a circle is used if no symbol is specified for the dataset). Unfilled and filled symbols are used to indicate alleles 1 and 2, respectively connected by solid lines and dashed lines for positive and negative association (indicating susceptibility or protective haplotypes) when using indivudal haplotype p-values.
ASSOC	G.PVAL	I.PVAL	rs10_8	rs11_8	rs12_8	rs13_8	rs14_8	rs15_8	rs16_8	rs17_8
-	0.015	0.004	1	1	1
+	0.015	0.062	1	2	2
+	0.075	0.079		1	1	1
+	0.075	0.039		2	2	2
-	0.032	0.121			1	1	1
+	0.032	0.153			1	2	2
+	0.425	0.474				1	1	1
+	0.425	0.003				2	2	2
+	0.1	0.077					1	1	1
+	0.1	0.1					1	2	2
-	0.003	0.341						1	1	1
+	0.003	0.001						2	2	2
- GENOTYPE.FILE: GENOTYPE.FILE is a modified Linkage PED file. Each row should have the following information: family ID, individual ID, father ID, mother ID, sex, and affection status followed by marker loci coded as binary factors, as shown in the example below. This file should not have column headers.
1	1	0	0	1	1	1	1	1	1
2	1	0	0	2	1	1	1	1	1
3	1	0	0	1	1	1	1	1	2
4	1	0	0	2	1	1	1	2	2
5	1	0	0	1	1	0	0	1	1
- PALETTE.FILE (OPTIONAL): PALETTE.FILE can be used to specify a color palette for the LD heatmap. To use the the PALETTE.FILE option, LD.COLOR.SCHEME must be set to "custom" and a file name must be provided to the PALETTE.FILE option. Custom color schemes cannot be used in conjunction with predefined color schemes such as "heat" or "gray". PALETTE.FILE colors are hexidecimal HTML color codes; one color per line. The first and last colors correspond to the lowest and highest value of the chosen LD metric, respectively.
FFFFFF
CCCCFF
9999FF
6666FF
3333FF
0000FF
0000CC
000099
000066
- Download from CRAN
- Download example configuration and input files: 20 SNP dataset
- Learn about the R project for statistical computing
- Read the documentation
- View release notes
- Augustin Luna, PhD
- Kristin Nicodemus, PhD, MPH
Anushka Aqil for her feedback
Please cite the following publication, if you include figures generated with snp.plotter
Luna A, Nicodemus KK. snp.plotter: an R-based SNP/haplotype association and linkage disequilibrium plotting package. Bioinformatics. 2007 Mar 15;23(6):774-6.


