
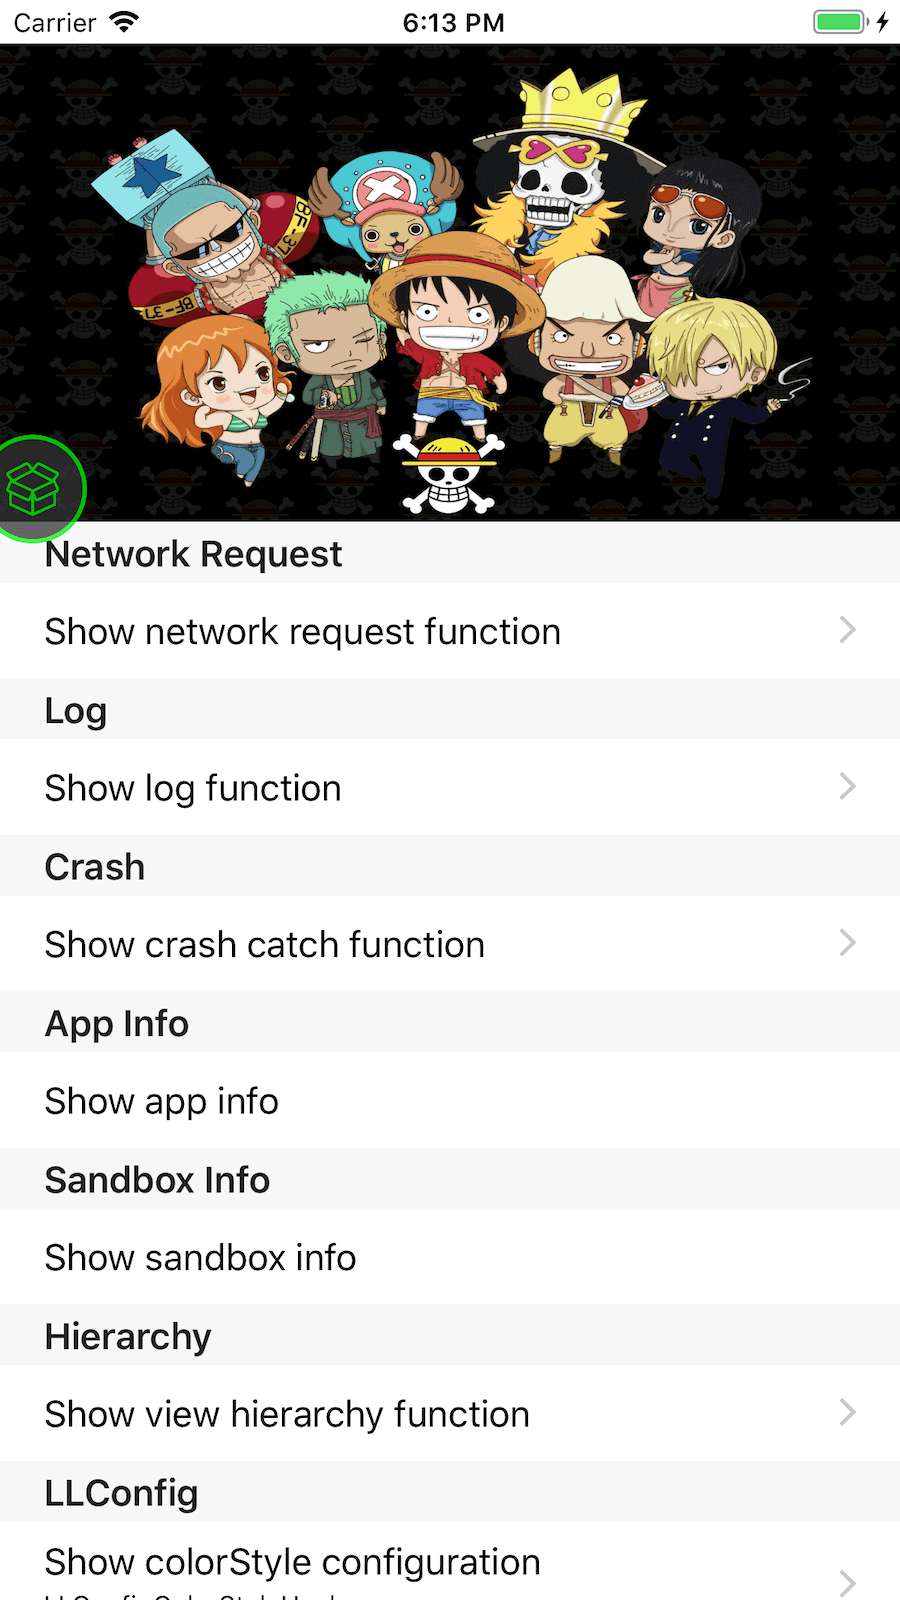
LLDebugTool is a debugging tool for developers and testers that can help you analyze and manipulate data in non-xcode situations.
Choose LLDebugTool for your next project, or migrate over your existing projects—you'll be happy you did!

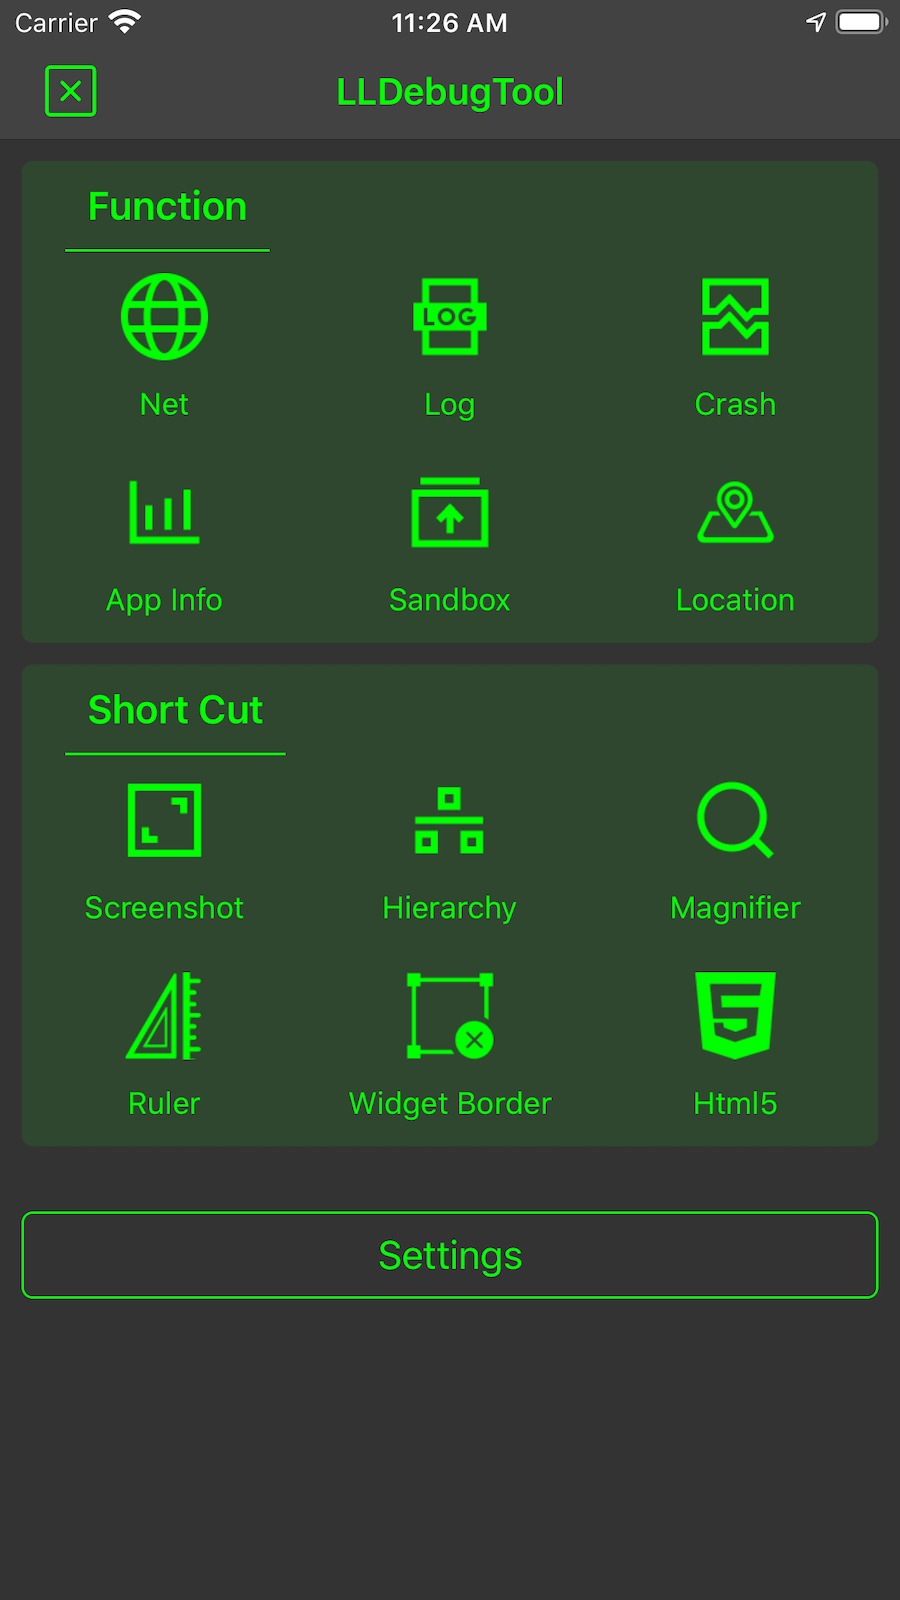

What can you do with LLDebugTool?
-
Always check the network request or view log information for certain events without having to run under XCode. This is useful in solving the testers' problems..
-
Easier filtering and filtering of useful information.
-
Easier analysis of occasional problems.
-
Easier analysis of the cause of the crash.
-
Easier sharing, previewing, or removing sandbox files, which can be very useful in the development stage.
-
Easier observe app's memory, CPU, FPS and other information.
Adding LLDebugTool to your project
CocoaPods
CocoaPods is the recommended way to add LLDebugTool to your project.
- Add a pod entry for LLDebugTool to your Podfile
pod 'LLDebugTool',If only you want to use it only in Debug mode, Add a pod entry for LLDebugTool to your Podfilepod 'LLDebugTool' ,:configurations => ['Debug']. - Install the pod(s) by running
pod install. If you can't searchLLDebugTool, runningpod repo updatebeforepod install. - Include LLDebugTool wherever you need it with
#import "LLDebug.h"or you can write#import "LLDebug.h"in your .pch in your .pch file.
Source files
Alternatively you can directly add the source folder named LLDebugTool. to your project.
- Download the latest code version or add the repository as a git submodule to your git-tracked project.
- Open your project in Xcode, then drag and drop the source folder named
LLDebugTool. When you are prompted to "Choose options for adding these files", be sure to check the "Copy items if needed". - Integrated FMDB to your project,FMDB is an Objective-C wrapper around SQLite.
- Include LLDebugTool wherever you need it with
#import "LLDebug.h"or you can write#import "LLDebug.h"in your .pch in your .pch file.
Usage
Get Started
You need to start LLDebugTool at "application:(UIApplication * )application didFinishLaunchingWithOptions:(NSDictionary * )launchOptions", Otherwise you will lose some information.
If you want to configure some parameters, must configure before "startWorking". More config details see LLConfig.h.
Quick Start
#import "AppDelegate.h"
#import "LLDebug.h"

- (BOOL)application:(UIApplication *)application didFinishLaunchingWithOptions:(NSDictionary *)launchOptions {
    // The default color configuration is green background and white text color.

    // Start working.
    [[LLDebugTool sharedTool] startWorking];

    // Write your project code here.
    return YES;
}
Start With Custom Config
#import "AppDelegate.h"
#import "LLDebug.h"

- (BOOL)application:(UIApplication *)application didFinishLaunchingWithOptions:(NSDictionary *)launchOptions {
    // The default color configuration is LLConfigColorStyleHack.

    // If you want to use other color configurations, you can use the following line.
    [LLConfig sharedConfig].colorStyle = LLConfigColorStyleSimple;

    // If you want to use a custom color configuration, you can use the following line.
    [[LLConfig sharedConfig] configBackgroundColor:[UIColor orangeColor] textColor:[UIColor whiteColor] statusBarStyle:UIStatusBarStyleDefault];

    // If you don't want to use color configuration, you can use the following line.
    [LLConfig sharedConfig].useSystemColor = YES;

    // Start working.
    [[LLDebugTool sharedTool] startWorking];

    // Write your project code here.
    return YES;
}
Log
Print and save a log. More log macros details see LLLogHelper.h.
Save Log
#import "LLDebug.h"

- (void)testNormalLog {
    // Insert an LLog where you want to print.
    LLog(@"Message you want to save or print.");
}
Save Log with event and level
#import "LLDebug.h"

- (void)test
- (void)testEventErrorLog {
    // Insert an LLog_Error_Event where you want to print an event and level log.
    LLog_Error_Event(@"The event that you want to mark. such as bugA, taskB or processC.",@"Message you want to save or print.");
}
Network Request
You don't need to do anything, just call the "startWorking" will monitoring most of network requests, including the use of NSURLSession, NSURLConnection and AFNetworking. If you find that you can't be monitored in some cases, please open an issue and tell me.
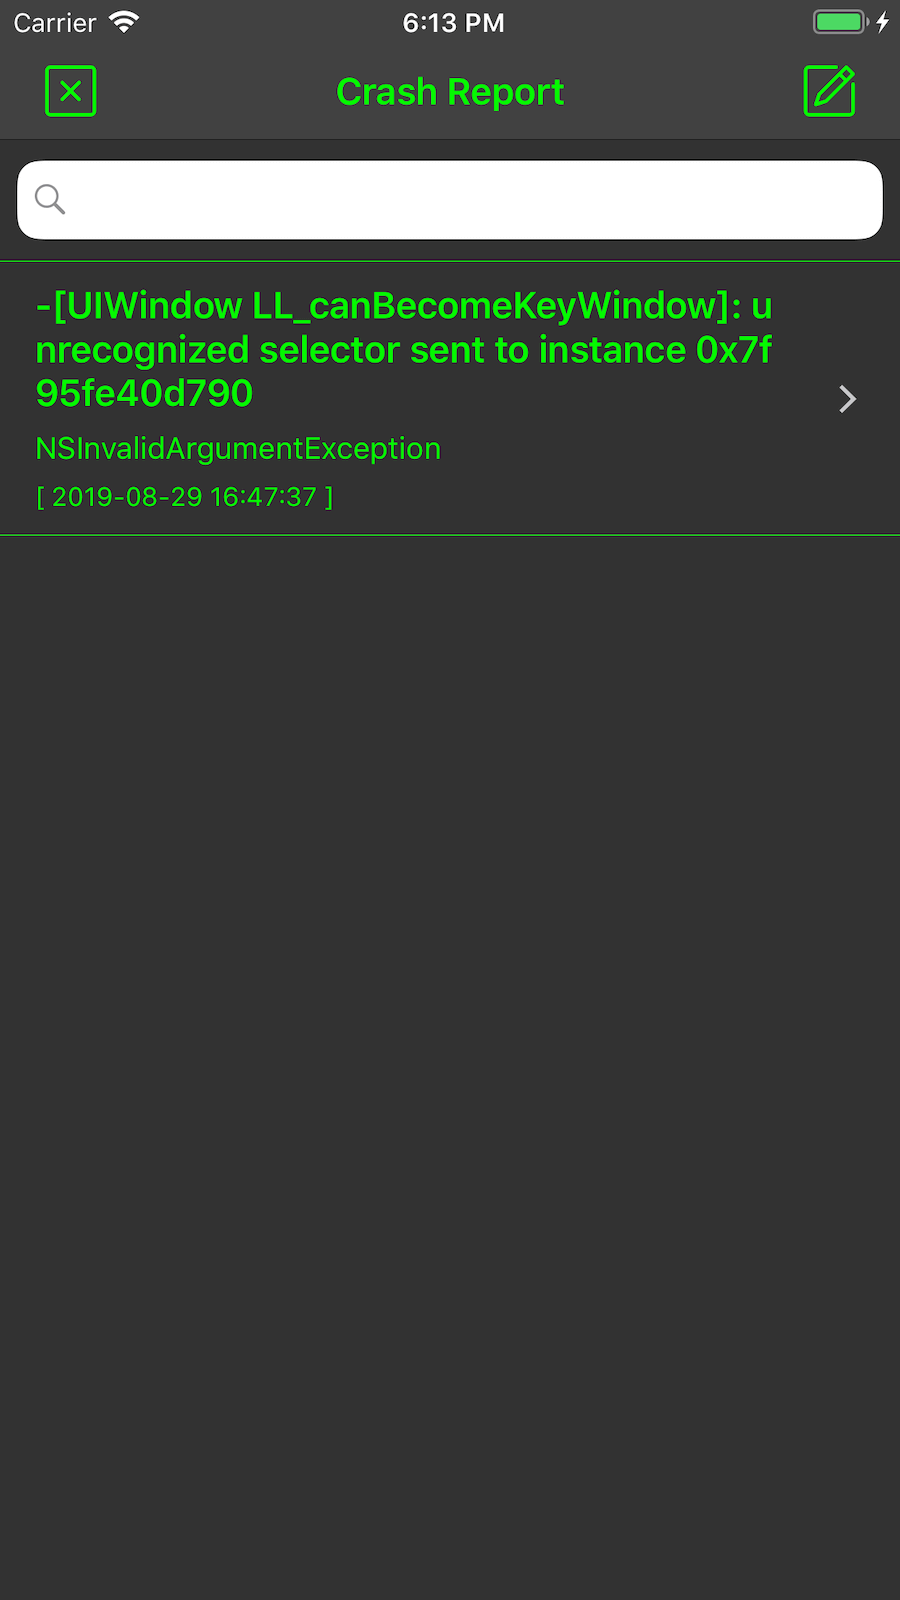
Crash
You don't need to do anything, just call the "startWorking" to intercept the crash, store crash information, cause and stack informations, and also store the network requests and log informations at the this time.
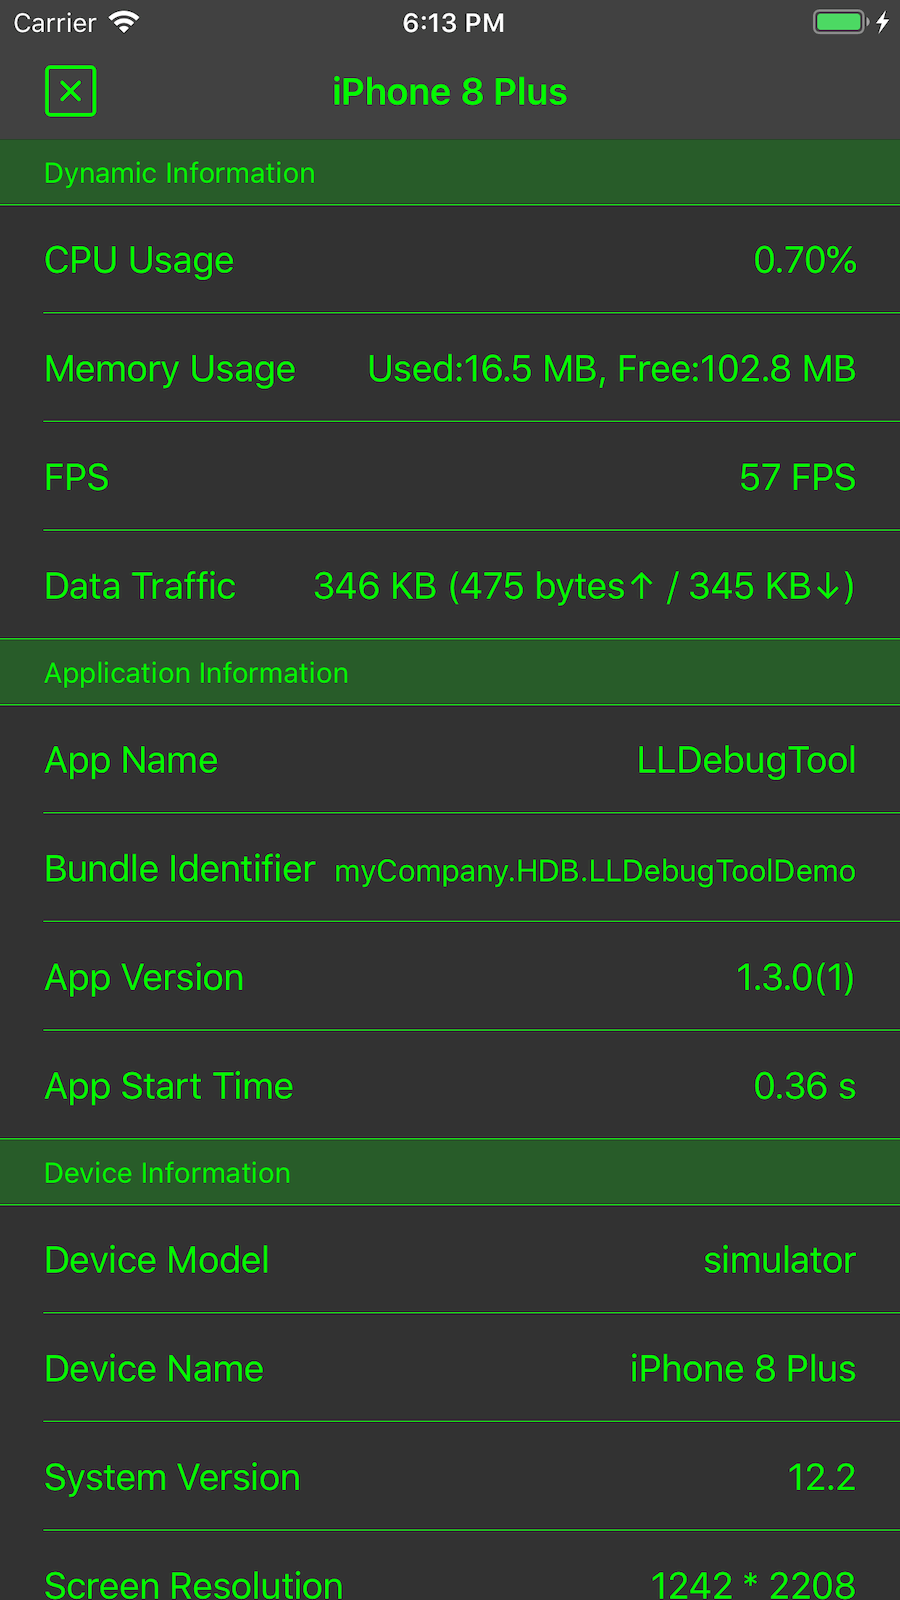
AppInfo
LLDebugTool monitors the app's CPU, memory, and FPS. At the same time, you can also quickly check the various information of the app.
Sandbox
LLDebugTool provides a quick way to view and manipulate sandbox, you can easily delete the files/folders inside the sandbox, or you can share files/folders by airdrop elsewhere. As long as apple supports this file format, you can preview the files directly in LLDebugTool.
More Usage
You can download and run the "LLDebugToolDemo" to find more use with LLDebugTool. The demo is build under XCode9.3, ios 11.3 and cocoapods 1.5.0. If there is any version compatibility problem, please let me know.
Requirements
LLDebugTool works on iOS 8+ and requires ARC to build. It depends on the following Apple frameworks, which should already be included with most Xcode templates:
-
UIKit -
Foundation -
SystemConfiguration -
malloc -
mach-o -
mach -
QuickLook -
objc -
sys
Architecture
-
LLDebug.hPublic header file. -
LLConfigConfiguration file.For the custom color , size , identification and other information. If you want to configure anything, you need to focus on this file.
-
LLDebugToolTool files.To start and stop LLDebugTool, you need to look at the "LLDebugTool.h".
-
HelperHelper files.If you're not interested in how the functionality works, you can ignore this folder.
LLAppHelperUse to monitoring app's properties.LLCrashHelperUsed to collect crash information when an App crashes.LLLogHelperUsed to quick print and save log.LLNetworkHelperUse to monitoring network request.LLSandboxHelperUsed to view and operate sandbox files.LLStorageManagerUsed to data storage and reading.
-
UserInterfaceUI files.If you want to modify, view, or learn something about the UI, check out this folder.
BaseThe base class file.CategoriesClass extensions.OthersNon-generic controls.ResourcesImage resources.SectionsViewControllersToolTool.
Communication
- If you need help, open an issue.
- If you'd like to ask a general question, open an issue.
- If you found a bug, and can provide steps to reliably reproduce it, open an issue.
- If you have a feature request, open an issue.
- If you find anything wrong or anything dislike, open an issue.
- If you have some good ideas or some requests, send mail([email protected]) to me.
- If you want to contribute, submit a pull request.
Contact
- Send message in JianShu
- Send email to [email protected]
Change-log
A brief summary of each LLDebugTool release can be found in the CHANGELOG.
License
This code is distributed under the terms and conditions of the MIT license.


