![]()
 Interactive Link
Please note that this software is now an alpha release. Initial conda packages are available, but have not been tested in integration against our other plugins yet. For now, create a fresh conda environment for q2-fmt using the following command:
Mac OS instructions
wget https://data.qiime2.org/distro/fmt/qiime2-fmt-2023.9-py38-osx-conda.yml
CONDA_SUBDIR=osx-64 conda env create -n qiime2-fmt-2023.9 --file qiime2-fmt-2023.9-py38-osx-conda.yml
conda activate qiime2-fmt-2023.9
conda config --env --set subdir osx-64
Linux instructions
wget https://data.qiime2.org/distro/fmt/qiime2-fmt-2023.9-py38-linux-conda.yml
conda env create -n qiime2-fmt-2023.9 --file qiime2-fmt-2023.9-py38-linux-conda.yml
Then activate your new environment as usual.
conda activate q2-fmt-2023.9Please be aware that q2-fmt and q2-stats will be the only visible plugins in this environment.
Example data can be generated using the --example-data flag on each action
described below. This will create a directory structure to match the examples
(you will need to cd into the appropriate directory first).
qiime fmt --example-data fmt-examples/
cd fmt-examples/engraftment/engraftment-baseline/
Plot Engraftment
This pipeline will execute the below actions in order to produce engraftment plots in a single step. To learn more, see the examples below this.
qiime fmt engraftment \
  --i-diversity-measure div-measure.qza \
  --m-metadata-file md.tsv \
  --p-compare baseline \
  --p-time-column week \
  --p-reference-column InitialDonorSampleID \
  --p-subject-column SubjectID \
  --p-where '[SampleType]="stool"' \
  --p-filter-missing-references \
  --p-against-group 0 \
  --p-p-val-approx asymptotic \
  --o-stats stats.qza \
  --o-raincloud-plot raincloud-plot.qzv
Group Timepoints
First the data must be collected from your study and organized into groups with some relevant diversity measure. We will use Faith's Phylogenetic Diversity in these examples, but other measures, including beta diversity metrics, are supported.
This command will produce two collections of groups: one for subjects at each timepoint, and another for references/donors and any control groups.
qiime fmt group-timepoints \
  --i-diversity-measure div-measure.qza \
  --m-metadata-file md.tsv \
  --p-where '[SampleType]="stool"' \
  --p-time-column week \
  --p-reference-column InitialDonorSampleID \
  --p-subject-column SubjectID \
  --p-filter-missing-references \
  --o-timepoint-dists timepoint-dists.qza \
  --o-reference-dists reference-dists.qza
Statistical Tests
Wilcoxon Signed Rank tests and Mann-Whitney U tests are available through q2-stats and can be used for FMT analysis. These two tests are differentiated by the semantic type of the input to ensure the applicability of the test (i.e. only matched pairs for Wilcoxon, and independent groups for Mann-Whitney).
Comparisons for Wilcoxon Signed Rank:
- baseline: Compare each timepoint against a reference timpoint
- consecutive: Compare each timepoint against its next timepoint
Comparisons for Mann-Whitney U:
- reference: Compare other groups against a particular reference group
- all-pairwise: Compare all pairwise groups.
The against-each parameter is needed to compare the timepoints against the
references/controls. The engraftment pipeline above does this
automatically.
qiime stats wilcoxon-srt \
--i-distribution timepoint-dists.qza \
--p-compare baseline \
--p-baseline-group 0 \
--p-p-val-approx asymptotic \
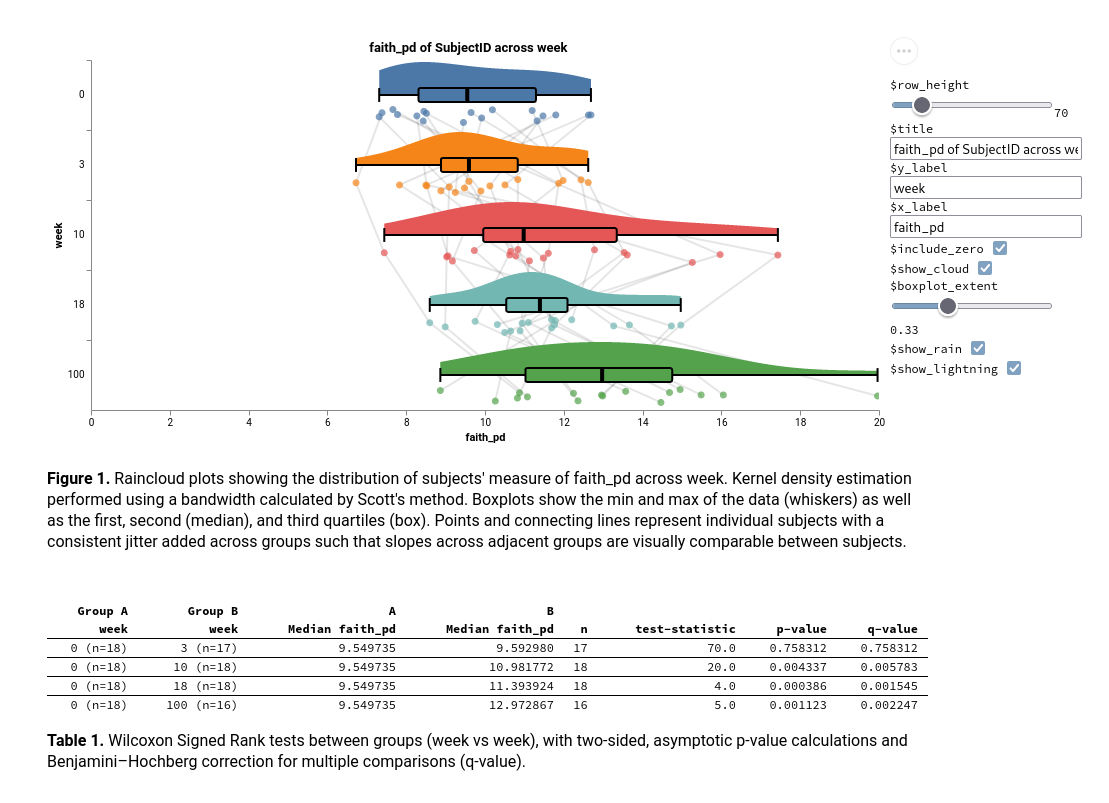
--o-stats stats_baseline0.qzaRaincloud Plots
Also available through q2-stats - a statistical test is not required to generate the plots, but if provided, will produce a table showing the results of the test.
qiime stats plot-rainclouds \
  --i-data timepoint-dists.qza \
  --i-stats stats_baseline0.qza \
  --o-visualization raincloud-baseline0.qzv


