GithubHelp home page GithubHelp logo

chriskmnds / highcharts-zero-align-y-axes Goto Github PK

View Code? Open in Web Editor NEW
12.0 4.0 5.0 249 KB

Highcharts extension that zero-aligns the scales of primary and secondary y-axes.

License: MIT License

JavaScript 93.26% HTML 6.74%

highcharts-zero-align-y-axes's Introduction

Highcharts: zero-align y-axes

Highcharts extension that zero-aligns the scales of primary and secondary y-axes.

Description

The extension adds a new tick positioner that aligns the scales of primary and secondary y-axes. Defaults to a minimal tick positioner in case of a single y-axis. Axes are aligned as follows:

All-positive scales

i.e. scales whose min max values are both +ve.

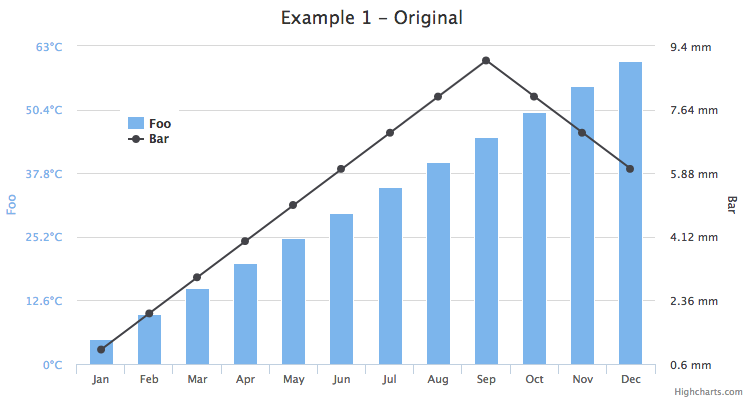
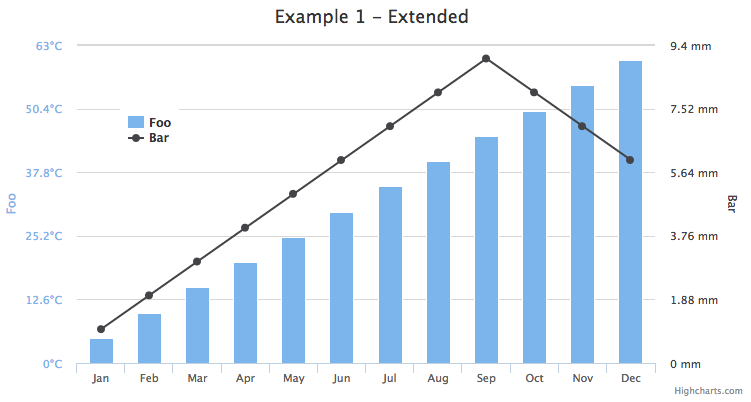
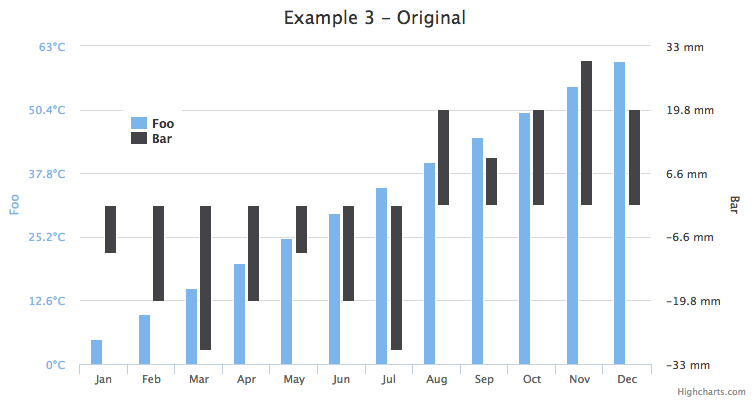
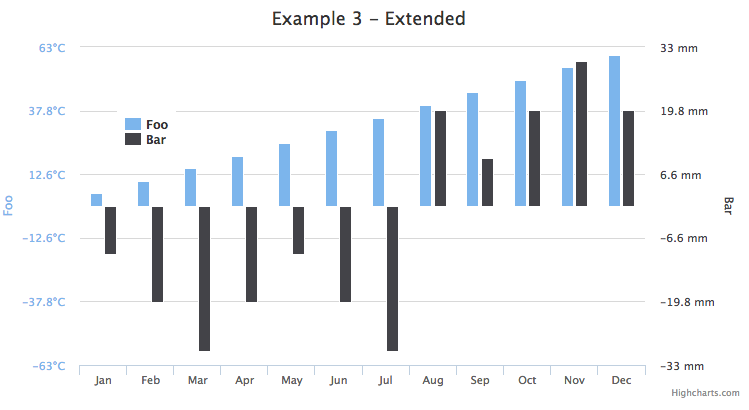
Alignment: Zero (0) set at the bottom of the chart. Consider the example:

Original Chart Extended Chart
highcharts chart highcharts chart

All-negative scales

i.e. scales whose min max values are both -ve.

Alignment: Zero (0) set at the top of the chart.

At least one y-axis with both -ve and +ve values

i.e. primary y: [min:-ve, max:+ve], secondary y2: [min:-ve, max:+ve].

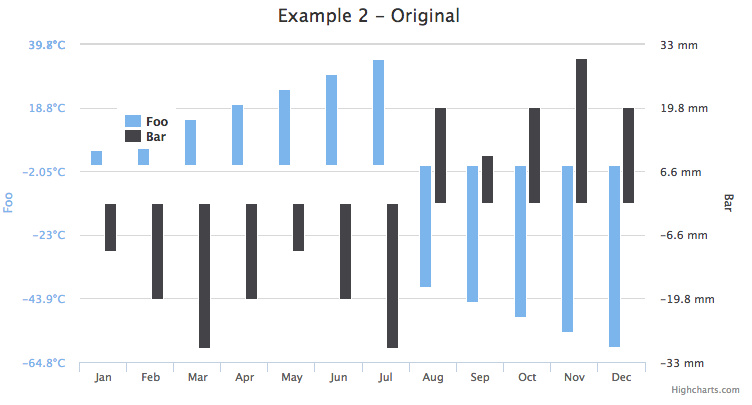
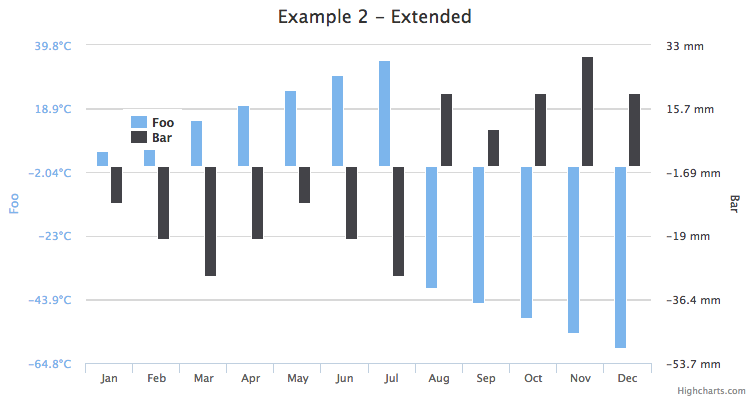
Alignment: Min of both axes set equal to the min/max fraction of the axis with the smallest min. Consider the example:

Original Chart Extended Chart
highcharts chart highcharts chart

One y-axis with all -ve values and the other with both -ve and +ve values

i.e. primary y: [min:-ve, max:-ve], secondary y2: [min:-ve, max:+ve].

Alignment: Max of both axes set equal to the max/min fraction of the axis with the largest max. Consider the example:

Original Chart Extended Chart
highcharts chart highcharts chart

Non-overlaping scales

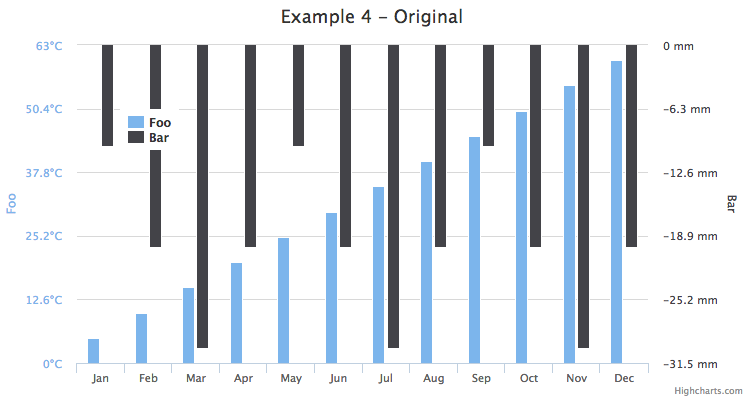
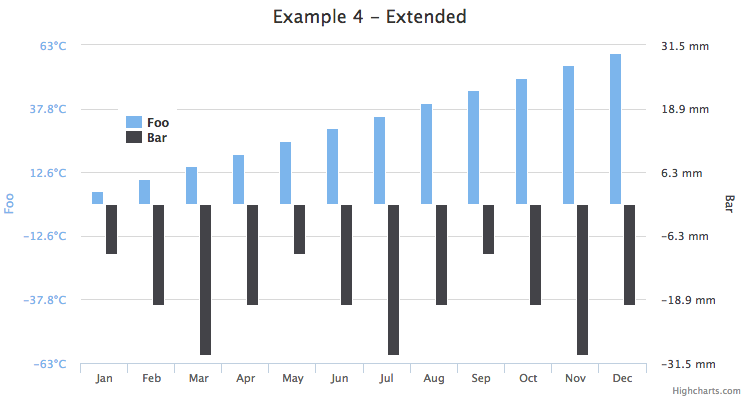
i.e. scales that are in the opposite extremes e.g. primary y: [min:-ve, max:-ve], secondary y2: [min:+ve, max:+ve].

Alignment: Zero (0) set at the center of the chart. Consider the example:

Original Chart Extended Chart
highcharts chart highcharts chart

Usage/Demo

See working plunker for a live demo. You may activate/deactivate the alignment by toggling the variable tickPositioner.zero_align.

Compatibility

Compatible with Highcharts 4.1.7 and earlier.

License

MIT

highcharts-zero-align-y-axes's People

Contributors

chriskmnds avatar

Stargazers

 avatar  avatar  avatar  avatar  avatar  avatar  avatar  avatar  avatar  avatar  avatar  avatar

Watchers

 avatar  avatar  avatar  avatar

highcharts-zero-align-y-axes's Issues

Publish on bower/npm ?

I can do a pull request for configuration files if you want. Thanks for this, working great so far!

Alignment for reversed axis

Hi,
the solution looks promising for me.

Nevertheless I do have a problem that a reversed axis is not aligned. Is there a simple way to achieve this?

How to use this with React Highcharts

I'm trying to use this with react-highcharts library. Is this possible? I was simply importing this library wherever I use ReactHighcharts component, but that doesn't seem to work. The usage instructions in the README is not very useful.

Thanks

Feature Request: Functionality with n many axes

Currently this only works with two series/axes. I have been trying to alter it to work with n many axes but thus far haven't gotten it, mainly due to lack of time. Should I get it to work, I will gladly open a PR (if anyone else is still using this ha)

Doesn't get called after initial rendering

First off thank you for the wonderful plugin.

The one bug i've noticed is that the extension is only called on initial render, meaning if the extremes of the displayed data change, the axes remain fixed to their initial ticks, interval, and extremes.

I assumed that hooking this functionality into the chart.redraw method would do the trick, however it has not.

Thanks

0 Y axis line

Hi, Thanks for the plugin, helped me a lot. Not so much an issue, but a question:

Is it possible to get the 0 axis line to show, I have a chart similar to your example "At least one y-axis with both -ve and +ve values: extended chart" and like your example there's no 0 baseline. I've tried playing with the ticks but not having much luck.

Any advice would be great, thanks.

Axis goes off the chart area

Hi,

Having a problem that occurs when a series on each axis has a large value. One axis doesn't grow to the correct size to display all the points.

I've forked the jsfiddle to demonstrate the problem. I want each axis to be about the same size with 0 roughly in the middle.

https://jsfiddle.net/v8uxggof/

Zero alignment of Y axes doesn't work

We used this library for our project, Sometime the alginment doesn't work. We have different serie types in one chart. Could you please help us to solve this problem? The screenshot is attached here. Thanks.
problem

Recommend Projects

  • React photo React

    A declarative, efficient, and flexible JavaScript library for building user interfaces.

  • Vue.js photo Vue.js

    ๐Ÿ–– Vue.js is a progressive, incrementally-adoptable JavaScript framework for building UI on the web.

  • Typescript photo Typescript

    TypeScript is a superset of JavaScript that compiles to clean JavaScript output.

  • TensorFlow photo TensorFlow

    An Open Source Machine Learning Framework for Everyone

  • Django photo Django

    The Web framework for perfectionists with deadlines.

  • D3 photo D3

    Bring data to life with SVG, Canvas and HTML. ๐Ÿ“Š๐Ÿ“ˆ๐ŸŽ‰

Recommend Topics

  • javascript

    JavaScript (JS) is a lightweight interpreted programming language with first-class functions.

  • web

    Some thing interesting about web. New door for the world.

  • server

    A server is a program made to process requests and deliver data to clients.

  • Machine learning

    Machine learning is a way of modeling and interpreting data that allows a piece of software to respond intelligently.

  • Game

    Some thing interesting about game, make everyone happy.

Recommend Org

  • Facebook photo Facebook

    We are working to build community through open source technology. NB: members must have two-factor auth.

  • Microsoft photo Microsoft

    Open source projects and samples from Microsoft.

  • Google photo Google

    Google โค๏ธ Open Source for everyone.

  • D3 photo D3

    Data-Driven Documents codes.