cmbant / getdist Goto Github PK
View Code? Open in Web Editor NEWMCMC sample analysis, kernel densities, plotting, and GUI
License: Other
MCMC sample analysis, kernel densities, plotting, and GUI
License: Other


Not getting any error message when we pass a numpy array having strings of number to the MCSamples() class. The functions goes in an infinite loop and never terminates
I was recently looking for an alternative to making triangle/corner plots that smooth and plot quickly when chains are large and was led here. The examples and documentation clearly describe how to make all sorts of plots but something that I found lacking was examples and clear documentation for configuring the plots. For example, I really like the ability to create an object with plotting settings that can then be passed around. This will let me save a file of config info that I can just load whenever I want to make a nice looking plot. However, I have found that not all of the settings work. See the following example:
Begin with a single 1d plot
# Setup
rdata = np.random.normal(0., 1., 10000)
samples = MCSamples(samples=rdata, names=['x'], labels=['x'], ranges={'x':(-5,5)})

# Settings object
settings = plots.GetDistPlotSettings()

# Plot
single = plots.getSubplotPlotter(width_inch=4, settings=settings)
single.plot_1d(samples, param='x', filled=True, normalized=True)
Now I want to remove the p from the left side.
# Setup
rdata = np.random.normal(0., 1., 10000)
samples = MCSamples(samples=rdata, names=['x'], labels=['x'], ranges={'x':(-5,5)})

# Settings object
settings = plots.GetDistPlotSettings()
settings.norm_prob_label = False

# Plot
single = plots.getSubplotPlotter(width_inch=4, settings=settings)
single.plot_1d(samples, param='x', filled=True, normalized=True)
It works! Now I want to increase the fontsize of the axes ticks and labels the same way but it does not work.
# Setup
rdata = np.random.normal(0., 1., 10000)
samples = MCSamples(samples=rdata, names=['x'], labels=['x'], ranges={'x':(-5,5)})

# Settings object
settings = plots.GetDistPlotSettings()
settings.norm_prob_label = False
settings.axes_fontsize = 20
settings.lab_fontsize = 20

# Plot
single = plots.getSubplotPlotter(width_inch=4, settings=settings)
single.plot_1d(samples, param='x', filled=True, normalized=True)
But when I directly set the properties in the settings object that is a member of the plotter class it does.
# Setup
rdata = np.random.normal(0., 1., 10000)
samples = MCSamples(samples=rdata, names=['x'], labels=['x'], ranges={'x':(-5,5)})

# Settings object
settings = plots.GetDistPlotSettings()
settings.norm_prob_label = False
settings.axes_fontsize = 20
settings.lab_fontsize = 20

# Plot
single = plots.getSubplotPlotter(width_inch=4, settings=settings)
single.settings.axes_fontsize = 20
single.settings.lab_fontsize = 20
single.plot_1d(samples, param='x', filled=True, normalized=True)
Hi --
I was having issues with receiving a TypeError when calling plots.get_single_plotter() in GetDist 1.1.1 with Matplotlib 2.1.1. See screenshot.

The problem seems to be with the constrained_layout option in make_figure(). I fixed by changing the code after line 1708 as follows:
Old code:
     if self.settings.constrained_layout:
        self.fig = plt.figure(figsize=figsize, constrained_layout=True)
    else:
        self.fig = plt.figure(figsize=figsize)
    self.gridspec = matplotlib.gridspec.GridSpec(nrows=self.plot_row, ncols=self.plot_col, figure=self.fig)
New code:
    if self.settings.constrained_layout:
        self.fig = plt.figure(figsize=figsize, constrained_layout=True)
        self.gridspec = matplotlib.gridspec.GridSpec(nrows=self.plot_row, ncols=self.plot_col, figure=self.fig)
    else:
        self.fig = plt.figure(figsize=figsize)
        self.gridspec = matplotlib.gridspec.GridSpec(nrows=self.plot_row, ncols=self.plot_col)
Not sure if this is an optimal fix, but seems to work fine for me.
Hello.
I tried to loadMCSamples from Cobaya which contained variables named "chi2__H0" and "chi2__H0.riess201903".
I got an error numpy.ndarray has no attribute riess201903 when I called getParams. The code tried to set riess201903 attribute to chi2__H0 which was already an array and failed.
I wonder if it may be more convenient to use a dictionary to get parameters by names instead of this attribute business.
Hi,
I installed getdist, following the instructions and successfully testing:
$ pip install getdist
$ python -m unittest getdist.tests.getdist_test
But when I try to use getdist-gui I get an error message:
"""
LSOpenURLsWithRole() failed for the application /Users/talabadi/opt/anaconda3/lib/python3.8/site-packages/getdist/gui/GetDist GUI.app with error -10810.
Error running 'GetDist GUI.app'. This may be a Catalina issue, any ideas?
Attempting to run script directly, using non-unified menus.
objc[5165]: Class RunLoopModeTracker is implemented in both /Users/talabadi/opt/anaconda3/lib/python3.8/site-packages/PySide2/Qt/lib/QtCore.framework/Versions/5/QtCore (0x11e124268) and /Users/talabadi/opt/anaconda3/lib/libQt5Core.5.9.7.dylib (0x1241d1a80). One of the two will be used. Which one is undefined.
QObject::moveToThread: Current thread (0x7fa20f1a1af0) is not the object's thread (0x7fa20f1abcc0).
Cannot move to target thread (0x7fa20f1a1af0)
You might be loading two sets of Qt binaries into the same process. Check that all plugins are compiled against the right Qt binaries. Export DYLD_PRINT_LIBRARIES=1 and check that only one set of binaries are being loaded.
qt.qpa.plugin: Could not load the Qt platform plugin "cocoa" in "" even though it was found.
This application failed to start because no Qt platform plugin could be initialized. Reinstalling the application may fix this problem.
Available platform plugins are: cocoa, minimal, offscreen.
zsh: abort getdist-gui
"""
I tried uninstalling and reinstalling getdist and PySide2, but it did not fix the problem.
I use Anaconda3 as my python (version 3.8.5).
Please help. Thanks.
Hi, perhaps you can help with the error below, that arises whenever the length of the bins array is larger than fine_bins, in these lines of mcsamples.py.
The cause of the error is that 1d-density is computed as
density1D = Density1D(fine_x, P=conv, view_ranges=[par.range_min, par.range_max])but conv and fine_x have different sizes in this scenario
conv = convolve1D(bins, Kernel.Win, 'same', cache=cache)
fine_x = np.linspace(binmin, binmax, fine_bins)
Original error:
File "/Library/Python/2.7/site-packages/getdist/plots.py", line 1829, in triangle_plot
    label_right=True, no_zero=True, no_ylabel=True, no_ytick=True, line_args=line_args)
  File "/Library/Python/2.7/site-packages/getdist/plots.py", line 1299, in plot_1d
    bounds = self.add_1d(root, root_param, i, normalized=normalized, **line_args[i])
  File "/Library/Python/2.7/site-packages/getdist/plots.py", line 807, in add_1d
    density = self.sampleAnalyser.get_density(root, param, likes=self.settings.plot_meanlikes)
  File "/Library/Python/2.7/site-packages/getdist/plots.py", line 528, in get_density
    density = samples.get1DDensityGridData(name, meanlikes=likes)
  File "/Library/Python/2.7/site-packages/getdist/mcsamples.py", line 1297, in get1DDensityGridData
    density1D = Density1D(fine_x, P=conv, view_ranges=[par.range_min, par.range_max])
  File "/Library/Python/2.7/site-packages/getdist/densities.py", line 134, in __init__
    self.setP(P)
  File "/Library/Python/2.7/site-packages/getdist/densities.py", line 89, in setP
    raise DensitiesError("Array size mismatch in Density arrays: P %s, axis %s" % (size, ax.size))
getdist.densities.DensitiesError: Array size mismatch in Density arrays: P 1170, axis 200
Hi,
thank you for your package, it is working perfectly!
I was wondering if there is the possibility of plotting only the 68% line in the triangle plot. Default are 68% and 95% (I think). I haven't found this answer in the documentation.
Hi,
I was trying to use getdist with some chains created by pymultinest. It all works well, but I was trying to add names to the parameters without creating a .paramnames file (which does work btw). I thought I then could do:
samples = loadMCSamples('/data2/jarle/PIModels/Testing/MCMC/SDSSTest/CL01sdss-000002.txt')
nm = samples.getParamNames()
nm.setLabels(('LOGZ', 'CO', 'XSI', 'LOGU', 'TAUV'))
nm.setWithNames(('LOGZ', 'CO', 'XSI', 'LOGU', 'TAUV'))
samples.setParamNames(nm)
That works without making any noise, but when I run a corner plot I get an
AttributeError: 'ParamInfo' object has no attribute 'limmin' (see below for the full trace). I had a brief look at the code but I did not immediately see what was going on - clearly this was a bad idea, but is there are a better way to do this without making the .paramnames file?
  Thanks,
                Jarle
AttributeError Traceback (most recent call last)
in ()
----> 1 g.triangle_plot(samples_G16, filled=True)
/Users/jarle/anaconda/lib/python2.7/site-packages/getdist/plots.pyc in triangle_plot(self, roots, params, legend_labels, plot_3d_with_param, filled, shaded, contour_args, contour_colors, contour_ls, contour_lws, line_args, label_order, legend_ncol, legend_loc, upper_roots, upper_kwargs, **kwargs)
1949 self.plot_1d(roots1d, param, do_xlabel=i == plot_col - 1,
1950 no_label_no_numbers=self.settings.no_triangle_axis_labels,
-> 1951 label_right=True, no_zero=True, no_ylabel=True, no_ytick=True, line_args=line_args)
1952 # set no_ylabel=True for now, can't see how to not screw up spacing with right-sided y label
1953 if self.settings.no_triangle_axis_labels:
/Users/jarle/anaconda/lib/python2.7/site-packages/getdist/plots.pyc in plot_1d(self, roots, param, marker, marker_color, label_right, no_ylabel, no_ytick, no_zero, normalized, param_renames, **kwargs)
1394 if marker is not None: self.add_x_marker(marker, marker_color)
1395 if not 'lims' in kwargs:
-> 1396 xmin, xmax = self._check_param_ranges(plotroot, plotparam.name, xmin, xmax)
1397 if normalized:
1398 mx = plt.gca().yaxis.get_view_interval()[-1]
/Users/jarle/anaconda/lib/python2.7/site-packages/getdist/plots.pyc in _check_param_ranges(self, root, name, xmin, xmax)
801 """
802 d = self.paramBoundsForRoot(root)
--> 803 low = d.getLower(name)
804 if low is not None: xmin = max(xmin, low)
805 up = d.getUpper(name)
/Users/jarle/anaconda/lib/python2.7/site-packages/getdist/mcsamples.pyc in getLower(self, name)
2005 par = self.paramNames.parWithName(name)
2006 if par:
-> 2007 return par.limmin
2008 return None
2009
AttributeError: 'ParamInfo' object has no attribute 'limmin'
I can plot
g = plots.get_single_plotter() g.plot_2d([samples1, samples2], 'x0', 'x1',filled=True)
But, I have another pair of samples3, samples4 with the same variables x0, x1
I would like to plot them side by side.
How can I do it ?
I can do something like this
g = plots.get_subplot_plotter(subplot_size=2.5)

g.settings.scaling = False # prevent scaling down font sizes even though small subplots

g.plots_2d([samples1, samples2],[samples3, samples4], param_pairs=[['x0', 'x1'], ['x0', 'x1']], nx=2, filled=True);
However this puts the same plot (sample1, sample 2) in both the figures left and right.
Hi everyone. When running montepython with the --update or --superupdate options active we want to analyze only the part of the chain after the last covariance matrix or jumping factor updates. The montepython analyze module does that automatically, it says
The Markovian properties of the MCMC are maintained by the MontePython analyze module, which will only analyze steps after the last covariance matrix update.
Does getdist do that automatically as well when I analyze montepython chains with it? If not, are there options I can switch on to let getdist do this?
In glenco/lensed, we have parameter names of the form object.param, for example
lens.x                x_L
lens.y                y_L
lens.r                r_L
...
source.x              x_S
source.y              y_S
source.r              r_S
...
Since the number of parameters can get quite large, it would be great if GetDist supported a wildcard for parameter names to plot, so that we could set for example
plot_params = lens.*
triangle_params = lens.*
instead of manually listing the lens parameters.
Hi
I am trying to plot an MCMC chain using a weight array.
samples_z1_prior = MCSamples(samples=data['alpha_z1_phi_mcmc_array'], settings={'min_weight_ratio': 0.}, weights=np.array(data['weight_phi_mcmc']), names=names, label='$\alpha_{z1}-\beta$ + Planck')
if I set the weight to 1 it all works fine, but with a more general weight, I get the error below. I tried to understand how the chain attribute is generated and was wondering whether the min_weight_ratio parameter is to blame. I set it manually, but I it seems to ignore the settings I manually provided.
Here is an example how my weights look like
print("max = ", np.array(data['weight_phi_mcmc']).max())
print(data['weight_phi_mcmc'][0:10])
which gives
max = 6414.85520303
[65.864298022348777, 7.2310938431376631e-06, 1.0581215950983385e-10, 2.1621493843613816e-12, 0.18661013087037484, 9.5650192664169318e-06, 4.6463562589190878e-66, 2.7431270996436689e-27, 3.2501214203430937, 10.842194755581344]
and the error message I get is
Traceback (most recent call last):
File "process_MCMC.py", line 234, in
main()
File "process_MCMC.py", line 210, in main
samples_z1_prior = MCSamples(samples=data['alpha_z1_phi_mcmc_array'], settings={'min_weight_ratio': 0.}, weights=np.array(data['weight_phi_mcmc']), names=names, label='$\alpha_{z1}-\beta$ + Planck')
File "/Users/xflorian/anaconda/envs/nbodykit-env/lib/python3.6/site-packages/getdist/mcsamples.py", line 137, in init
Chains.init(self, root, jobItem=jobItem, **kwargs)
File "/Users/xflorian/anaconda/envs/nbodykit-env/lib/python3.6/site-packages/getdist/chains.py", line 817, in init
WeightedSamples.init(self, **kwargs)
File "/Users/xflorian/anaconda/envs/nbodykit-env/lib/python3.6/site-packages/getdist/chains.py", line 168, in init
self.setSamples(samples, weights, loglikes)
File "/Users/xflorian/anaconda/envs/nbodykit-env/lib/python3.6/site-packages/getdist/chains.py", line 223, in setSamples
self.setMinWeightRatio(min_weight_ratio)
File "/Users/xflorian/anaconda/envs/nbodykit-env/lib/python3.6/site-packages/getdist/chains.py", line 748, in setMinWeightRatio
self.filter(self.weights > max_weight * min_weight_ratio)
File "/Users/xflorian/anaconda/envs/nbodykit-env/lib/python3.6/site-packages/getdist/chains.py", line 855, in filter
if self.chains is None:
AttributeError: 'MCSamples' object has no attribute 'chains'
thanks
Florian
Hi,
I tried to use add_x_band to an axis in tirangle_plot but I couldn't pull it off.
could I get some help please?
Thanks.
This is not really an issue, just a query.
I am using getdist extensively in my project and like to provide due credit. Except the github/webpage link, is there any boilerplate credit line that I can provide in my paper?
Hi,
I've been wondering whether is is possible to use getdist plotting module to create a triangle plot of a covariance matrix (without MCMC chains or any other statistical data)?
Thanks.
I have been having difficulty in adjusting the width of lines in 2D contours in triangle plots. Let me give an example
Here is the code.
g.triangle_plot(roots, params, plot_3d_with_param=param_3d, filled=False, shaded=False, line_args=[ {'lw': 1.4, 'ls': 'solid', 'color':'red'}, {'lw': 0.8, 'ls': 'dashed', 'color':'black'} ], legend_loc=(0.5,0.8), contour_colors=['red','black'], contour_ls=['solid','dashed'], contour_lws=[1.4,0.8], legend_labels=[ 'DES Planck $\\theta_\\star$, NS', 'DES Flat Prior' ] )
Any clues?
I'm currently getting a segfault on my system when running GetDistGUI.py. It seems to be an issue with the latest versions of Qt, and it is fixed on my system by reordering the imports in getdist.gui.mainwindow.py so that the getdist.gui.SyntaxHighlight import line is after the initial getdist imports.
I can submit a PR with this 'fix', providing that it doesn't disrupt anybody else's system
Hi,
A. Ferté (@aferte) brought to my attention a problem with the 0.3.0 version of getdist : essentially, if one tries to create an MCSamples instance by providing an (numpy) array for the samples and some weights, a ValueError is raised as soon as one of the weights is significantly smaller that the rest ("ValueError: chains are separated, makeSingle first or call filter on individual chains").
A minimal example to illustrate the issue :
import numpy as np
from getdist.mcsamples import MCSamples

samps = np.random.rand(10000, 3)
weights = np.ones(10000)
weights[0] = 0 # one tiny weight

MC = MCSamples(samples=samps,weights=weights) # raises an error
It seems that the presence of at least one "very small" weight triggers the use of the "filter" function in order to get rid of the samples with (relatively) negligible weights. However, the "filter" function as defined in the "Chains" class starts by checking if "self.chains" is set to "None" -- which it is not at that point in the execution, but rather set to an empty list "[ ]", hence the error raised. I assume this is not an intended behaviour ?
Thanks in advance !
First, thanks for this great package!
Recently, I have to plot figures similar to the following:

Note the marginalized 1D density on the right is horizontal-oriented, is it possible to achieve this with getdist?
I have read the docs but can't find the proper parameters to set.
I was wondering if it's possible to plot multiple 3D scatter plots on the same triangle plot?
For example, like this:

but with 2 color maps and 2 scatter plots (instead of 1 scatter plot and 1 contour plot as shown in the image)
Greetings, while running GetDist I have received the attached error. I am not sure why the program is reading in the directory twice (the path should've ended at the first ULTRAVISTA114558), but I believe this is why the program cannot find the root. How do I correct this issue? I've uploaded the traceback from the issue in the first screenshot, with the path highlighted, as well as the code I am trying to run.I am not entirely certain what is going on so any help would be terrific, thanks again!
-Mason


This is not a pb in getdist per se, rather in Multinest which produces chains output as -2 ln(like) instead of -ln(like).
Reading them with getdist works fine for anything related to marginalized distributions but produces erroneous values for max like and friends.
An easy way to deal with that is, after loading the chains, is dividing the loglike array by 2, and updating statistics with updateBaseStatistics:
if mc.sampler == 'nested':
    mc.loglikes = mc.loglikes/2.0
    mc.updateBaseStatistics()
The max likes are now correct, but this still produces erroneous output for the mean likes which end up not being updated.
An extra call to
mc.setMeans()
is needed. Would it make sense to automatically do so within "updateBaseStatistics()"?
NB: Notice that "cooling" the chains would not work, as we don't want to change weights.
For some reason some of the plots in the triangle plot are not centered. Is there an option to rectify this?
I saw there is param_limits option (couldn't manage to understand how to use it correctly), anyway I need to center only some of the parameters (the others already appear in the center).
Thanks.
Hello all,
I've had a few strange troubles with the triangle_plot routine, on completely different machines (my own laptop and a computing cluster) and with completely different chains : (apparently) at random, it fails horribly to produce one or several of the 2D contours in the triangle plot.
See e.g. here (6th row, 5th column) :
plot.pdf
Here (6th row, 3rd column) :
LDMD.pdf
Or this one, which pretty much uses the same chains but fails for a different plot (5th row, 3rd column)
LDMD (copy).pdf
Any idea what could be the cause of it ?
Thanks in advance !
Cheers,
Stéphane
This is really just a typo in https://getdist.readthedocs.io/en/latest/plot_gallery.html.
# Triangle plot
g = plots.get_subplot_plotter()
g.triangle_plot([samples, samples2], filled=True)
should be
# Triangle plot
g = plots.getSubplotPlotter()
g.triangle_plot([samples, samples2], filled=True)
When I do
$ getdist mychains --ignore_rows 0.1
I get the error message:
  File "/Users/boris/opt/anaconda3/lib/python3.7/site-packages/getdist/chains.py", line 1003, in removeBurn
    if remove >= 1:
TypeError: '>=' not supported between instances of 'str' and 'int'
I am not sure if it is due to my own python/config, but I could fix this with calling float(remove) first:
    def removeBurn(self, remove=0.3):
        """
        removes burn in from the start of the samples

        :param remove: fraction of samples to remove, or if int >1, the number of sample rows to remove
        """
        r = float(remove)
        if r >= 1:
            ix = int(remove)
        else:
            ix = int(round(self.numrows * r))
        if self.weights is not None:
            self.weights = self.weights[ix:]
        if self.loglikes is not None:
            self.loglikes = self.loglikes[ix:]
        self.changeSamples(self.samples[ix:, :])
Hi Antony,
just have an issue to read chains not starting at _1. I guess the fix is to change line 57 in chains.py:
if index > 0 and not os.path.exists(fname) or 0 < last_chain < index: break
by
if index > first_chain and not os.path.exists(fname) or 0 < last_chain < index: break
cheers,
chris
I recently updated my matplotlib version to 1.5.3 and a few old notebooks that had 2dplots that were working now return the error:
/Users/bhorowitz/virtual/_notebook/lib/python2.7/site-packages/getdist/plots.pyc in add_2d_contours(self, root, param1, param2, plotno, of, cols, contour_levels, add_legend_proxy, param_pair, density, alpha, ax, **kwargs)
    906             kwargs['alpha'] = alpha
    907             CS = ax.contour(density.x, density.y, density.P, contour_levels, colors=cols, linestyles=linestyles,
--> 908                             linewidths=self.settings.lw_contour, **kwargs)
    909             dashes = args.get('dashes')
    910             if dashes:

/Users/bhorowitz/virtual/_notebook/lib/python2.7/site-packages/matplotlib/__init__.pyc in inner(ax, *args, **kwargs)
   1817                     warnings.warn(msg % (label_namer, func.__name__),
   1818                                   RuntimeWarning, stacklevel=2)
-> 1819             return func(ax, *args, **kwargs)
   1820         pre_doc = inner.__doc__
   1821         if pre_doc is None:

/Users/bhorowitz/virtual/_notebook/lib/python2.7/site-packages/matplotlib/axes/_axes.pyc in contour(self, *args, **kwargs)
   5617             self.cla()
   5618         kwargs['filled'] = False
-> 5619         return mcontour.QuadContourSet(self, *args, **kwargs)
   5620     contour.__doc__ = mcontour.QuadContourSet.contour_doc
   5621

/Users/bhorowitz/virtual/_notebook/lib/python2.7/site-packages/matplotlib/contour.pyc in __init__(self, ax, *args, **kwargs)
   1422         are described in QuadContourSet.contour_doc.
   1423         """
-> 1424         ContourSet.__init__(self, ax, *args, **kwargs)
   1425
   1426     def _process_args(self, *args, **kwargs):

/Users/bhorowitz/virtual/_notebook/lib/python2.7/site-packages/matplotlib/contour.pyc in __init__(self, ax, *args, **kwargs)
    861         self._transform = kwargs.get('transform', None)
    862
--> 863         self._process_args(*args, **kwargs)
    864         self._process_levels()
    865

/Users/bhorowitz/virtual/_notebook/lib/python2.7/site-packages/matplotlib/contour.pyc in _process_args(self, *args, **kwargs)
   1443                 self._corner_mask = mpl.rcParams['contour.corner_mask']
   1444
-> 1445             x, y, z = self._contour_args(args, kwargs)
   1446
   1447             _mask = ma.getmask(z)

/Users/bhorowitz/virtual/_notebook/lib/python2.7/site-packages/matplotlib/contour.pyc in _contour_args(self, args, kwargs)
   1538             warnings.warn('Log scale: values of z <= 0 have been masked')
   1539             self.zmin = float(z.min())
-> 1540         self._contour_level_args(z, args)
   1541         return (x, y, z)
   1542

/Users/bhorowitz/virtual/_notebook/lib/python2.7/site-packages/matplotlib/contour.pyc in _contour_level_args(self, z, args)
   1187                 warnings.warn("Contour levels are not increasing")
   1188             else:
-> 1189                 raise ValueError("Contour levels must be increasing")
   1190
   1191     def _process_levels(self):

ValueError: Contour levels must be increasing
After looking in the documentation there seems to be support for having 68% limits in the results, but I'm unsure how to use it so that I can print a table with the 1 sigma region, instead of two sigmas.
Is this supported out of the box?
Hello,
I have a question regarding the title_limit option, and a follow up question regarding legends if there isn't a solution for the first.
In short, I'm trying to display the tex for the blue contours, which are the smallest in size, so I can't simply change it to be plotted first. Perhaps there's a zorder kwarg that could also solve this?

Then I tried to more manually add the legend using g.add_legend, and specify a location using bbox_to_anchor. But it seems the g.plot_1d function still plots a legend, resulting in two different legends (see figure below)

Is there an option to not show a legend from plot_1d, and only the "manually added" one from add_legend?
I apologize if these are trivial questions, and thank you in advance for your time.
RHEL 7.7, x86-64
getdist 1.1.0
The software was installed using conda:
conda create --name gd-env -c conda-forge python=3.7 scipy pandas matplotlib PySide2 pyyaml
conda activate gd-env
pip install getdist
When trying to make any kind of plot it gives an error:
$ getdist-gui -v
2020-04-27 14:22:45 [DEBUG] [mainwindow.py:1302] Param: chains
2020-04-27 14:23:08 [DEBUG] [mainwindow.py:1530] Plotting with roots = ['gaussian']
2020-04-27 14:23:08 [DEBUG] [mainwindow.py:1566] Triangle plot with params = ['a', 'b']
2020-04-27 14:23:08 [DEBUG] [mcsamples.py:1461] a 1D sigma_range, std: 0.30348697421831744, 0.30348697421831744; smooth_1D_bins: 82.17558659769597
2020-04-27 14:23:08 [DEBUG] [mcsamples.py:1461] b 1D sigma_range, std: 0.415841284432462, 0.415841284432462; smooth_1D_bins: 66.94876087351646
2020-04-27 14:23:08 [DEBUG] [mcsamples.py:1654] Doing 2D: a - b
2020-04-27 14:23:08 [DEBUG] [mcsamples.py:1655] sample x_err, y_err, correlation: 0.30348697421831744, 0.415841284432462, 0.2911456738999044
2020-04-27 14:23:08 [DEBUG] [mcsamples.py:1223] a b AutoBandwidth2D: N_eff=763.170575926697, corr=0.2911456738999044
2020-04-27 14:23:08 [DEBUG] [mcsamples.py:1295] hx/sig, hy/sig, corr =0.36535980185458083, 0.40201186926264276, 0.2646014554793949
2020-04-27 14:23:08 [DEBUG] [mcsamples.py:1300] hx/sig, hy/sig, corr, scale =0.6255877309633849, 0.6883452745369735, 0.2646014554793949, 1.7122511228325525
2020-04-27 14:23:08 [DEBUG] [mcsamples.py:1704] corr, rx, ry: 0.2646014554793949, 23.546287680813432, 20.60078959883917
2020-04-27 14:23:08 [DEBUG] [mcsamples.py:1716] time 2D binning and bandwidth: 0.1943345069885254 ; bins: 256
2020-04-27 14:23:08 [DEBUG] [mcsamples.py:1799] time 2D convolutions: 0.19409441947937012
2020-04-27 14:23:08 [DEBUG] [font_manager.py:1246] findfont: Matching sans-serif:style=normal:variant=normal:weight=normal:stretch=normal:size=8.775.
... lots more lines about fonts ...
2020-04-27 14:23:09 [DEBUG] [font_manager.py:1281] findfont: Matching sans-serif:style=normal:variant=normal:weight=normal:stretch=normal:size=11.775 to DejaVu Sans ('/home/jdh4/.conda/envs/gd-env/lib/python3.7/site-packages/matplotlib/mpl-data/fonts/ttf/DejaVuSans.ttf') with score of 0.050000.
Traceback (most recent call last):
File "/home/jdh4/.conda/envs/gd-env/lib/python3.7/site-packages/getdist/gui/mainwindow.py", line 1686, in plotData
self.errorReport(e, caption=actionText)
File "/home/jdh4/.conda/envs/gd-env/lib/python3.7/site-packages/getdist/gui/mainwindow.py", line 1575, in plotData
self.updatePlot()
File "/home/jdh4/.conda/envs/gd-env/lib/python3.7/site-packages/getdist/gui/mainwindow.py", line 1706, in updatePlot
self.toolbar = NavigationToolbar(self.canvas, self)
File "/home/jdh4/.conda/envs/gd-env/lib/python3.7/site-packages/matplotlib/backends/backend_qt5.py", line 679, in init
QtWidgets.QToolBar.init(self, parent)
TypeError: arguments did not match any overloaded call:
QToolBar(str, parent: QWidget = None): argument 1 has unexpected type 'MainWindow'
QToolBar(parent: QWidget = None): argument 1 has unexpected type 'MainWindow'
Lets say I have a MCMC output chain for varied parameter X1,...,XN. Is there currently a way to look at the distributions and statistics for the other parameters given fixed value of parameter Xi? I.e. if I run cosmomc for all cosmic parameters but I want to look at the case where I fix H0 at a certain values. It seems like there should be enough information in the overall chain to do this without having to run MCMC again given a fixed H0?
Dear prof. Lewis,
I am having an issue with exporting likelihood data to a file, with get1DDensityGridData(parname,writeDataToFile=True) . I would like to export it in order to compare with other analyses and plot outside getdist. Before getdist version 1.1, I didn't have this issue. I have tried to downgrade to getdist 1.0, but pip has downgraded other packages too and it gave me another problems.
Any idea of how to do that in getdist 1.1.2?
Best regards.
Hi,
I am beginner and want to use my specified ranges for plotting but MCSamples does not use ranges.
My sample code is:
from getdist import plots, MCSamples
paramsdict_label = np.array([])
labels = ["a0","a1","a2","a3","a4","a5","a6","a7","a8","a9", "b"]
names = ['$a_0$', '$a_1$', '$a_2$','$a_3$','$a_4$','$a_5$','$a_6$','$a_7$','$a_8$','$a_9$','$\epsilon_3^r$']
rangep={'a0':[0.1, 1],'a1':[0.1, 1],'a2':[0.1, 1],'a3':[0.1, 1],'a4':[0.1, 1],'a5':[0.1, 1],'a6':[0.1, 1],'a7':[0.1, 1],'a8':[0.1, 1],'a9':[0.1, 1],'b':[-1,8]}
samples = MCSamples(samples=samples, names=names, ranges=rangep)
g = plots.get_subplot_plotter()
samples.updateSettings({'contours': [0.68, 0.95, 0.99]})
g.settings.num_plot_contours = 3
g.triangle_plot([samples] ,contour_colors=['darkturquoise'], filled=True)
g.export('output_file.pdf')
Hello there,
I am usually using getCorrelatedVariable2DPlots() to obtain a list of the most correlated parameters to be plotted. Sometimes, parameters are fully correlated (especially derived ones), and I am accordingly warned:
WARNING:root:Parameters are 100% correlated: eps2, eps3
a 2D plot on these parameters would be a line, but crashes instead due to the inversion of a singular matrix.
Traceback (most recent call last):

  File "...getdist/mcsamples.py", line 1720, in get2DDensityGridData
    Cinv = np.linalg.inv(np.array([[ry ** 2, rx * ry * corr], [rx * ry * corr, rx ** 2]]))
  File "<__array_function__ internals>", line 5, in inv
  File "/usr/lib64/python3.8/site-packages/numpy/linalg/linalg.py", line 546, in inv
    ainv = _umath_linalg.inv(a, signature=signature, extobj=extobj)
  File "/usr/lib64/python3.8/site-packages/numpy/linalg/linalg.py", line 88, in _raise_linalgerror_singular
    raise LinAlgError("Singular matrix")
numpy.linalg.LinAlgError: Singular matrix
I have tried to replace all calls to inv() by the Moore-Penrose inverse, pinv(), and this actually works fine. In spite of the warning, the 2D plot does not crash and it displays the expected 100% correlated line. Would it make sense to default to pinv?
https://numpy.org/doc/stable/reference/generated/numpy.linalg.pinv.html?highlight=pinv
Is there a way to compute FoM automatically in GetDist?
GetDist fails if chain directory contains a file with only one line. Bad place is in the file getdist/chains.py in the class "WeightedSamples" in constructor at line 178:
cols = loadNumpyTxt(filename, skiprows=ignore_rows)
In this line NumPy returns a 2-dimensional array if the file contains 2 or more lines or NumPy returns a 1-dimensional array if the file contains only 1 line. It causes crash in other GetDist parts.
Traceback (most recent call last):
File "Plotter_start.py", line 10, in <module>
chaindata = loadMCSamples(chainsname,dist_settings={'ignore_rows': 0.0,'smooth_scale_2D':-1})
File "/usr/local/lib/python2.7/dist-packages/GetDist-0.3.3-py2.7.egg/getdist/mcsamples.py", line 93, in loadMCSamples
samples.readChains(files)
File "/usr/local/lib/python2.7/dist-packages/GetDist-0.3.3-py2.7.egg/getdist/mcsamples.py", line 477, in readChains
self.loadChains(self.root, files_or_samples, weights=weights, loglikes=loglikes)
File "/usr/local/lib/python2.7/dist-packages/GetDist-0.3.3-py2.7.egg/getdist/chains.py", line 1060, in loadChains
self.chains.append(WeightedSamples(fname, **WSkwargs))
File "/usr/local/lib/python2.7/dist-packages/GetDist-0.3.3-py2.7.egg/getdist/chains.py", line 181, in __init__
self.setColData(cols, are_chains=files_are_chains)
File "/usr/local/lib/python2.7/dist-packages/GetDist-0.3.3-py2.7.egg/getdist/chains.py", line 201, in setColData
self.setSamples(coldata[:, 2:], coldata[:, 0], coldata[:, 1])
IndexError: too many indices for array
This situation can occur if user started MontePython script but interrupted it very fast.
@cmbant Dear Antony, I find getdist is a very useful for analyzing MCMC chains. Since getdist is written in Python, I'm wondering whether it supports MCMC programmer of Python such as emcee (https://emcee.readthedocs.io/en/stable/) ? emcee is so popular that if getdist is compatible with it, it would be great.
Hi,
I've noticed that loadMCSamples does not load all chains if the numbering is continuous. For instance, if you've got the following chains,
loadMCSamples only loads 2019-11-29_350000__1.txt. I found myself in this situation as one of my chains didn't converge and I renamed it to 2019-11-29_350000__2.txt-noconverged, because I thought loadMCSamples would just would just skip that one.I've modified chainFiles in chains.py to allow for missing chains. It uses regular expressions. It can be seen in carlosggarcia@7f4edc3. I have made some tests and it seems to work fine.
Carlos
Burn in has no meaning for nested sampling. Ideally it should be disabled or throw an exception if users try to use it in the case of analysing nested sampling chains. This was the root cause of this issue:
PolyChord/PolyChordLite#6 (comment)
@JesusTorrado has suggested that something like this may be possible.
When I run getdist-gui it works with a single monitor setup, but fails with dual monitor setup.
Did anybody else encounter this before?
Any ideas how I could fix this (without the need of disconnecting the secondary screen)?
(It might be that this has to do with my i3 tiling window manager setup, though...)
GetDist                  1.3.3
PySide2                  5.15.2.1
shiboken2                5.15.2.1
(py310env) [~]$ getdist-gui
Traceback (most recent call last):
  File "/home/lukas/.virtualenv/py310env/bin/getdist-gui", line 8, in <module>
    sys.exit(getdist_gui())
  File "/home/lukas/.virtualenv/py310env/lib/python3.10/site-packages/getdist/command_line.py", line 355, in getdist_gui
    run_gui()
  File "/home/lukas/.virtualenv/py310env/lib/python3.10/site-packages/getdist/gui/mainwindow.py", line 2333, in run_gui
    mainWin = MainWindow(app, ini=args.ini, plot_scale=args.plot_scale)
  File "/home/lukas/.virtualenv/py310env/lib/python3.10/site-packages/getdist/gui/mainwindow.py", line 139, in __init__
    self._createWidgets()
  File "/home/lukas/.virtualenv/py310env/lib/python3.10/site-packages/getdist/gui/mainwindow.py", line 604, in _createWidgets
    self.readSettings()
  File "/home/lukas/.virtualenv/py310env/lib/python3.10/site-packages/getdist/gui/mainwindow.py", line 618, in readSettings
    screen = self.getScreen()
  File "/home/lukas/.virtualenv/py310env/lib/python3.10/site-packages/getdist/gui/mainwindow.py", line 614, in getScreen
    return QApplication.screenAt(self.mapToGlobal(QPoint(self.width() / 2, 0))).availableGeometry()
AttributeError: 'NoneType' object has no attribute 'availableGeometry'
screenAt(point) is supposed to return the screen at point, or None if outside of any screen, so here it clearly is pointing outside a screen.
Disconnect the secondary screen, then launch getdist-gui. You can reconnect the secondary screen afterwards.
Hi,
is it possible that the values for marginalized limits are different when obtained with samps.getMargeStats() versus the onesquoted on a triangle plot when setting 'title_limit' to the desired value (in this case I'm looking at 68%, so title_limit=1). This is what's happening to me when looking at some chains generated by cobaya.
I can see that title_limit calls a function getInlineLatex(), which then uses texValues(), and I believe this function is giving me different limits than the ones from margestats.
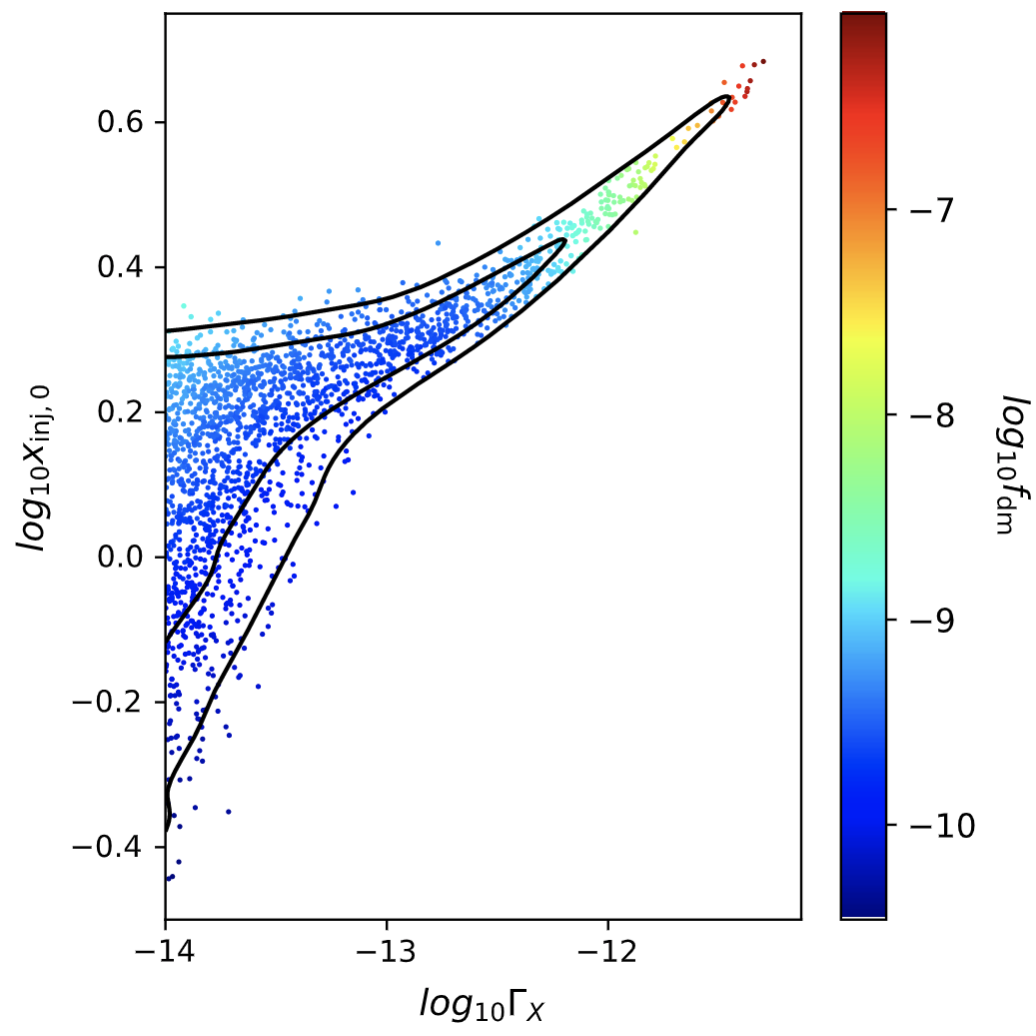
Hi,
I have been trying to set custom axis label and ticks in contour plots.
I was wondering whether this is possible in GetDist in a relatively easy way?
Concretely, on the plot attached I would like to re-arrange the tick labels with 10^XX values, rather than the log10(XX) values, and change the axis labels accordingly, including the colorbar label and ticks.
Thanks a lot!
Boris
The corresponding script is:
g = plots.getSubplotPlotter()
g.settings.fig_width_inch = 5
g.settings.axes_fontsize = 10
g.settings.lab_fontsize =12
g.settings.legend_fontsize = 15
g.settings.alpha_filled_add=0.4
g.settings.colorbar_label_pad = 5.
g.settings.figure_legend_frame = False

sample_list = []
for s in range(len(all_samples)):
    sample_list.append(all_samples[i])
    sample_list.append(all_samples[i])

g.plot_3d(sample_list,
                ['log10xinj','log10G_X','log10f_dm'],
                filled = [True,False],
                colors = ['black','black'],
                alphas = [0.3,0.7],
               )

g.export(path_to_figures+chains+'_3d.pdf')
Hi all,
I've had a long-standing issue with getdist, and the release of v1.0 seems like a good time to point it out : say I have two MCSamples instances, one with parameters "x0" and "x1", and the other with parameters "x1" and "x2". Trying to produce a triangle plot that contains "x0", "x1" and "x2" yields an error mentioning a missing parameter in one of the two MCSamples. Essentially, you're forced to plot only common parameters between the two chains.
See example below :
import numpy as np
from getdist import plots, MCSamples
nsamp = 10000
samps = np.random.multivariate_normal([0, 0], np.eye(2), size=nsamp)
samps2 = np.random.multivariate_normal([0, 0], np.eye(2), size=nsamp)
names = ["x0", "x1"]
samples = MCSamples(samples=samps,names = names)
names = ["x1", "x2"]
samples2 = MCSamples(samples=samps2,names = names)
g = plots.get_subplot_plotter()
g.triangle_plot([samples, samples2], ["x0","x1","x2"] filled=True)
which yields : "Exception: parameter name not found: x2"
Does this all sounds like a feature that should be implemented ?
In the past, I managed to do a quite "dirty" modification of getdist in order to be able to do such plot, but I suspect that developers more experienced than me could do a much better job.
Hi all,
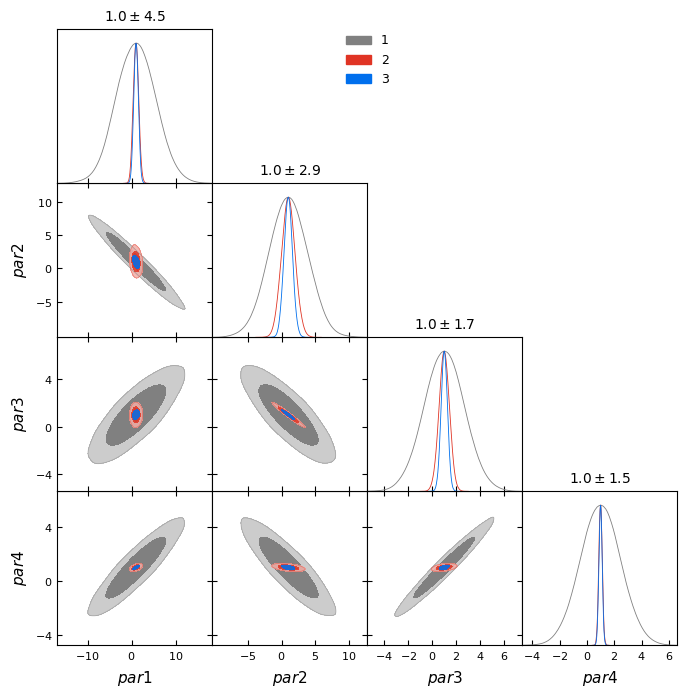
I have an issue with the "triangle_plot" where as can be seen from the attached figure for some parameters (e.g. \gamma) the 1d plot (green) do not seem to display the marginalised distribution that I would expect from looking at the corresponding 2d plot. Is this a smoothing issue?

Hi Prof Lewis,
Is it possible to thread big triangle plots - plots with more than 10x10 dims? I am trying triangle plots with 30 dims and GetDist is really slow, even with thin chains. I would never include such a plot in a paper, but these large triangle plots are great for visual inspection of the chain.
Best and stay safe
Vivian Miranda
This line forces matplotlib to use the given version of the backend.
matplotlib.use('Agg', warn=False)
Because of this the command plt.show() does not work anymore. Is there any way around it? I want to be able to see the plot before I save it to a figure.
Hi Antony,
Getdist produces nice contour plots. I need to plot/add some curves in a 2D contour plot of two parameters. But I could not find any such option in the documentation of getdistplotter. I am able to plot my curves using the matplotlib.pyplot module. But I do not find a way to add these curves to the 2D contour plot given by getdistplotter. Please help.
Hi,
Is there any possibility to display the posterior values in the triangular plot?
I mean having a scale reference with ticks in the posterior part of the plot (or at list in the 1-D only plot)
All the best,
Simone
I tries to fix limits in triangle plot by param_limits={'paramname':(minval,maxval)}. It works on the X axis exactly but no effect for the Y axis.
I hot fixed it in my plot script by call
for ay in range(params.index('paramname')): TrianglePlotObject.subplots[params.index('paramname'),ay].set_ylim((minval, maxval))
after triangle_plot(...) but it is bad solution, I think.
I found another solution: replacing line 2447 in getdist/plots.py from if i == 0: to if i != i2:
P.S.:
Calling TrianglePlotObject.subplots[params.index('paramname'),0].set_ylim((minval, maxval)) works too. I have no idea why if i == 0:ax.set_ylim(lims[i2]) doesn't work in GetDist
A declarative, efficient, and flexible JavaScript library for building user interfaces.
🖖 Vue.js is a progressive, incrementally-adoptable JavaScript framework for building UI on the web.
TypeScript is a superset of JavaScript that compiles to clean JavaScript output.
An Open Source Machine Learning Framework for Everyone
The Web framework for perfectionists with deadlines.
A PHP framework for web artisans
Bring data to life with SVG, Canvas and HTML. 📊📈🎉
JavaScript (JS) is a lightweight interpreted programming language with first-class functions.
Some thing interesting about web. New door for the world.
A server is a program made to process requests and deliver data to clients.
Machine learning is a way of modeling and interpreting data that allows a piece of software to respond intelligently.
Some thing interesting about visualization, use data art
Some thing interesting about game, make everyone happy.
We are working to build community through open source technology. NB: members must have two-factor auth.
Open source projects and samples from Microsoft.
Google ❤️ Open Source for everyone.
Alibaba Open Source for everyone
Data-Driven Documents codes.
China tencent open source team.