GithubHelp home page GithubHelp logo

crazz-zaac / a-visual-history-of-nobel-prize-winners Goto Github PK

View Code? Open in Web Editor NEW
0.0 2.0 0.0 908 KB

Visualizing the history of Nobel Prize winners.

Jupyter Notebook 100.00%
data-science data data-visualization data-analysis datascience datacamp datacamp-projects datacamp-exercises datacamp-course

a-visual-history-of-nobel-prize-winners's Introduction

A Visual History of Nobel Prize Winners

In this part of my practising journey, I visualized the Nobel Prize Winners dataset containing the data from 1901 to 2016. Using data science tools, I successfully visualized the most dominating country for wining the Nobel prizes. The following information was inferred from the dataset:

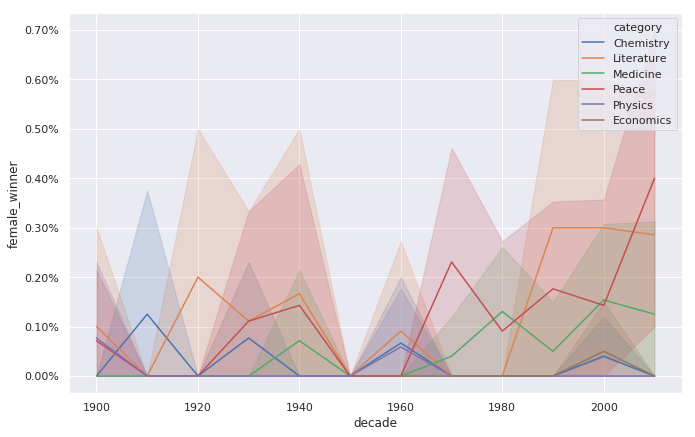
  1. Out of 911 Nobel prize winners, 836 are males and only 49 are females
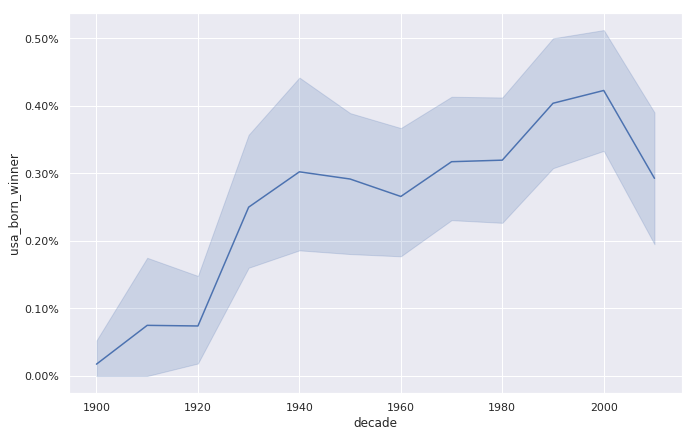
  2. United States of America is the most dominating country with a total of 259 Nobel prizes followed by United Kingdom (85 Nobel prizes) and Germany (61 Nobel prizes). More than 40% of the winners are born in USA and has kept the leading position ever since. alt text
  3. Visualizing the Gender of a typical Nobel Prize winner alt text
  4. Using lmplot to visualize the age of all the Nobel Prize winners alt text
  5. Visualizing the age difference between categories alt text
  6. The oldest Nobel Prize winner is Leonid Hurwicz (90 years old) and the youngest Nobel Prize winner is Malala Yousafzai (17 years old)

Tasks included

  • Data exploration
  • Data cleaning
  • Data visualization

Datasets

You can find all the datasets used in this project inside the datasets directory. The datasets include

  • nobel.csv

Installation

You can clone the repository and practise for yourself.

Credits

This is a part of Datacamp's - Data Science with Python course.

Thank you for your support ❤️

a-visual-history-of-nobel-prize-winners's People

Contributors

crazz-zaac avatar

Watchers

 avatar  avatar

Recommend Projects

  • React photo React

    A declarative, efficient, and flexible JavaScript library for building user interfaces.

  • Vue.js photo Vue.js

    🖖 Vue.js is a progressive, incrementally-adoptable JavaScript framework for building UI on the web.

  • Typescript photo Typescript

    TypeScript is a superset of JavaScript that compiles to clean JavaScript output.

  • TensorFlow photo TensorFlow

    An Open Source Machine Learning Framework for Everyone

  • Django photo Django

    The Web framework for perfectionists with deadlines.

  • D3 photo D3

    Bring data to life with SVG, Canvas and HTML. 📊📈🎉

Recommend Topics

  • javascript

    JavaScript (JS) is a lightweight interpreted programming language with first-class functions.

  • web

    Some thing interesting about web. New door for the world.

  • server

    A server is a program made to process requests and deliver data to clients.

  • Machine learning

    Machine learning is a way of modeling and interpreting data that allows a piece of software to respond intelligently.

  • Game

    Some thing interesting about game, make everyone happy.

Recommend Org

  • Facebook photo Facebook

    We are working to build community through open source technology. NB: members must have two-factor auth.

  • Microsoft photo Microsoft

    Open source projects and samples from Microsoft.

  • Google photo Google

    Google ❤️ Open Source for everyone.

  • D3 photo D3

    Data-Driven Documents codes.