![]()
This card is basically deprecated and do not expect maintainence.
I recommend use vscode devcontainers. do
npm install
npm run build
Inside container you can build, start HA using vscode tasks.
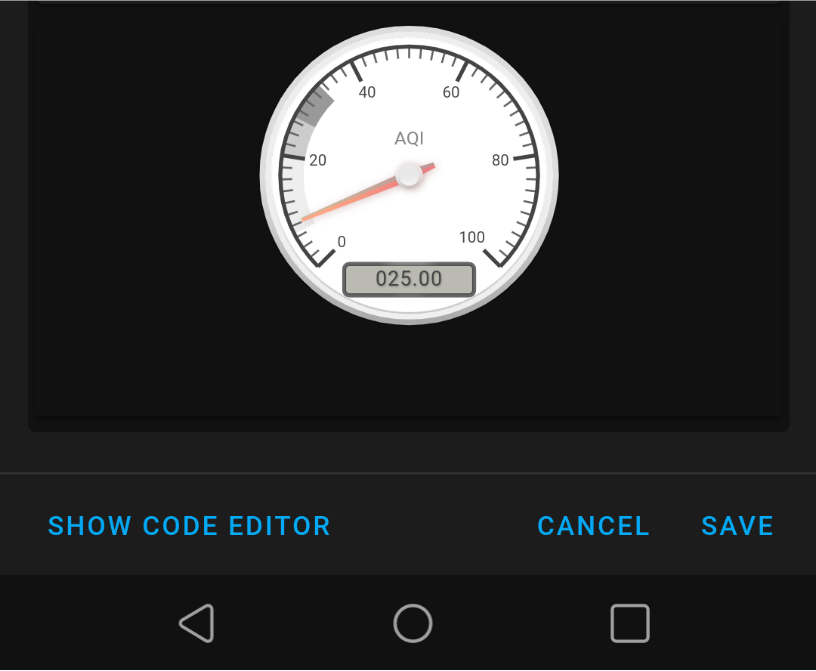
This card allows you to use the awesome gauges at https://canvas-gauges.com/ in your lovelace GUI. This is still a very early and untested alpha version. Tested only on chrome and safari browsers.
If you want to support the developer, please support the lib devs of the canvas-gauges.
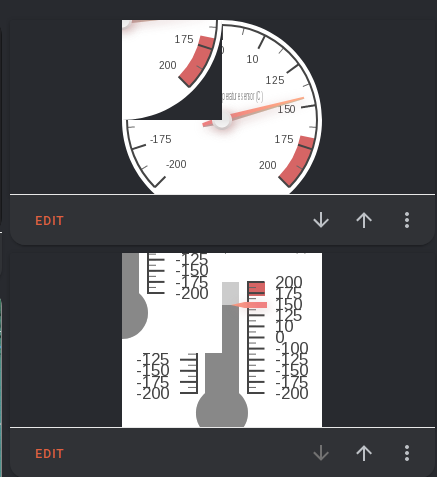
Here is a some different screens from my own setup. But the possibilites to make your own look and feel are great.


Download through HACS (recommended) or ...
Download the file canvas-gauge-card.js from the latest release to your home assistant config. Add a module link to the canvas-gauge-card.js file. The link needs to be the same as where you put it.
Example:
resources:
  - url: /local/custom_cards/canvas-gauge-card.js
    type: module
Configure the card properties.
Skip nameproperty if you dont want the name with the shadow area to show.
Use the javascript names of properties from the examples at https://canvas-gauges.com/documentation/examples/. Click on an example that you like, check the JS version and copy the properties to the lovelace yaml file. Just remove the ',' after copy from site.

ui-lovelace.yaml:
Notice the differences in card_height and gauge/height to get correct half size for full circle, set both to same.
- type: custom:canvas-gauge-card
  entity: sensor.processor_use
  card_height: 125
  gauge:
    type: "radial-gauge"
    title: Processor (%)
    width: 220
    height: 220
    borderShadowWidth: 0
    borderOuterWidth: 0
    borderMiddleWidth: 0
    borderInnerWidth: 0
    minValue: 0
    maxValue: 100
    startAngle: 30
    ticksAngle: 180
    valueBox: false
    majorTicks:
      ["0", "10", "20", "30", "40", "50", "60", "70", "80", "90", "100"]
    minorTicks: 2
    strokeTicks: true
    highlights: [{ "from": 80, "to": 100, "color": "rgba(200, 50, 50, .75)" }]
    borders: false
ui-lovelace.yaml:
- type: custom:canvas-gauge-card
  entity: sensor.processor_use
  name: Processor (%)
  card_height: 145
  shadow_height: 15%
  font_size: 1em
  gauge:
    type: "radial-gauge"
    width: 220
    height: 220
    borderShadowWidth: 0
    borderOuterWidth: 0
    borderMiddleWidth: 0
    borderInnerWidth: 0
    minValue: 0
    maxValue: 100
    startAngle: 90
    ticksAngle: 180
    valueBox: false
    majorTicks:
      ["0", "10", "20", "30", "40", "50", "60", "70", "80", "90", "100"]
    minorTicks: 2
    strokeTicks: true
    highlights: [{ "from": 80, "to": 100, "color": "rgba(200, 50, 50, .75)" }]
    borders: false
ui-lovelace.yaml:
- type: custom:canvas-gauge-card
entity: sensor.processor_use
name: Processor (%)
card_height: 210
shadow_height: 12%
font_size: 1em
gauge:
type: "radial-gauge"
width: 220
height: 220
borderShadowWidth: 0
borderOuterWidth: 0
borderMiddleWidth: 0
borderInnerWidth: 0
minValue: 0
maxValue: 100
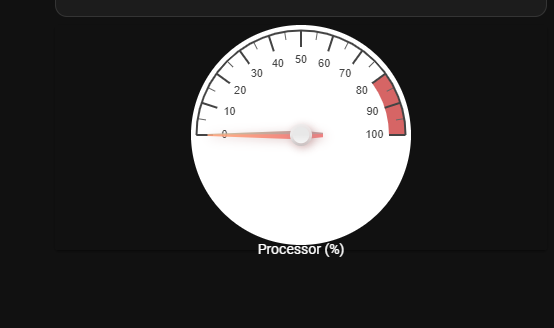
startAngle: 40
ticksAngle: 280
valueBox: false
units: "%"
majorTicks:
["0", "10", "20", "30", "40", "50", "60", "70", "80", "90", "100"]
minorTicks: 2
strokeTicks: true
highlights: [{ "from": 80, "to": 100, "color": "rgba(200, 50, 50, .75)" }]
borders: false
No text version
---
- type: horizontal-stack
  cards:
    - type: custom:canvas-gauge-card
      entity: sensor.load_1m
      card_height: 62
      background_color: "#FFF"
      gauge:
        type: "radial-gauge"
        borderShadowWidth: 0
        borderOuterWidth: 0
        borderMiddleWidth: 0
        borderInnerWidth: 0
        width: 110
        height: 110
        minValue: 0
        maxValue: 100
        startAngle: 90
        ticksAngle: 180
        valueBox: false
        majorTicks:
          ["0", "10", "20", "30", "40", "50", "60", "70", "80", "90", "100"]
        minorTicks: 2
        strokeTicks: true
        highlights:
          [{ "from": 80, "to": 100, "color": "rgba(200, 50, 50, .75)" }]
        colorPlate: "#ddd"
        borders: false
        needleType: "arrow"
        needleWidth: 2
        needleCircleSize: 7
        needleCircleOuter: true
        needleCircleInner: false
        animationDuration: 1500
        animationRule: "linear"
With text version
---
- type: horizontal-stack
  cards:
    - type: custom:canvas-gauge-card
      entity: sensor.processor_use
      card_height: 62
      name: "Processor use"
      shadow_height: "25%"
      font_size: 0.9em
      shadow_bottom: "20"
      gauge:
        type: "radial-gauge"
        width: 110
        height: 110
        borderShadowWidth: 0
        borderOuterWidth: 0
        borderMiddleWidth: 0
        borderInnerWidth: 0
        minValue: 0
        maxValue: 100
        startAngle: 90
        ticksAngle: 180
        valueBox: false
        majorTicks:
          ["0", "10", "20", "30", "40", "50", "60", "70", "80", "90", "100"]
        minorTicks: 2
        strokeTicks: true
        highlights:
          [{ "from": 80, "to": 100, "color": "rgba(200, 50, 50, .75)" }]
        colorPlate: "#ddd"
        borders: false
        needleType: "arrow"
        needleWidth: 2
        needleCircleSize: 7
        needleCircleOuter: true
        needleCircleInner: false
        animationDuration: 1500
animationRule: "linear"Some of the properties that could be set. italic is not mandatory.
| Property | Description |
|---|---|
| entity | your sensor |
| name | shows the name in shadow remove to hide it |
| type | "radial-gauge" or "linear-gauge" |
| dropshadow | true to show dropshadow, false to hide |
| width | width of the gauge |
| height | height of the gauge |
| background_color | sets gauge background color, transparent default if not set |
| card_height | the actual height of the card, set to smaller value than gauge height if using a half guage. Not use if using a full circle gauge. |
| font_size | size of name, leave out it will be dynamic |
| shadow_height | xx% of total height is shadow height |
| shadow_bottom | how far below the gauge in pixels the shadow should apear |
For a complete documentation of available properties, please see https://canvas-gauges.com/documentation/user-guide/configuration