
Table of Contents
- 1.0 Introduction
- 2.0 General Overview
- 3.0 Summary of Functions
- 4.0 Dependencies
- 5.0 Usage
- 6.0 Result
- 7.0 Credits
The purpose of this document is to give technical information about the design of an algorithm that can predict stock market price changes.
This paper targets stock market analysts, investors, and stockholders as it would make it more scientific to trade in the stock market.
This paper targets stock market analysts, investors, and stockholders as it would make it more scientific to trade in the stock market.
The efficient market hypothesis posits that stock market prices arise from the circumstances in which stocks are being traded thus being almost entirely impossible to predict. Stock market prediction programs challenge this notion by using a data set of past market prices to attempt to predict how a stock price will behave in the future. Under the efficient market’s hypothesis, factors that determine the prices of stocks in the future are in the future, and it is thus impossible to accurately predict future prices of stocks today. Stock market predictors use the available data and trends from the trading company’s past to predict future prices with a degree of accuracy. This paper intends to discuss how stock market prediction programs work, their weaknesses and their strengths against other price projection models.

The get_data method reads data from a file (snap.csv) and adds data to the lists dates and prices. It uses the with as block to open the file and assigns it to csvfile.csv. FileReader allows us to iterate over every row in our csv file. Furthermore, next(csvFileReader) skips column names.
dates.append(int(row[0].split('-')[0])) gets day of the month which is at index zero since dates are in the format [date]-[month]-[year].
prices.append(float(row[1])) row[1] is converted to float for more precision.
This method builds the predictive model and graphs it. It takes three parameters: dates, prices, and x (the order of elements). This function creates three models, each of them will be a type of support vector machine. A support vector machine is a linear separator.


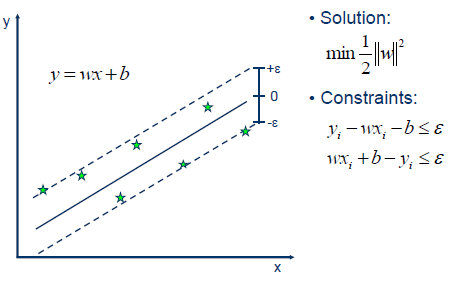
Two things are required when using an SVR, a line with the largest minimum margin and a line that correctly separates as many instances as possible. Since we can't have both, C determines how much we want the latter.
1e3 in svr_lin = SVR(kernel= 'linear', C= 1e3) #denotes 1000.
Next we make a polynomial SVR because, in math folklore, the no free lunch theorem states that there are no guarantees for one optimization to work better than the other. So we'll try both.
svr_poly = SVR(kernel= 'poly', C= 1e3, degree= 2)
Finally, we create one more SVR using a radial basis function. RBF defines similarity to be the Euclidean distance between two inputs If both are right on top of each other, the max similarity is one, if too far it is a zero.
svr_rbf = SVR(kernel= 'rbf', C= 1e3, gamma= 0.1) # To fit the data points in the models, we have
svr_rbf.fit(dates, prices) svr_lin.fit(dates, prices) svr_poly.fit(dates, prices)
Next, we plots the initial data points as black dots with the data label and plot each of our models as well plotting the initial datapoints plt.scatter(dates, prices, color= 'black', label= 'Data')
The graphs are plotted with the help of SVR object in scikit-learn using the dates matrix as our parameter. Each will be a distinct color and and give them a distinct label. The predict_prices returns predictions from each of our models.
plt.plot(dates, svr_rbf.predict(dates), color= 'red', label= 'RBF model') # plotting the line made by the RBF kernel
plt.plot(dates,svr_lin.predict(dates), color= 'green', label= 'Linear model') # plotting the line made by linear kernel
plt.plot(dates,svr_poly.predict(dates), color= 'blue', label= 'Polynomial model') # plotting the line made by polynomial kernel
plt.xlabel('Date') # Setting the x-axis plt.ylabel('Price') # Setting the y-axis
Finally, it returns predictions from each of our models return
svr_rbf.predict(x)[0], svr_lin.predict(x)[0], svr_poly.predict(x)[0]
The dependencies that are installed in the program need to enable the user to collect the dataset with ease, calculate and interpret the numbers in the dataset, build a predictive model based on the past dataset and build a projective model for the future of the stock prices. When running in synchrony, the dependencies help in developing a support vector machine. A support vector machine primarily is a linear separator that takes data that is classified and attempts to predict and classify unclassified data. The support vector machine aid in the calculation of the support vector regression which can be calculated to accurately determine how each addition of data or alteration of market factors will alter the price of stocks. The four dependencies include:
pip install csv : To read data from the stock prices (https://pypi.python.org/pypi/csv)
pip install numpy : To perform calculations (http://www.numpy.org/)
pip install scikit-learn : To build a predictive model (http://scikit-learn.org/)
pip install matplotlib : To plot datapoints on the model to analyze (http://matplotlib.org/)
run stock-er


On analyzing the graph, we see that each of our models shows up in the graph and the RBF model seems to fit our data the best. Hence, we can use it's prediction in the command line to make stock predictions
The support vector regression estimates how each addition or modification of data affects the prediction and outlook on the future prices of stock. The support vector regression can be developed by using either the linear function model, the polynomial functions model or the ration basis model. The different results can then be plotted on one or different graphs for analysis). These graphs are then compared with the actual data from the company’s history and the model that matches the historical data and trends can then be used to predict how the figures will react to market stimuli.
The efficient market hypothesis states that the factors that determine the price of stocks in the future are in the future thus making the future prices of stocks random and unpredictable. However, using the stock market prediction methods outlined in this program simplifies the process of prediction by removing the random element out of stock market price futures. The use of support vector machines for classification and regression analyses gives a scientific element to the prediction of stock market prices rather than relying on hunches and intuition. A combination of the thus computed results and sound investment planning will, therefore, raise an investor’s chance of stock market success.
- http://docs.opencv.org/2.4/doc/tutorials/ml/introduction_to_svm/introduction_to_svm.html
- https://nicholastsmith.wordpress.com/2016/04/20/stock-market-prediction-using-multi-layer-perceptrons-with-tensorflow/
- http://eugenezhulenev.com/blog/2014/11/14/stock-price-prediction-with-big-data-and-machine-learning/
- http://jspauld.com/post/35126549635/how-i-made-500k-with-machine-learning-and-hft
- https://i1.wp.com/www.infoeuropefx.com/wp-content/uploads/2017/03/snapchat-shares.jpg?resize=620%2C330&ssl=1
- http://www.romeconomics.com/wp-content/uploads/2013/08/EfficientMarkets.png"
- https://upload.wikimedia.org/wikipedia/commons/thumb/2/2a/Svm_max_sep_hyperplane_with_margin.png/220px-Svm_max_sep_hyperplane_with_margin.png
- http://www.saedsayad.com/images/SVR_1.png
- http://68.media.tumblr.com/0e459c9df3dc85c301ae41db5e058cb8/tumblr_inline_n9xq5hiRsC1rmpjcz.jpg

