GithubHelp home page GithubHelp logo

deadtrickster / prometheus.erl Goto Github PK

View Code? Open in Web Editor NEW
340.0 19.0 119.0 4.18 MB

Prometheus.io client in Erlang

License: MIT License

Erlang 99.05% Elixir 0.30% Emacs Lisp 0.09% Shell 0.56% Clean 0.01%
prometheus erlang metrics instrumentation monitoring

prometheus.erl's Introduction

Prometheus.io client for Erlang

Copyright (c) 2016,2017 Ilya Khaprov <[email protected]>.

Version: 4.11.0

Hex.pm Hex.pm Build Status Coverage Status

Prometheus.io monitoring system and time series database client in Erlang.

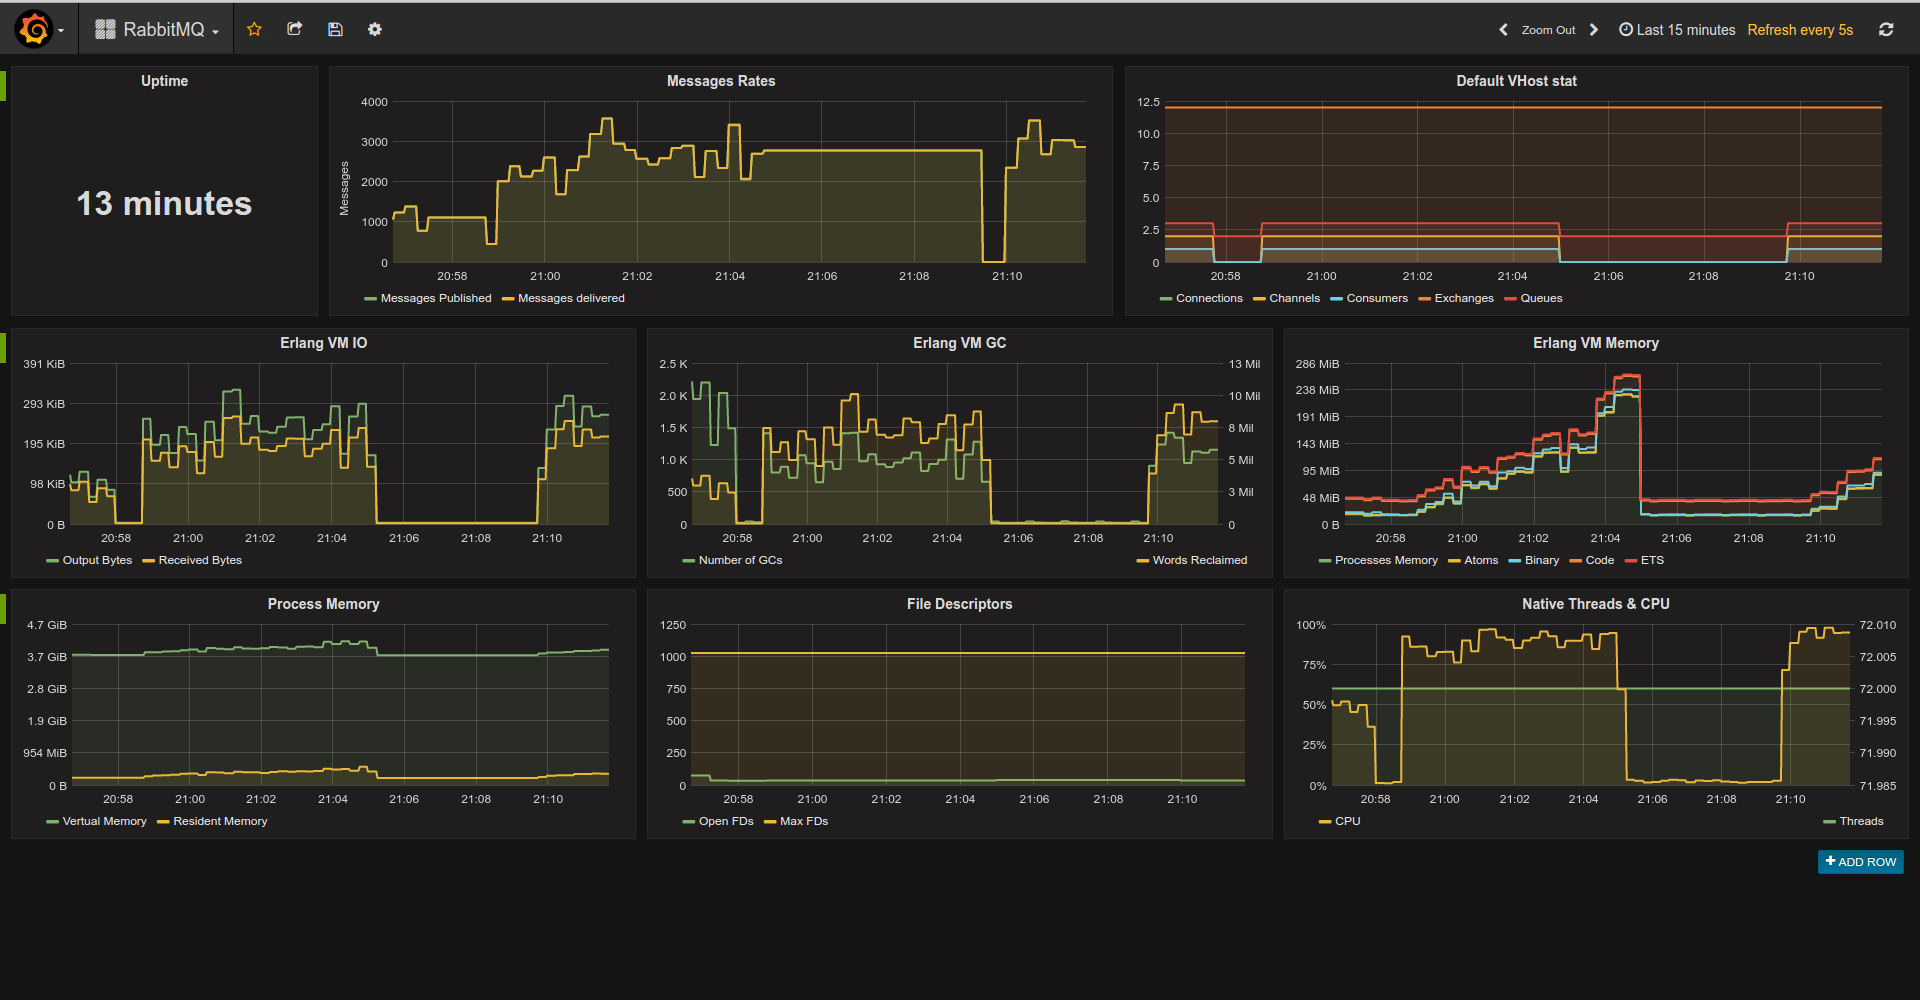
RabbitMQ Dashboard

  • IRC: #erlang on Freenode;
  • Slack: #prometheus channel - Browser or App(slack://elixir-lang.slack.com/messages/prometheus).

Integrations

Dashboards

Blogs

Erlang VM & OTP Collectors

Compatibility

OTP versions

Version 3.x works on OTP18+. For older version (oldest tested is R16B03) please use 3.x-pre18 branch. 3.x-pre18 will work on all OTP releases starting from R16B03 and its beam will recompile itself to accommodate. For example, this branch is used by RabbitMQ Exporter 3.6.x that should be compatible with all versions starting from R16B03.

Build tools

Rebar3 and rebar2 are supported.

Example Console Session

Run shell with compiled and loaded app:


    $ rebar3 shell

Start prometheus app:


prometheus:start().

Register metrics:

prometheus_gauge:new([{name, pool_size}, {help, "MongoDB Connections pool size"}]),
prometheus_counter:new([{name, http_requests_total}, {help, "Http request count"}]).
prometheus_summary:new([{name, orders}, {help, "Track orders count/total sum"}]).
prometheus_histogram:new([{name, http_request_duration_milliseconds},
                               {labels, [method]},
                               {buckets, [100, 300, 500, 750, 1000]},
                               {help, "Http Request execution time"}]).

Use metrics:

prometheus_gauge:set(pool_size, 365),
prometheus_counter:inc(http_requests_total).
prometheus_summary:observe(orders, 10).
prometheus_summary:observe(orders, 15).
prometheus_histogram:observe(http_request_duration_milliseconds, [get], 95).
prometheus_histogram:observe(http_request_duration_milliseconds, [get], 100).
prometheus_histogram:observe(http_request_duration_milliseconds, [get], 102).
prometheus_histogram:observe(http_request_duration_milliseconds, [get], 150).
prometheus_histogram:observe(http_request_duration_milliseconds, [get], 250).
prometheus_histogram:observe(http_request_duration_milliseconds, [get], 75).
prometheus_histogram:observe(http_request_duration_milliseconds, [get], 350).
prometheus_histogram:observe(http_request_duration_milliseconds, [get], 550).
prometheus_histogram:observe(http_request_duration_milliseconds, [get], 950).
prometheus_histogram:observe(http_request_duration_milliseconds, [post], 500),
prometheus_histogram:observe(http_request_duration_milliseconds, [post], 150).
prometheus_histogram:observe(http_request_duration_milliseconds, [post], 450).
prometheus_histogram:observe(http_request_duration_milliseconds, [post], 850).
prometheus_histogram:observe(http_request_duration_milliseconds, [post], 750).
prometheus_histogram:observe(http_request_duration_milliseconds, [post], 1650).

Export metrics as text:

io:format(prometheus_text_format:format()).

->

# TYPE http_requests_total counter
# HELP http_requests_total Http request count
http_requests_total 2
# TYPE pool_size gauge
# HELP pool_size MongoDB Connections pool size
pool_size 365
# TYPE orders summary
# HELP orders Track orders count/total sum
orders_count 4
orders_sum 50
# TYPE http_request_duration_milliseconds histogram
# HELP http_request_duration_milliseconds Http Request execution time
http_request_duration_milliseconds_bucket{method="post",le="100"} 0
http_request_duration_milliseconds_bucket{method="post",le="300"} 1
http_request_duration_milliseconds_bucket{method="post",le="500"} 3
http_request_duration_milliseconds_bucket{method="post",le="750"} 4
http_request_duration_milliseconds_bucket{method="post",le="1000"} 5
http_request_duration_milliseconds_bucket{method="post",le="+Inf"} 6
http_request_duration_milliseconds_count{method="post"} 6
http_request_duration_milliseconds_sum{method="post"} 4350
http_request_duration_milliseconds_bucket{method="get",le="100"} 3
http_request_duration_milliseconds_bucket{method="get",le="300"} 6
http_request_duration_milliseconds_bucket{method="get",le="500"} 7
http_request_duration_milliseconds_bucket{method="get",le="750"} 8
http_request_duration_milliseconds_bucket{method="get",le="1000"} 9
http_request_duration_milliseconds_bucket{method="get",le="+Inf"} 9
http_request_duration_milliseconds_count{method="get"} 9
http_request_duration_milliseconds_sum{method="get"} 2622

API

API can be grouped like this:

Standard Metrics & Registry

All metrics created via new/1 or declare/1. The difference is that new/1 actually wants metric to be new and raises {mf_already_exists, {Registry, Name}, Message} error if it isn't.

Both new/1 and declare/1 accept options as proplist. Common options are:

  • name - metric name, can be an atom or a string (required);
  • help - metric help, string (required);
  • labels - metric labels, label can be an atom or a string (default is []);
  • registry - Prometheus registry for the metric, can be any term. (default is default)

Histogram also accepts buckets option. Please refer to respective modules docs for the more information.

Exposition Formats

General Helpers

Advanced

You will need these modules only if you're writing custom collector for app/lib that can't be instrumented directly.

Build

   $ rebar3 compile

Configuration

Prometheus.erl supports standard Erlang app configuration.

  • collectors - List of custom collectors modules to be registered automatically. If undefined list of all modules implementing prometheus_collector behaviour will be used.
  • default_metrics - List of metrics to be registered during app startup. Metric format: {Type, Spec} where Type is a metric type (counter, gauge, etc), Spec is a list to be passed to Metric:declare/1. Deprecated format {Registry, Metric, Spec} also supported.

Collectors config also supports "alias" option default. When used these collectors will be registered:

prometheus_boolean,
prometheus_counter,
prometheus_gauge,
prometheus_histogram,
prometheus_mnesia_collector,
prometheus_summary,
prometheus_vm_memory_collector,
prometheus_vm_statistics_collector,
prometheus_vm_system_info_collector

Collectors & Exporters Conventions

Configuration

All 3d-party libraries should be configured via prometheus app env.

Exproters are responsible for maintianing scrape endpoint. Exporters usually tightly coupled with web server and are singletons. They should understand these keys:

  • path - url for scraping;
  • format - scrape format as module name i.e. prometheus_text_format or prometheus_protobuf_format. Exporter-specific options should be under <exporter_name>_exporter for erlang or <Exporter_name>Exporter for Elixir i.e. PlugsExporter or elli_exporter

Collectors collect integration specific metrics i.e. ecto timings, process informations and so on. Their configuration should be under <collector_name>_collectorfor erlang or <Collector_name>Collector for Elixir i.e. process_collector, EctoCollector and so on.

Naming

For Erlang: prometheus_<name>_collector/prometheus_<name>_exporter.

For Elixir: Prometheus.<name>Collector/Prometheus.<name>Exporter.

Contributing

Sections order:

Types -> Macros -> Callbacks -> Public API -> Deprecations -> Private Parts

install git precommit hook:

   ./bin/pre-commit.sh install

Pre-commit check can be skipped passing --no-verify option to git commit.

License

MIT

Modules

prometheus_boolean
prometheus_buckets
prometheus_collector
prometheus_counter
prometheus_format
prometheus_gauge
prometheus_histogram
prometheus_http
prometheus_mnesia
prometheus_mnesia_collector
prometheus_model_helpers
prometheus_protobuf_format
prometheus_quantile_summary
prometheus_registry
prometheus_summary
prometheus_text_format
prometheus_time
prometheus_vm_dist_collector
prometheus_vm_memory_collector
prometheus_vm_msacc_collector
prometheus_vm_statistics_collector
prometheus_vm_system_info_collector

prometheus.erl's People

Contributors

aaron-seo avatar binarin avatar dcorbacho avatar deadtrickster avatar essen avatar florinpatrascu avatar gerhard avatar getong avatar gomoripeti avatar hairyhum avatar ipinak avatar lhoguin avatar lukebakken avatar massemanet avatar michaelklishin avatar nikolaborisov avatar redink avatar roadrunnr avatar slezakattack avatar sonicoder avatar stribb avatar vkatsuba avatar x0id avatar xelgun avatar yurrriq avatar

Stargazers

 avatar  avatar  avatar  avatar  avatar  avatar  avatar  avatar  avatar  avatar  avatar  avatar  avatar  avatar  avatar  avatar  avatar  avatar  avatar  avatar  avatar  avatar  avatar  avatar  avatar  avatar  avatar  avatar  avatar  avatar  avatar  avatar  avatar  avatar  avatar  avatar  avatar  avatar  avatar  avatar  avatar  avatar  avatar  avatar  avatar  avatar  avatar  avatar  avatar  avatar  avatar  avatar  avatar  avatar  avatar  avatar  avatar  avatar  avatar  avatar  avatar  avatar  avatar  avatar  avatar  avatar  avatar  avatar  avatar  avatar  avatar  avatar  avatar  avatar  avatar  avatar  avatar  avatar  avatar  avatar  avatar  avatar  avatar  avatar  avatar  avatar  avatar  avatar  avatar  avatar  avatar  avatar  avatar  avatar  avatar  avatar  avatar  avatar  avatar  avatar

Watchers

 avatar  avatar  avatar  avatar  avatar  avatar  avatar  avatar  avatar  avatar  avatar  avatar  avatar  avatar  avatar  avatar  avatar  avatar  avatar

prometheus.erl's Issues

Make call/cast configurable for dinc/dobserve.

When gen_server:cast is used:

  • smaller latency for instrumented code;
  • easy to overflow metric's genserver queue;
  • on spikes or sustained high-load metric value can significantly lag behind its real value probably making scarped value unreliable.

When gen_server:call is used:

  • increased latency for instrumented code;
  • virtually impossibly to overflow metric's gen_server;
  • metric value is always up-to-date. doesn't scale well though.

So if one doesn't expect spikes or highloads cast can be used safely.
Call is slow, 'safe' but doesn't scale.

Call/cast selection could be configured via use_call options. Default is false -> gen_server:cast will be used.

Exometer integration?

We are using exometer for metric collection of our projects. Is there a way to export exometer based metrics to prometheus. as we want to move toward prometheus based monitoring.

Performance (ETS locks, backends, etc)

Instead of providing two API sets just use pluggable backends.

prometheus_counter:declare([{name, http_requests_total,
                            {help, "Total count of HTTP requests"},
                            {backend, {gen_server, 5000}}]).

Here http_requests_total will be using gen_server backend AND gen_server:call with 5 seconds timeout.

Default backend is 'raw' ETS using update_counter.

'protobuf' not found.

ะŸั€ะธะฒะตั‚, ะธะทะฒะธะฝะธ, ั‡ั‚ะพ ะฟะธัˆัƒ ะทะดะตััŒ - ะฝะต ะทะฝะฐัŽ ะณะดะต ะตั‰ั‘ ะผะพะถะฝะพ ะทะฐะดะฐั‚ัŒ ะฒะพะฟั€ะพั.

ะŸั€ะธ ะฟะพะฟั‹ั‚ะบะต ะบะพะผะฟะธะปัั†ะธะธ ะฟะพะปัƒั‡ะฐัŽ ะพัˆะธะฑะบัƒ

Unable to run pre hooks for 'compile', command 'compile' in namespace 'protobuf' not found.

rebar3

{prometheus, {git, "https://github.com/deadtrickster/prometheus.erl.git", {tag, "v3.0.0"}}}

windows 7

prometheus_instrumenter behaviour

Unlike collectors instrumenters directly intstrument their targets andtherefore maintain metrics that need to be created/declared beforehand.

Known instrumenters include: plugs, ecto, phoenix, elli, etc.

Instrumenter exports setup/0 function.

There should be config entry for list of instrumenters to be setup at prometheus supervisor startup. By default setะณp/0 for all modules that implement prometheus_instrumenter behaviour called.

Content-Type negotiation

This is how Accept header looks currently:

application/vnd.google.protobuf;proto=io.prometheus.client.MetricFamily;encoding=delimited;q=0.7,text/plain;version=0.0.4;q=0.3,application/json;schema=\"prometheus/telemetry\";version=0.0.2;q=0.2,*/*;q=0.1.

prometheus.erl only supported delimited protobuf and text version 0.0.4

prometheus:stop() hangs when run from an ejabberd module

First of all, thanks for creating this library, very useful!

I'm trying to implement an ejabberd module that uses prometheus:

Here's what I have:

-module(mod_prometheus).

-include("ejabberd_http.hrl").
-include("logger.hrl").

-behavior(gen_mod).

-export([
  start/2,
  stop/1,
  depends/2,
  mod_opt_type/1,
  process/2
]).

start(Host, _Opts) ->
  ?INFO_MSG("~s starting on ~p", [?MODULE, Host]),
  prometheus:start().

stop(Host) ->
  ?INFO_MSG("~s stopping on ~p", [?MODULE, Host]),
  prometheus:stop(),
  ?INFO_MSG("~s stopped on ~p", [?MODULE, Host]),
  ok.

depends(_Host, _Opts) ->
  [].

mod_opt_type(_) ->
  [].

process([], #request{method = 'GET'}) ->
  {
    200,
    [{<<"Content-Type">>, prometheus_text_format:content_type()}],
    prometheus_text_format:format()
  }.

However, when I shutdown/restart ejabberd, prometheus:stop() never returns:

[...]
2017-05-24 17:55:34.446 [info] <0.63.0>@mod_prometheus:stop:30 mod_prometheus stopping on <<"localhost">>

Do you have an idea how I can find out what's going on? Any help would be highly appreciated!

mixing floats and ints result in infinite loop

this snippet will send prometheus into an infinite loop.

1> application:ensure_all_started(prometheus).
{ok,[prometheus]}
2> prometheus_counter:declare([{name,nejm},{help,"help"}]).
true
3> prometheus_counter:dinc(nejm,1.0).
ok
4>  prometheus_counter:inc(nejm,1).

I realize mixing floats and ints are wrong (I did encounter this due to a bug), but infinite loops are not a great way to handle bad input.

the offending code
https://github.com/deadtrickster/prometheus.erl/blob/master/src/metrics/prometheus_counter.erl#L196
assumes that the badarg implies that the key does not exist (whereas in this case the key exists but the value is of the wrong type)

Bump version

Due the recent breaking changes, we ought to bump the version.

Add processes collector

Based on process_info, aggregated by application.

application:get_application to get application of Pid (leader actually, but anyway).

TODO list of metrics

Document observing/increasing multiple labels

Hi!

Thank you for a really nice library!

How do I increase multiple labels in a safe way? Suppose I have something like

prometheus_counter:new([{name, foo}, {help, "foo"}, {labels, [class, status]}])

If I want to bump this counter, I do:

prometheus_counter:inc(foo, [x, success]),
prometheus_counter:inc(foo, [y, failure]),

My question is: what if I add another label or provide the wrong order of labels? Can I send in a map, like:

prometheus_counter:inc(foo, #{ class => x, status => success })

or do I have to be precise? There is no documentation examples of this, and I dug in the tests but found no coverage of this, but perhaps I didn't look with enough conviction :)

So:

I expected

documentation on how one observes multiple labels for an observation/increase.

I found

nothing of this sort in the README.md file. If I run into this, surely others are going to do the same, so if there is documentation somewhere, please make this into a "point to the correct documentation" issue :)

Thanks!

Error to require Prometheus HEAD

mix.exs

defp deps do
  [...
   {:prometheus, github: "deadtrickster/prometheus.erl", ref: "3b0f91f", override: true},
   {:prometheus_ex, "~> 1.1"},
   {:prometheus_ecto, "~> 1.0"},
   {:prometheus_phoenix, "~> 1.0"},
   {:prometheus_plugs, "~> 1.0"},
   {:prometheus_process_collector, "~> 1.0"}
  ]
$ mix deps.get
$ mix phoenix.server
...
** (Mix) Could not start application my_app: exited in: MyApp.start(:normal, [])
    ** (EXIT) an exception was raised:
        ** (ArgumentError) argument error
            (stdlib) :ets.insert(:prometheus_registry_table, {:default, :prometheus_histogram})
            (prometheus) src/prometheus_registry.erl:79: :prometheus_registry.register_collector/2
            (prometheus) src/prometheus_metric.erl:101: :prometheus_metric.insert_mf/3
            (my_app) lib/my_app/phoenix_instrumenter.ex:2: MyApp.PhoenixInstrumenter.setup/0
            (my_app) lib/my_app.ex:21: MyApp.start/2
            (kernel) application_master.erl:273: :application_master.start_it_old/4
$ iex
Erlang/OTP 19 [erts-8.1] [source] [64-bit] [smp:8:8] [async-threads:10] [hipe] [kernel-poll:false] [dtrace]

Interactive Elixir (1.3.4) - press Ctrl+C to exit (type h() ENTER for help)
iex(1)> :os.type
{:unix, :darwin}

Slow Supervisor Boot Time

Context:
I've added the prometheus_ex library to my phoenix application. When I do this, my mix tasks and overall boot time for the whole application has gone up by a minute. I've started trying to determine where this occurs, and it's definitely happening the moment this application is added to the supervision tree.

Any thoughts on how I can improve runtime boot time?

New time measurement system

Durations measured as difference between start and end erlang:monotonic_times in so called native time units. native time units are meaningless and have to be converted using erlang:convert_time_unit. However as erlang:convert_time_unit documentation warns:

You may lose accuracy and precision when converting between time units.
In order to minimize such loss, collect all data at native time unit and do the 
conversion on the end result.

The idea is that set_duration/observe_duration functions always work with native time units and conversion is delayed until scraping/retrieving value. To implement this, metric needs to know desired time unit. Users can specify desired time unit explicitly via duration_unit or mplicitly via metric name ((preferred, since prometheus best practices insists on <name>_duration_<unit> metric name format).

Possible units:

  • microseconds;
  • milliseconds;
  • seconds;
  • minutes;
  • hours;
  • days;

Histogram will internally convert buckets bounds to native units if duration_unit is provided. It will convert it back when scraping or retrieving value.

rebar2 support

Hi, I'm working on a project that's currently using rebar2, and I had some minor trouble adding prometheus.erl in without modification. (I would migrate to rebar3, but it is non-trivial, I want to add metrics/monitoring first.)

with just a fresh checkout of prometheus.erl, the following happens:

# rebar compile
==> prometheus.erl (compile)
ERROR: Protobuffs library not present in code path!
ERROR: compile failed while processing /<path>/prometheus.erl: rebar_abort

This stems from the fact that rebar is trying to generate erlang source from src/model/prometheus_model.proto, but the library is not installed. Since src/model/prometheus_model.erl already exists and whatever generate step is not necessary for things to work, my solution was rm src/model/prometheus_model.proto and then everything works fine, wrapped in a Makefile.

I tried to ignore or delete the file from rebar, but couldn't find a way to do that when it's used as a dependency.

It would be nice if I didn't have to wrap it with a Makefile.

Error to compile on Ubuntu 14.4

It's not able to compile prometheus.erl on Ubuntu 14.4

mix.exs:

defp deps do[{:prometheus, "~> 3.1.0"}] end
$ mix local.rebar
$ rm -rf deps
$ rm -rf _build

$ mix deps.get
Running dependency resolution...
Dependency resolution completed:
  prometheus 3.1.1
* Getting prometheus (Hex package)
  Checking package (https://repo.hex.pm/tarballs/prometheus-3.1.1.tar)
  Fetched package

$ mix compile
===> Compiling prometheus
===> Unable to run pre hooks for 'compile', command 'compile' in namespace 'protobuf' not found.
** (Mix) Could not compile dependency :prometheus, "/home/ubuntu/.mix/rebar3 bare compile --paths "/home/application/current/_build/prod/lib/*/ebin"" command failed. You can recompile this dependency with "mix deps.compile prometheus", update it with "mix deps.update prometheus" or clean it with "mix deps.clean prometheus"
$ cat /etc/*release
DISTRIB_ID=Ubuntu
DISTRIB_RELEASE=14.04
DISTRIB_CODENAME=trusty
DISTRIB_DESCRIPTION="Ubuntu 14.04.3 LTS"
NAME="Ubuntu"
VERSION="14.04.3 LTS, Trusty Tahr"
ID=ubuntu
ID_LIKE=debian
PRETTY_NAME="Ubuntu 14.04.3 LTS"
VERSION_ID="14.04"
HOME_URL="http://www.ubuntu.com/"
SUPPORT_URL="http://help.ubuntu.com/"
BUG_REPORT_URL="http://bugs.launchpad.net/ubuntu/"
$ elixir --version
Erlang/OTP 19 [erts-8.2] [source] [64-bit] [smp:4:4] [async-threads:10] [kernel-poll:false]

Elixir 1.4.0

question about initial gauge/counter values

I find the sequence below is a bit counter-intuitive.

(r@turbot)4> prometheus_gauge:new([{name,"name"},{help,"help me!"}]).
ok
(r@turbot)5> prometheus_gauge:value("name").
undefined
(r@turbot)6> prometheus_gauge:reset("name").
false
(r@turbot)7> prometheus_gauge:value("name").
undefined
(r@turbot)8> prometheus_gauge:set("name",1).
ok
(r@turbot)9> prometheus_gauge:reset("name").
true
(r@turbot)10> prometheus_gauge:value("name").
0

I expected the metric to be created with the default value, and also that reset would always work.

Is this a bug or a feature?

is it possible to add a prefix to metrics?

I'm checking the metrics are retrieved in this way:

erlang_vm_memory_bytes_total{kind="system"} 46309272
erlang_vm_memory_bytes_total{kind="processes"} 102828968

I've different servers and I want to add a prefix to that metric, is it possible? are there a better option to do that? Thanks.

Question on enabling collectors

Hello,

I have been using a dot config file to enable collectors for prometheus and its working well for me. However if I wanted to enable / disable collectors in a more dynamic way, say having a web page from which I could select a collector and click a button called enabled or disable it similarly, so that no more metrices are sent to prometheus, is that something that can be done ? If so then can some pointers be given as to how to go about it roughly, what api I should be looking at etc ?

Thanks !
Devangana

need help adding new metrics

I have prometheus.erl and prometheus_httpd included in my rebar3 project, and I see the metrics for the erlang VM, etc. Now I am trying to added a couple new metrics of my own, like response time to a http POST, etc. But I can not seem to get this working.

Is there a simple step-by-step example to add a new metric to a existing erlang application.??

Thanks,
Mark.

Histogram bounds don't seem to behave like in the examples

I've been trying to implement some histograms in my metrics but the bounds never seem to match the ones I defined initially. Even by copying your histogram example it doesn't seem to work the same way:

:prometheus_histogram.new([{:name, :http_request_duration_milliseconds}, {:labels, [:method]}, {:bounds, [100, 300, 500, 750, 1000]}, {:help, "Http Request execution time"}])
:ok
iex(2)>  :prometheus_histogram.observe(:http_request_duration_milliseconds, [:get], 95)                                                                                              :ok
iex(3)>  :prometheus_histogram.observe(:http_request_duration_milliseconds, [:get], 102)
:ok
iex(4)>  :prometheus_histogram.observe(:http_request_duration_milliseconds, [:get], 150)
:ok
iex(5)>  :prometheus_histogram.observe(:http_request_duration_milliseconds, [:get], 250)
:ok
iex(6)> :io.format :prometheus_text_format.format
# TYPE erlang_vm_ets_limit gauge
# HELP erlang_vm_ets_limit The maximum number of ETS tables allowed.
erlang_vm_ets_limit 2053
# TYPE erlang_vm_logical_processors gauge
# HELP erlang_vm_logical_processors The detected number of logical processors configured in the system.
erlang_vm_logical_processors 4
# TYPE erlang_vm_logical_processors_available gauge
# HELP erlang_vm_logical_processors_available The detected number of logical processors available to the Erlang runtime system.
erlang_vm_logical_processors_available NaN
# TYPE erlang_vm_logical_processors_online gauge
# HELP erlang_vm_logical_processors_online The detected number of logical processors online on the system.
erlang_vm_logical_processors_online 4
# TYPE erlang_vm_port_count gauge
# HELP erlang_vm_port_count The number of ports currently existing at the local node.
erlang_vm_port_count 29
# TYPE erlang_vm_port_limit gauge
# HELP erlang_vm_port_limit The maximum number of simultaneously existing ports at the local node.
erlang_vm_port_limit 65536
# TYPE erlang_vm_process_count gauge
# HELP erlang_vm_process_count The number of processes currently existing at the local node.
erlang_vm_process_count 310
# TYPE erlang_vm_process_limit gauge
# HELP erlang_vm_process_limit The maximum number of simultaneously existing processes at the local node.
erlang_vm_process_limit 262144
# TYPE erlang_vm_schedulers gauge
# HELP erlang_vm_schedulers The number of scheduler threads used by the emulator.
erlang_vm_schedulers 4
# TYPE erlang_vm_schedulers_online gauge
# HELP erlang_vm_schedulers_online The number of schedulers online.
erlang_vm_schedulers_online 4
# TYPE erlang_vm_smp_support untyped
# HELP erlang_vm_smp_support 1 if the emulator has been compiled with SMP support, otherwise 0.
erlang_vm_smp_support 1
# TYPE erlang_vm_threads untyped
# HELP erlang_vm_threads 1 if the emulator has been compiled with thread support, otherwise 0.
erlang_vm_threads 1
# TYPE erlang_vm_thread_pool_size gauge
# HELP erlang_vm_thread_pool_size The number of async threads in the async thread pool used for asynchronous driver calls.
erlang_vm_thread_pool_size 10
# TYPE erlang_vm_time_correction untyped
# HELP erlang_vm_time_correction 1 if time correction is enabled, otherwise 0.
erlang_vm_time_correction 1
# TYPE erlang_vm_statistics_context_switches counter
# HELP erlang_vm_statistics_context_switches Total number of context switches since the system started
erlang_vm_statistics_context_switches 173394
# TYPE erlang_vm_statistics_garbage_collection_number_of_gcs counter
# HELP erlang_vm_statistics_garbage_collection_number_of_gcs Garbage collection: number of GCs
erlang_vm_statistics_garbage_collection_number_of_gcs 11111
# TYPE erlang_vm_statistics_garbage_collection_words_reclaimed counter
# HELP erlang_vm_statistics_garbage_collection_words_reclaimed Garbage collection: words reclaimed
erlang_vm_statistics_garbage_collection_words_reclaimed 50897993
# TYPE erlang_vm_statistics_garbage_collection_bytes_reclaimed counter
# HELP erlang_vm_statistics_garbage_collection_bytes_reclaimed Garbage collection: bytes reclaimed
erlang_vm_statistics_garbage_collection_bytes_reclaimed 407183944
# TYPE erlang_vm_statistics_bytes_received_total counter
# HELP erlang_vm_statistics_bytes_received_total Total number of bytes received through ports
erlang_vm_statistics_bytes_received_total 28204523
# TYPE erlang_vm_statistics_bytes_output_total counter
# HELP erlang_vm_statistics_bytes_output_total Total number of bytes output to ports
erlang_vm_statistics_bytes_output_total 5403240
# TYPE erlang_vm_statistics_reductions_total counter
# HELP erlang_vm_statistics_reductions_total Total reductions
erlang_vm_statistics_reductions_total 25234130
# TYPE erlang_vm_statistics_run_queues_length_total gauge
# HELP erlang_vm_statistics_run_queues_length_total Total length of the run-queues
erlang_vm_statistics_run_queues_length_total 0
# TYPE erlang_vm_statistics_runtime_milliseconds counter
# HELP erlang_vm_statistics_runtime_milliseconds The sum of the runtime for all threads in the Erlang runtime system. Can be greater than wall clock time
erlang_vm_statistics_runtime_milliseconds 3590
# TYPE erlang_vm_statistics_wallclock_time_milliseconds counter
# HELP erlang_vm_statistics_wallclock_time_milliseconds Information about wall clock. Same as erlang_vm_statistics_runtime_milliseconds except that real time is measured
erlang_vm_statistics_wallclock_time_milliseconds 46868
# TYPE erlang_vm_memory_atom_bytes_total gauge
# HELP erlang_vm_memory_atom_bytes_total The total amount of memory currently allocated for atoms. This memory is part of the memory presented as system memory.
erlang_vm_memory_atom_bytes_total{usage="used"} 974501
erlang_vm_memory_atom_bytes_total{usage="free"} 17932
# TYPE erlang_vm_memory_bytes_total gauge
# HELP erlang_vm_memory_bytes_total The total amount of memory currently allocated. This is the same as the sum of the memory size for processes and system.
erlang_vm_memory_bytes_total{kind="system"} 52162768
erlang_vm_memory_bytes_total{kind="processes"} 24534512
# TYPE erlang_vm_dets_tables gauge
# HELP erlang_vm_dets_tables Erlang VM DETS Tables count
erlang_vm_dets_tables 0
# TYPE erlang_vm_ets_tables gauge
# HELP erlang_vm_ets_tables Erlang VM ETS Tables count
erlang_vm_ets_tables 74
# TYPE erlang_vm_memory_processes_bytes_total gauge
# HELP erlang_vm_memory_processes_bytes_total The total amount of memory currently allocated for the Erlang processes.
erlang_vm_memory_processes_bytes_total{usage="used"} 24532544
erlang_vm_memory_processes_bytes_total{usage="free"} 1968
# TYPE erlang_vm_memory_system_bytes_total gauge
# HELP erlang_vm_memory_system_bytes_total The total amount of memory currently allocated for the emulator that is not directly related to any Erlang process. Memory presented as processes is not included in this memory.
erlang_vm_memory_system_bytes_total{usage="atom"} 992433
erlang_vm_memory_system_bytes_total{usage="binary"} 862136
erlang_vm_memory_system_bytes_total{usage="code"} 28049221
erlang_vm_memory_system_bytes_total{usage="ets"} 2450216
erlang_vm_memory_system_bytes_total{usage="other"} 19808762
# TYPE http_request_duration_milliseconds histogram
# HELP http_request_duration_milliseconds Http Request execution time
http_request_duration_milliseconds_bucket{method="get",le="0.005"} 4
http_request_duration_milliseconds_bucket{method="get",le="0.01"} 4
http_request_duration_milliseconds_bucket{method="get",le="0.025"} 4
http_request_duration_milliseconds_bucket{method="get",le="0.05"} 4
http_request_duration_milliseconds_bucket{method="get",le="0.1"} 4
http_request_duration_milliseconds_bucket{method="get",le="0.25"} 4
http_request_duration_milliseconds_bucket{method="get",le="0.5"} 4
http_request_duration_milliseconds_bucket{method="get",le="1.0"} 4
http_request_duration_milliseconds_bucket{method="get",le="2.5"} 4
http_request_duration_milliseconds_bucket{method="get",le="5.0"} 4
http_request_duration_milliseconds_bucket{method="get",le="10.0"} 4
http_request_duration_milliseconds_bucket{method="get",le="+Inf"} 4
http_request_duration_milliseconds_count{method="get"} 4
http_request_duration_milliseconds_sum{method="get"} 5.97e-4

Why am I getting this:

http_request_duration_milliseconds_bucket{method="get",le="0.005"} 4
http_request_duration_milliseconds_bucket{method="get",le="0.01"} 4
http_request_duration_milliseconds_bucket{method="get",le="0.025"} 4
http_request_duration_milliseconds_bucket{method="get",le="0.05"} 4
http_request_duration_milliseconds_bucket{method="get",le="0.1"} 4
http_request_duration_milliseconds_bucket{method="get",le="0.25"} 4
http_request_duration_milliseconds_bucket{method="get",le="0.5"} 4
http_request_duration_milliseconds_bucket{method="get",le="1.0"} 4
http_request_duration_milliseconds_bucket{method="get",le="2.5"} 4
http_request_duration_milliseconds_bucket{method="get",le="5.0"} 4
http_request_duration_milliseconds_bucket{method="get",le="10.0"} 4
http_request_duration_milliseconds_bucket{method="get",le="+Inf"} 4

If I defined these bounds: [100, 300, 500, 750, 1000]. Shouldn't I get a line for each bound in that array? Could this be an Elixir incompatibility when using the Erlang driver?

Allocators instance label clashes with native Prometheus label

I somehow missed it but erlang_vm_allocators instance label conflicts with autoassigned. it could be renamed to instance_no or alloctor_no.

By default prometheus renames this label to exported_instance and replace with scrape target. When honor_lables is true it doesn't (this is what we use).

cc @gerhard

Refactor metric:value

value/1,2,3 should check whether MF exists (and throw error via check_mf_exists)
and return undefined if specific metric (defined by labels combination) doesn't (now they throw match error).

question about NaN

noticed this output from the system info collector. Shouldn't the value be NaN in this case?

# TYPE erlang_vm_logical_processors_available gauge
# HELP erlang_vm_logical_processors_available The detected number of logical processors available to the Erlang runtime system
erlang_vm_logical_processors_available unknown

Write Documentation

Can hex.pm host edoc generated docs?

Checklist for modules:

  • buckets;
  • collector;
  • format;
  • registry;
  • vm_memory_collector;
  • vm_statistics_collector;
  • vm_system_info_collector;
  • http;
  • protobuf_format;
  • text_format;
  • counter;
  • gauge;
  • histogram;
  • summary;
  • model_helpers.

Checklist for pages:

  • Overview;
  • Time intervals.

Add node label to all metrics

I believe that all metrics coming from an Erlang node should be labelled with node/0, i.e.:

...
# TYPE rabbitmq_node_io_read_bytes gauge
# HELP rabbitmq_node_io_read_bytes Bytes read since node start.
rabbitmq_node_io_read_bytes{node="rabbit@focker"} 1
# TYPE rabbitmq_node_io_read_microseconds gauge
# HELP rabbitmq_node_io_read_microseconds Total time of read operations.
rabbitmq_node_io_read_microseconds{node="rabbit@focker"} 10
...

Yes, this could be achieved in Prometheus, but spreading a node's identity into multiple places presents operational challenges that don't scale well. Ideally, every metric coming from an Erlang node will already be labelled with the Erlang node name.

It's OK to make this non-default & completely optional. If you are not completely against this idea, happy to attempt a PR. I have made a first attempt in rabbitmq/rabbitmq-prometheus@78703c7

Fix type spec hacks

Related #5, #8.

Full summary implementation

Now only basic variant of summary metric is implemented - with sum and count of observations.

What's left:

  • Quantiles;
  • Configurable sliding window

Prometheus summaries usually use highly biased quantile and since we deal with streaming data so they always implement the same algorithm from paper [0]. Example implementations: [1-3].

Sliding window seems to be implemented using N numbers of age-overlapped summaries maintained in parallel. Of course only 'top' one is rendered during scraping.

Due to the huge overhead maybe it's good idea to keep current simple implementation as an option?

References:
0. Effective Computation of Biased Quantiles over Data Streams

  1. Ruby Quantiles implementation
  2. Golang Quantiles implementation
  3. Common Lisp implementation
  4. Golang sliding window implementation

Recommend Projects

  • React photo React

    A declarative, efficient, and flexible JavaScript library for building user interfaces.

  • Vue.js photo Vue.js

    ๐Ÿ–– Vue.js is a progressive, incrementally-adoptable JavaScript framework for building UI on the web.

  • Typescript photo Typescript

    TypeScript is a superset of JavaScript that compiles to clean JavaScript output.

  • TensorFlow photo TensorFlow

    An Open Source Machine Learning Framework for Everyone

  • Django photo Django

    The Web framework for perfectionists with deadlines.

  • D3 photo D3

    Bring data to life with SVG, Canvas and HTML. ๐Ÿ“Š๐Ÿ“ˆ๐ŸŽ‰

Recommend Topics

  • javascript

    JavaScript (JS) is a lightweight interpreted programming language with first-class functions.

  • web

    Some thing interesting about web. New door for the world.

  • server

    A server is a program made to process requests and deliver data to clients.

  • Machine learning

    Machine learning is a way of modeling and interpreting data that allows a piece of software to respond intelligently.

  • Game

    Some thing interesting about game, make everyone happy.

Recommend Org

  • Facebook photo Facebook

    We are working to build community through open source technology. NB: members must have two-factor auth.

  • Microsoft photo Microsoft

    Open source projects and samples from Microsoft.

  • Google photo Google

    Google โค๏ธ Open Source for everyone.

  • D3 photo D3

    Data-Driven Documents codes.