
You can also find all 35 answers here 👉 Devinterview.io - Explainable AI
Explainable AI (XAI) refers to the set of strategies and techniques used to ensure that the results of AI systems are understandable, transparent, and explainable to humans. This transparency is especially crucial in fields where decisions can have significant repercussions: from medicine to finance and beyond.
- Legal and Ethical Considerations: Many jurisdictions require that decisions affecting individuals are explainable. GDPR, for example, includes a "right to explanation."
- Trust and Adoption: End-users and domain experts, such as doctors or judges, are more likely to trust and use AI systems if they understand their decisions.
- Fairness and Bias Mitigation: XAI can help uncover and address biases, ensuring AI systems make fair and impartial decisions.
- Identifying Errors and Assumptions: By making decision-making processes transparent, XAI makes it easier to identify erroneous or unjustified results.
- Mitigating Risks: In safety-critical applications, such as self-driving cars or medical diagnosis, it is necessary to understand why a system made a particular decision or prediction.
- Post Hoc Explanations: These methods aim to explain an AI system after the model has made a prediction. Examples include feature importance measures, such as SHAP values, and example-based explanations like LIME.
- Intrinsic Explanations: These techniques integrate interpretability directly into the model, enhancing transparency from the ground up. Decision trees are a classic example of a model that provides intrinsic interpretability.
- Credit Scoring and Finance: Traditional factors used in credit scoring models can inadvertently introduce bias. XAI can help ensure fair lending practices.
- Healthcare and Diagnosis: Understanding why and how a diagnosis is reached is crucial in healthcare. XAI can make medical diagnosis decisions more transparent and trustworthy.
- Regulatory Compliance: In sectors such as energy and finance, where complex regulations exist, companies can use XAI to ensure their models comply with regulatory requirements.
- Public Services: Government agencies employ AI in tasks like benefit or visa approvals. Ensuring these processes are explainable and unbiased is essential.
- Automotive Industry: Self-driving cars leveraging AI must make decisions in split-seconds. XAI helps to ensure these decisions are transparent and safe.
- Interpretability vs. Accuracy Trade-off: More interpretable models like decision trees often sacrifice some level of predictive accuracy.
- Complex Models: Techniques that provide interpretable output, such as LIME or SHAP, for sophisticated models like deep neural networks can be computationally intensive and challenging to understand.
- Temporal and Sequential Data: For time-series data, explaining predictions can be more complicated; for example, how does the system use older data in its predictions?
While the need for explainability is clear, it's essential to recognize the potential ethical pitfalls associated with AI systems. For example, the "right to explanation," as outlined in GDPR, can be challenging to fully satisfy, especially when using complex algorithms like neural networks.
Additionally, providing explanations could potentially lead to undesirable outcomes, such as users "gaming" the system once they understand its decision-making process. Uncovering these challenges and developing appropriate safeguards is an ongoing area of focus for ethical AI development.
As the field of XAI continues to evolve, it offers invaluable contributions in ensuring the responsible and ethical deployment of artificial intelligence.
In the context of Machine Learning, both interpretability and explainability focus on understanding the inner workings of models. However, they target different aspects of the modeling process.
These models are designed to be transparent and easily understood through human-readable decision rules or feature importance.
Examples of interpretable models include:
- Decision Trees: Construct a tree structure where each node represents a decision rule.
- Logistic Regression: Uses coefficients for features, which can be directly interpreted.
- Linear Models: Coefficients indicate feature importance and direction of impact.
- Ease of Understanding: Features and decision-making processes are clearly laid out.
- Trust and Reliability: Provides transparency and reduces the "black box" nature commonly associated with ML models.
- Regulatory Compliance: Ideal for domains with strict regulations and audit requirements.
These models use techniques to elucidate their predictions, offering insights into why a particular decision was made.
Examples of models with built-in explainability features include:
- Random Forest: Feature importance is calculated during training and can be used for interpretation.
- Support Vector Machines (SVM): Through the use of kernels, relationships among features are projected into higher-dimensional spaces for classification, which can be challenging to interpret; however, decision boundaries can often still be illustrated in lower dimensions with care.
- Gradient Boosting Machines (GBM): The model, often leveraging decision trees can be designed to calculate feature importance during each boosting iteration (tree construction step), yielding cumulative or 'per-iteration' ranking of feature significance.
- Rationalization of Predictions: Provides reasoning behind specific model predictions, which is valuable for debugging and gaining insights from the model behavior.
- Greater Flexibility: Offers a balance of performance and interpretability. Can be useful in scenarios where a purely interpretable model might not achieve the desired predictive accuracy.
While Explainable AI (XAI) has gained traction due to its potential to make AI more transparent and accountable, its adoption isn't without challenges.
-
Model Complexity: Complex models like deep neural networks can be challenging to interpret. Although methods like LIME and SHAP have been developed, there's still a gap in understanding complex models comprehensively.
-
Performance vs. Explainability Trade-off: Achieving high accuracy can sometimes conflict with the need for explainability. Striking a balance is often a challenging task.
-
Model-Agnostic Interpretability: While model-agnostic methods exist, they may not capture all nuances of a specific model type. This makes it challenging to ensure consistent interpretability across different models.
-
Distributed Data and Multi-party Training: In scenarios where data is spread across multiple locations or parties, ensuring explainability becomes intricate. Federated learning methods are a step forward but may come with their own set of challenges related to ensuring XAI.
-
Regulatory Compliance: Recent regulations such as GDPR emphasize the right to an explanation for automated decisions. Adhering to such regulations while maintaining model accuracy and utility is a complex balance to maintain.
-
Sensitive Data Handling: Models, especially in healthcare and finance, often deal with sensitive data. Ensuring that explanations derived from the model do not lead to potential privacy or security breaches is a significant challenge.
-
Temporal Model Explanation: In dynamic environments where data and model parameters change over time, providing consistent and up-to-date explanations can be a challenge.
-
Human Understandability: While some methods provide model-agnostic insights, translating them into human-understandable forms isn't always straightforward. The interpretability of assistance techniques is another area where clarity can be sought.
-
Merging Multiple Data Modalities: Some problems require the fusion of different types of data: e.g., text, images, and structured data. Developing unified and interpretable models for such datasets remains an active research area.
-
Inadequate Tools and Standards: The field of XAI is still emerging, and consolidated tools and standards are lacking. Building robust XAI pipelines may require a combination of domain expertise and tool mastery.
-
Subjectivity in Explanation: Interpretability is context-dependent. What might be a suitable explanation for one stakeholder may not be for another. Managing the inherent subjectivity of explanations is a non-trivial task.
-
Educational Barriers: The design and presentation of explanations to non-technical stakeholders, e.g., clinicians and end-users, is a challenge. It requires clear and actionable insights to ensure that stakeholders derive value from the AI system in question.
Explainable AI (XAI) plays a crucial role in applications where decisions can have significant consequences, especially in the domains of healthcare, finance, law, and overall decision-making processes that impact people's lives.
- GDPR and similar regulations mandate that individuals have a right to explanations for automated decisions in scenarios like credit scoring or job applications.
- Decision makers, particularly in sensitive domains, have an ethical responsibility to ensure fairness, non-discrimination, and make decisions that align with ethical norms.
- Transparent decision-making processes foster trust in both users, including healthcare providers and patients, as well as regulatory authorities and society at large.
- Healthcare: Accurate and transparent diagnoses are crucial for the well-being of patients.
- Finance: For fair and accountable credit scoring, risk assessment, and fraud detection.
- Law and Justice: In determining sentencing and parole, and in forensics.
- Ethically sensitive decisions: In areas such as hiring, admissions, and more.
- A deep learning model for diagnosing lung cancer on CT scans might use visual explanations, such as highlighting regions in the scan that led to a malignancy prediction.
- A model for predicting the risk of heart disease could provide reasons for its predictions in terms of key risk factors (e.g., high cholesterol, obesity, or family history).
- In recruitment, a model could be designed to ensure that it doesn't make discriminatory decisions based on gender, race, or other such sensitive factors.
- In credit scoring, the model can explain how it arrived at the credit score, which factors influenced the decision, and whether there were any negative flags.
- Feature Importance: Utilizes methods like permutation importance and SHAP values to rank features based on their influence on model predictions.
- Partial Dependence Plots: Visualize the relationship between specific input variables and model predictions while marginalizing over all other features.
- Local Explanations: Utilize techniques such as LIME, SHAP, and Individual Conditional Expectation (ICE) to explain individual predictions.
Several regulatory and advisory bodies provide guidelines and best practices to ensure that AI systems are transparent and interpretable.
- In the European Union, the General Data Protection Regulation (GDPR) pertains to the "right to explanation" for automated decision-making processes.
- The European Commission's High-Level Expert Group on Artificial Intelligence developed guidelines for trustworthy AI, which include the requirements for transparency, accountability, and the provision of explainable decisions.
- The US National Institute of Standards and Technology (NIST) published a document in 2019 titled "Explainable AI (XAI) for Public Safety Users."
Balancing accuracy and explainability in machine learning models often involves a trade-off; maximizing one may come at the cost of the other. Let's look at various aspects of this trade-off.
Model accuracy refers to the model's ability to make correct predictions.
Some models, such as Random Forests and Gradient Boosting Machines, are tailored for high accuracy and are known for their predictive power.
Model explainability focuses on the model's transparency and interpretability, allowing stakeholders to understand how and why it makes predictions. This is crucial for regulatory compliance, risk assessment, and overall human trust in machine learning systems.
- Accuracy: Feature importance is derived from the model's ability to make predictions, often using complex aggregations that boost prediction accuracy.
- Explainability: It doesn't translate easily to human-understandable narratives about why a feature is more or less important.
- Accuracy: Complex models can learn intricate patterns and relationships in the data, leading to better predictive accuracy, especially in high-dimensional or noisy datasets.
- Explainability: Interpreting complex models is challenging. The inner workings—like deep learning's multilayered networks—are less transparent, making model outputs hard to explain.
-
Accuracy and Explainability: Model predictions should be consistent and stable. If a model's predictions change drastically with minor changes in the input data, it's both less accurate and less reliable.
- Eg.: In healthcare, a model that predicts the likelihood of a patient having a disease should give consistent predictions even if a single, relevant attribute changes only slightly.
- Accuracy and Explainability: Both in-domain and out-of-domain predictions provide crucial insights.
-
In-domain predictions: Predictions within the domain the model was trained on.
-
Out-of-domain predictions: Predictions for data that falls outside the domain the model was trained on.
-
Eg.: A credit scoring model trained on historical data from older adults might not perform accurately on young adults who have different risk profiles.
-
A discussion on the domain should precede model selection, especially when a trade-off might benefit in- or out-of-domain predictions.
-
-
Model-agnostic methods in Explainable Artificial Intelligence (XAI) aim to interpret the behavior of any machine learning model, without relying on model-specific details.
- Global Explanations: Understands the model in its entirety.
- Local Explanations: Focuses on model predictions for individual instances.
- Flexibility: Applicable to various models.
- Transparency: Empowers stakeholders to comprehend model actions.
- Feature Importances: Identifies the most influential features. One common metric is Mean Decrease in Impurity (MDI) from Random Forest models.
- Partial Dependence Plots: Visualizes the effect of one or two features on predictions, while keeping other features constant.
- Individual Conditional Expectation (ICE) Plots: Provides unique prediction pathways for each instance.
- LIME (Local Interpretable Model-agnostic Explanations): Trains a local linear model to approximate the behavior of the underlying model.
- SHAP (SHapley Additive exPlanations): Uses cooperative game theory to fairly allocate the influence of each feature to a prediction.
Here is the Python code:
# Install SHAP
!pip install shap

import shap
import numpy as np
import pandas as pd
from sklearn.ensemble import RandomForestClassifier

# Create a toy dataset
data = pd.DataFrame({
    'f1': np.random.rand(100),
    'f2': np.random.binomial(1, 0.5, 100),
    'f3': np.random.normal(0, 1, 100)
})
target = pd.Series(np.random.binomial(1, 0.5, 100))

# Train a Random Forest model
model = RandomForestClassifier()
model.fit(data, target)

# SHAP Feature Importance plot
explainer = shap.Explainer(model, data)
shap_values = explainer.shap_values(data)
shap.summary_plot(shap_values, data, plot_type="bar")In the realm of Machine Learning explainability, two categories stand out:
- Model-specific techniques cater to the strengths of individual algorithms, capitalizing on their inherent interpretability.
- Model-agnostic methods, while sacrificing some granularity, provide a more unified and versatile means of explaining model decisions across different algorithms.
These methods are tailored to specific types of models:
-
Linear Regression: Characterized by feature coefficients, indicating their influence.
-
Decision Trees: Explainable since they directly encode the decision-making process.
-
SVMs: Boundary visualization aids in comprehendibility for binary classifications.
-
Neural Networks: Methods like LRP (Layer-wise Relevance Propagation) can highlight the contribution of individual neurons.
These approaches serve as a bridge across various model types, allowing for generalized explainability:
-
Local Surrogate Models: By training a simpler, interpretable model in the vicinity of a prediction point, it offers context-specific insights.
-
Permutation Feature Importance: Dat afeatures are permutated, and the change in prediction accuracy indicates their importance.
-
Partial Dependence Plots: Pinpoint the effect of a feature on model predictions while controlling for other variables.
-
SHAP Values: Combines feature attributions from a baseline model with model output to discern feature impact.
8. What are the advantages and disadvantages of using LIME (Local Interpretable Model-Agnostic Explanations)?
LIME (Local Interpretable Model-Agnostic Explanations) is a technique that provides transparency to black-box models by offering local-level interpretability.
- Model Agnostic: LIME is not limited to any specific type of model, making it universally applicable.
- Local Interpretability: It focuses on explaining individual predictions, which can be beneficial in various scenarios, such as refining specific misclassifications.
- Simplicity and Intuitiveness: LIME provides easy-to-understand explanations by presenting the most influential features for a particular prediction.
- Easy Implementation: The modular and straightforward structure of LIME makes it easy to integrate with different models and datasets.
- Reduced Risk of Bias Amplification: LIME's local explanations lower the chances of reinforcing existing biases in the dataset, which is particularly crucial in ethical ML applications.
- High Computational Overhead: Generating local explanations for LIME can be time-consuming, especially for large, high-dimensional datasets. The mechanism that drives LIME, in its underlying form, is NP-Hard.
- Sample Dependency: LIME explanations can vary based on the sampled data, leading to inconsistencies and potential unreliability.
- Tunable Parameters: The choice of hyperparameters can significantly affect the interpretability of LIME and might require careful tuning.
- Interpretability Depth: The explanations provided by LIME are limited in terms of depth and might not capture intricate interactions among features.
Here is the Python code:
# Load Dataset
from sklearn.datasets import load_iris
data = load_iris()
X = data.data
y = data.target

# Split the Data
from sklearn.model_selection import train_test_split
X_train, X_test, y_train, y_test = train_test_split(X, y, test_size=0.2, random_state=42)

# Train a Classifier
from sklearn.ensemble import RandomForestClassifier
rf = RandomForestClassifier(n_estimators=100, random_state=42)
rf.fit(X_train, y_train)

# Use LIME for Interpretability
import lime
import lime.lime_tabular
explainer = lime.lime_tabular.LimeTabularExplainer(X_train, mode='regression', training_labels=y_train, feature_names=data.feature_names)
explanation = explainer.explain_instance(X_test[0], rf.predict_proba, num_features=2)
explanation.show_in_notebook()SHAP (Shapley Additive exPlanations) is a game-theoretic approach to explain the output of any machine learning model. It's grounded in cooperative game theory and the Shapley value concept, which aims to fairly distribute the marginal contribution of each player in the game.
-
Shapley Value: In game theory, it represents a player's contribution to a coalition, considering all possible combinations in a fair way.
-
Local Interpretable Model-agnostic Explanations (LIME): While also offering explanations, LIME constructs simpler, locally accurate models to approximate the original model's predictions.
-
Individual Conditional Expectation (ICE) Plot: Visualizes how the predicted outcome changes when altering the input variable of interest, keeping other variables constant.
-
Ensemble Nature: SHAP is based on building a wide ensemble of models where each model leaves out a different subset of features.
-
Model-Agnostic: It's compatible with any machine learning model.
-
Local and Global Interpretability: Provides both local and global explanations.
-
Feature Importance: SHAP aids in feature selection by quantifying each feature's contribution to the model's predictions.
-
Fairness Assessment: It can identify any biases in the model, helping to ensure fair and ethical decision-making.
-
Model Debugging: By providing transparent, feature-level insights, SHAP assists in identifying model flaws.
-
Real-time Decision Support: Its ability to offer localized explanations is crucial for systems needing real-time decisions.
-
Regulatory Compliance and Trustworthiness: Explainable models are fundamental, especially in sectors subject to regulatory standards.
-
Clinical Decision Support: SHAP is valuable in healthcare solutions by explaining diagnostic and prognostic predictions.
Feature Importance helps identify key predictors in a machine learning model. It is especially valuable for interpreting model behavior and understanding which features carry the most significance in making predictions.
- Statistical Methods: Techniques such as t-tests or ANOVA can determine feature importance based on statistical measures like p-values.
- Model Performance Metrics: Using metrics like R-squared or accuracy to assess the impact of excluding a feature.
- Expert Opinion or Business Knowledge: Domain experts can provide insights into which features to prioritize.
One way of visualizing this is by using a bar chart. Here is the Python code for your visualisation:
import matplotlib.pyplot as plt

# Features and their respective importances
features = ['Feature A', 'Feature B', 'Feature C', 'Feature D']
importances = [0.2, 0.3, 0.1, 0.4]

# Create bar chart
plt.bar(features, importances)
plt.title('Feature Importances')
plt.xlabel('Features')
plt.ylabel('Importance')
plt.show()- Scikit-learn: Provides built-in methods like
RFE(Recursive Feature Elimination) andSelectKBestfor feature selection. - XGBoost: Using the
plot_importancefunction allows direct visualization of feature importance. - ELI5: A library that is not model-specific and provides methods like
permutation_importance.
- Linear Regression: Coefficients directly reflect feature importance.
- Logistic Regression: Coefficients can be exponentiated to interpret as odds ratios.
- Decision Trees: At each split, the impurity reduction from the feature is a measure of its importance.
- Ensemble Methods (e.g., Random Forest): The average impurity decrease across all trees establishes feature importance.
- DNNs: Investigating feature importance is more complex due to the network's non-linear nature. However, techniques like LIME or SHAP can still provide insights.
- Interpretability: Helps understand the "black box" of complex models.
- Model Improvement: Guides feature selection and potentially enhances model performance.
- Sparse Data: Can misguide importance measures if certain features are infrequently observed.
- Multicollinearity: Fails to distinguish between correlated features that contribute similarly to the target. understanding not only that a prediction is positive or negative but also, more crucially, why the model made that specific prediction.
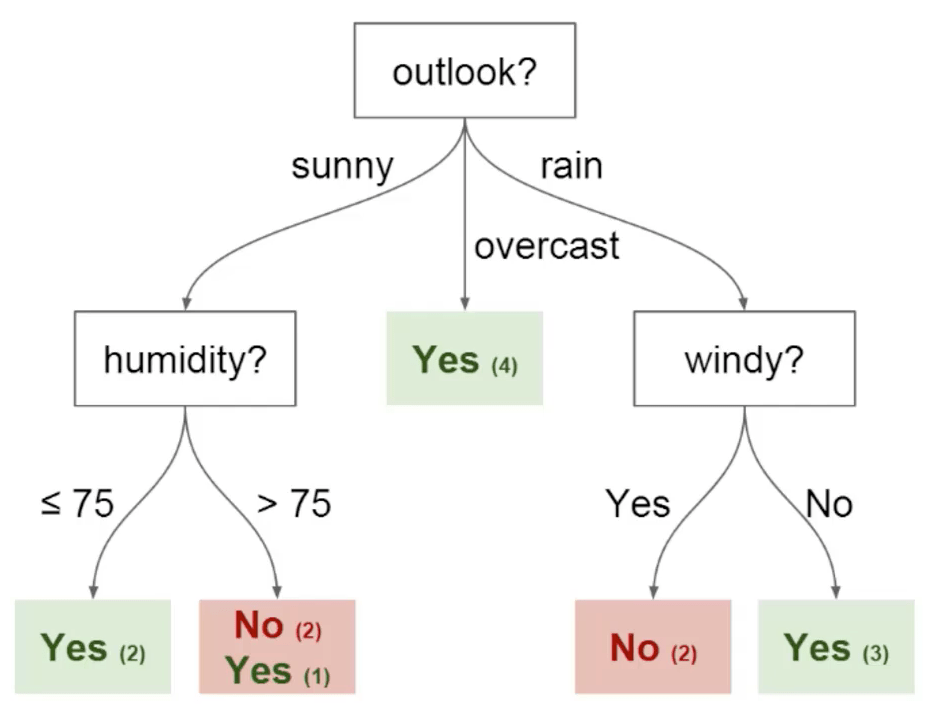
Decision Trees are a type of interpretable machine learning model that use a tree-like structure for decision making. Each internal node represents a test on an attribute, each branch represents an outcome of the test, and each leaf node represents a class label or target value.
- Root Node: Represents the entire dataset and selects the best attribute to classify the data.
- Interior Nodes (Split Nodes): Used to segment data based on attribute testing.
- Leaf Nodes: Terminal nodes that represent the output, typically a class label or a continuous value.
The tree structure consists of test nodes (recorded as strings, integers, or real numbers) and decision nodes (representing the attribute to split on).
Here is the Python code:
-
Logical Representation
- Dataset: Simple restaurant selection based on weather, guest count, and whether reservations are made.
(Weather, Count, Reservation) => Decision => Recommendation (Sunny, 8, No) => Yes => Yes (Sunny, 8, Yes) => No => No -
Visual Representation: Decision Tree
(Weather, Count, Reservation) => Decision => Recommendation ├── Sunny, 8, No (Yes) └── Sunny, 8, Yes (No) -
Complete Python Code
Here is the Python code:
from sklearn import tree

# Define the dataset
features = [[0, 8, 0], [0, 8, 1]]  # Weather: 0 (Sunny), Count: 8, Reservation: 0 (No) or 1 (Yes)
labels =  [1, 0]  # 1 (Yes - Good), 0 (No - Bad)

# Train the decision tree classifier
clf = tree.DecisionTreeClassifier()
clf = clf.fit(features, labels)

# Visualize the tree with Graphviz
import graphviz
dot_data = tree.export_graphviz(clf, out_file=None)
graph = graphviz.Source(dot_data)
graph.render("restaurant")
graph
In the context of a linear model, coefficients are often derived through Ordinary Least Squares (OLS) to find the line that best fits the data points. Once computed, these coefficients offer insights about the nature and strength of relationships between input features and the output.
-
Positive/Negative Values: Indicate whether an increase in the feature makes the output go up or down.
-
Absolute Magnitude: Measures the importance of a feature. The larger the coefficient, the more significant the feature's influence on the target variable.
-
Relative Magnitudes: Compares the influence of different features. For example, a feature with a coefficient of 2.5 has 2.5 times the effect on the target as a feature with a coefficient of 1.
The coefficients reflect the unit change in the target variable attributed to a one-unit change in the respective feature, assuming all other variables remain constant. For example, If weight has a coefficient of 2, it means with a one-unit increase in weight, the target (e.g., blood pressure) increases by 2 (e.g., mm of Hg).
Interpretation of coefficients in logistic regression involves the log-odds of a one-unit change in the predictor. These log-odds can be converted to probabilities if needed.
- A coefficient of 0.5 for a variable means that a one-unit change in the predictor increases the log-odds of the response by 0.5.
Regularization techniques like Lasso (L1) and Ridge (L2) can alter the interpretability of coefficients.
-
Ridge: Tends to shrink coefficients. While their relative relationship with the target may remain, the precise effects of predictors become less straightforward.
-
Lasso: Can be used for feature selection as it might zero out coefficients of less influential features.
Here is the Python code:
from sklearn.linear_model import LogisticRegression

# Assuming feature_scores is a 1D array of coefficients, and feature_names is a list of corresponding feature names
model = LogisticRegression()
model.fit(X, y)

# Print the coefficients alongside corresponding feature names
for feature, coefficient in zip(feature_names, model.coef_.flatten()):
    print(f"{feature}: {coefficient}")

# Assuming all features are binary-encoded, impacting a response y.
# From the logistic regression model, let's assume the following:
#    feature_scores = [0.5, 0.8, -1.2, 2.9, 0.3]
#    feature_names = ['A', 'B', 'C', 'D', 'E']
# Interpretation:
# A one-unit increase in A results in a 0.5 increase in the log-odds of y.
# Similarly, for B, a one-unit increase leads to a 0.8 increase in the log-odds of y.
# However, for D, a one-unit increase leads to a 2.9 increase in the log-odds of y.
# The negative coefficient for C suggests a one-unit increase in C reduces the log-odds of y.
# The relatively small coefficient for E (0.3) implies a lesser effect on the log-odds of y compared to features with larger coefficients.Partial Dependence Plots (PDPs) offer a powerful visual tool for understanding the relationship between target and feature variables in machine learning models. They are particularly useful for identifying and visualizing non-linear relationships.
PDPs are especially beneficial for data scientists, stakeholders, and clients with sufficient statistical knowledge. They may also aid in guiding domain-experts through the intricacies of model predictions.
PDPs are suited for structured numerical data with clear target and feature distinctions. They are not intended for univariate or static feature analysis.
PDPs align well with any supervised learning model type, particularly those used in classification or regression tasks.
- Independent Samples: PDPs assume independent data samples for accurate interpretation.
- Feature Independence: Each feature's influence should be considered in isolation during interpretation to ensure insights are feature-specific.
PDPs are visualized as 2D grids or line graphs. These representations underscore the feature (or set of features) being analyzed and its relationship with the target variable.
PDPs can assist in:
- Feature Selection: Identifying non-informative or redundant features.
- Model Understanding: Uncovering complex relationships between features and the target, particularly in non-linear models.
- Biological Studies: Offering insights into effects of compounds on biological systems.
- Credit Scoring: Assessing risk components.
- Telemetry Data Analysis: Understanding sensor behavior and its impact on outcomes.
- Data Slicing: The linearity assumption during individual feature interpretation can affect multi-feature relationships.
- High Computations: Evaluating individual feature effects on predictions requires multiple model runs, which can be computationally intensive. For this reason, other approaches such as the Accumulated Local Effects (ALE) method, which also visualizes marginal effects, have been proposed to overcome these limitations.
Counterfactual Explanations in the context of Explainable AI (XAI) provide interpreted insight by creating what-if scenarios.
They offer a simplified narrative of the model's decisions by formulating the question, "What changes in the input would have resulted in a different outcome?"
Counterfactual explanations specify the desired outcome along with the input features to adjust, making them tailored to specific predictions.
To be valid, Counterfactual Explanations must align with real-world constraints, avoiding impractical or unrealizable changes.
For example, if the AI is making a loan approval decision, the counterfactual explanation shouldn't suggest making changes that would lead to illegal discrimination or violate other legal or ethical considerations.
Counterfactual explanations are flexible; they can involve adjustments to both numerical and categorical variables. This provides a versatile understanding of the model's decision-making process.
Ideally, counterfactuals should strive for Pareto optimality by showing minimal changes leading to the desired outcome. This minimizes the "cost" associated with implementing the changes in the real world.
-
Healthcare: A doctor using an AI-based diagnostic tool might need to confirm how specific symptoms influence the diagnosis and treatment plan suggested by the model.
-
Finance: A loan officer could assess what modifications in financial behavior or status might impact the loan decision.
-
E-Commerce: An online marketplace can provide explanations of why a specific product was recommended over others, guiding the user to make more informed choices.
Counterfactual Explanations place special emphasis on preserving the fairness, justice, and non-discrimination objectives, directly addressing the AI transparency and accountability principles.
Activation Maximization leverages neural networks to gain insights on what inputs lead to particular neuron activations. This technique helps uncover visual patterns encoded by neural network units, boosting model interpretability.
-
Initial State: Start with a random or pre-selected input image.
-
Neuron Targeting: Choose the neuron or layer output to visualize. This guides the image transformation process.
-
Gradient Descent: Adjust the input image to maximize the chosen neuron's activation. This is done by following the gradient of the neuron's output with respect to the image's pixel values.
-
Visualization: Observe the evolving image, aiming to highlight dataset features that most strongly activate the target neuron.
The goal of Activation Maximization is to find an input image that maximizes the activation of a specific neuron or layer. The process involves iteratively updating the input image in the direction that increases the target neuron's activation.
Where:
-
$\text{Updated Image}$ and$\text{Original Image}$ are the current and previous versions of the input image. -
$\epsilon$ is a small step size. -
$\nabla_{\text{Input}}\text{Activation}$ is the gradient of the target neuron's activation with respect to the input image.
By default, the algorithm seeks a positive maximum activation, making it suitable for exploring what features excite the neuron.
In scenarios where the goal is to minimize activation (e.g., for feature suppression), the input update follows a similar approach with a negative gradient direction.
Explore all 35 answers here 👉 Devinterview.io - Explainable AI


