- Codebase
- Introduction
- Research Questions
- Data Sources
- Solution Architecture
- DAGs
- Lightdash Visualizations
- Task Assignment
- Discussions
- Appedices and References
The code-snippets folder contains SQL code that was used to build essential objects like stages. integrations, and tables. The snippets are categorised neatly in sub-directories with self-explanatory names.
This folder contains screenshots of connections in the Airbyte.
This is the main directory of the project. It houses all the airflow DAGs and the dbt projects.
Keyword frequency is defined as how often a keyword appears in a given piece of text or content. It is considered in efforts such as Search Engine Optimsation (SEO) and digital marketing.
Sentiment analysis refers a process that seeks to computationally categorise the opinion expressed in a piece of text to learn the writer's attitude towards a particular subject. Generally, categories considered are positive, negative, and neutral.
The goal of the project was to design and a build a reliable data pipeline for the data science consultancy company, PRO Inc. The development of the pipeline was the key to answering some research questions. The owners - Rashid and Paul, allowed a period of three weeks to complete the project.
The research questions categorised by data source are listed below.
- Keyword frequency analysis: How often do data practicioners mention cloud data warehouses and which ones? How often and since when do they mention data space trends such as "data mesh" and "data vault"?
- Sentiment analysis with regard to data warehouse tools
- How much activity there is in each of the repositories (counted by, for example trendline for no. of commits in the repository)
- What languages are mainly used in the each of the repos (Python vs. SQL vs. Java etc)
- Top contributors in the repos?
- Many contributors, few commits vs. few contributors, many commits?
- Location of users etc.
Several data sources were considered however upon careful consideration, we decided to extract the textual data from GitHub and Twitter. GitHub and Twitter provide arguably reliable REST API endpoints that can be used to query data. Helpful resources on how to get started with these endpoints are provided in Appendix A. Additionally, the data will be useful for anyone that is interested in trends in the data space, including data practitioners and investors.
We have extracted the tweets from various data influencers and people who are part of Data Twitter as it's sometimes called colloquially. The list of Twitter users was scraped from Twitter handles featured in the Data Creators Club site by Mehdi Ouazza, to which other influencers active in the data space were added manually. The list can be found in data-orchestration/dags/user_data/users.txt.
The dataset includes the GitHub repos of 6 prominent open-source data orchestration tools:
- Airflow
- Dagster
- Prefect
- Argo
- Luigi
- Orchesto
Both the GitHub and Twitter datasets were transformed to make the data easily accessible. As Twitter data was ingested from JSON files in S3 buckets, the content of the files was flattened such that each row in the target table corresponds to a tweet. For each row, the username of the user who published the tweet was appended in an extra column, which was populated via the username substring available in the ingested filenames. The code used for Snowpipe this transformation can be seen in this folder.

Pipeline orchestration was performed with Apache Airflow. Airflow was run on a t2.large EC2 instance using docker-compose. The original airflow image had to be extended to include dbt in a separate virtual environment. The Dockerfile used can be found in the data-orchestration directory.
Airbyte was used as the data integration tool for the ingestion process. It was selected because it's open source and it's gaining a lot of traction in the data space. Airbyte was used to extract github repo activity data however, a custom python script was developed to extract the tweets of the selected twitter users. The python script can be found in data-orchestration/dags/tweets_dag/extract_tweets_pipeline.py.
Our backfill of twitter data started in 2012 - we had about 10 years worth of tweets from requested users. The python script was run daily for about 2 weeks due to the API throttling limits. Thus, if tweets for a particular user were not successfully extracted today, it'll probably be extracted on the next day and so on. This meant that there would be some duplicates in the data. However, deduplication was not a problem since every tweet had a unique identifier. The results of the twitter calls were stored in S3 in JSON format. We used snowpipe as a sensor to sense and ingest any changes in the twitter data files.
API limits were repeatedly exceeded on a single github token so we tried to "load balance" API calls on 3 separate github tokens, created by each member of the team. This streamlined the ingestion process but it was by no means a permanent fix. After a few replications, we noticed that we had exceeded our limits again. We continued to work on previously ingested data while we waited for the limits to reset.

dbt is then used to transform the ingested data into usable business conformed models.
Lightdash was used in the semantic layer of our pipeline. We chose lightdash but it integrates seamlessly with dbt and it was very trivial set up.
Replication with Airbyte was performed on a daily basis.
API limits were perpetually exceeded on a single github token so we tried to "load balance" API calls on 3 separate github tokens, created by each member of the team. This streamlined the ingestion process but it was by no means a permanent fix like we thought it would be. After a few replications, we noticed that we had exceeded our limits again.
However, we continued work on the data we had ingested prior. Most of the data transformations were performed using dbt by Paul Hallaste. We utilised some conventional best practices in the naming of our models and folder structure. We found that this guide was very helpful. We learned how modularise our SQL code in a way that scales, how to test models, and lastly some unique considerations like using a base folder to house models that'll be joined in the stage.
dbt was used to transform the ingested data into usable business conformed models. We utilised some conventional best practices in the naming of our models, folder structure, and model development. We utilised the teachings of a great guide. We learned how to modularise our SQL code in a way that scales, how to test models, and lastly some unique considerations like using a base folder to house models that'll be joined in the stage.
Lightdash was used in the semantic layer of our pipeline. We chose lightdash because it integrates seamlessly with dbt and it was very trivial to set up.
We created three dags for our pipeline:
-
extract_tweets:
Directory:
data-orchestration/dags/tweets_dag
Figure 1: Twitter DAG
The
extract_tweetsDAG was used to perform ELT on the twitter data. It was made up of 7 tasks as shown in the figure 1 above. A DAG run starts by alerting the team in Slack that it's about to start. It then triggers the python script to start the tweet data extraction. If the extraction is successful, we build the raw tweet tables with thedata_community_inputdbt project. The task is skipped if the upstream task fails. Thedbt_freshnesstask checks the freshness of the preprocessed tweet data. It is only triggered if all the upstream tasks succeeded. If the last update of the source was at least 2 days ago, this task fails otherwise, it passes. Thetwitter_dbt_runtask performs another transformation on the preprocessed data for visualisation. If no upstream tasks failed then thetwitter_extracts_endtask is triggered. It sends a message to the team about a successful run, otherwise, this task is skipped and thetwitter_extracts_failtask notifies the team of the DAG failure.In the figure 1 above, the DAG failed because we exceeded our monthly API limit for twitter.
-
extract_github_data
Directory:
data-orchestration/dags/github_dag
Figure 2: GitHub DAG
The
extract_github_dataDAG was used to perform ELT on the github repo data. The DAG starts by notifying the team about its start. Subsequently, a replication job in airbyte is triggered with thetrigger_synctask. If it succeeds, thesucceed_github_extractiontask is triggered. It notifies the team about the successful completion of the replication. However if thetrigger_synctask fails, thesucceed_github_extractiontask is skipped andfail_github_extractiontask is triggered. This task notifies the team about the unsuccessful replication of the github data in our snowflake database. Lastly, a watcher task observes each task and is triggered when any of the tasks fails.
-
serve_docs
Directory:
data-orchestration/dags/dbt_docs_dag
Figure 3: Serve dbt Documentation DAG
This DAG updates the dbt documentation website daily. A DAG run begins by notifying the team about its start. The
dbt_docs_generatetask generates the dbt documentation files in thetargetfolder of the dbt project.push_docs_to_s3is a python task that pushes the files to an S3 bucket withboto3. Thedocs_update_succeededtask is only triggered if the upload to s3 was successful. Thedocs_update_failedtask is skipped if the upload to S3 was a success. Thewatcheris only triggered if any of the upstream tasks failed. The dbt documentation site is public and can be found here.
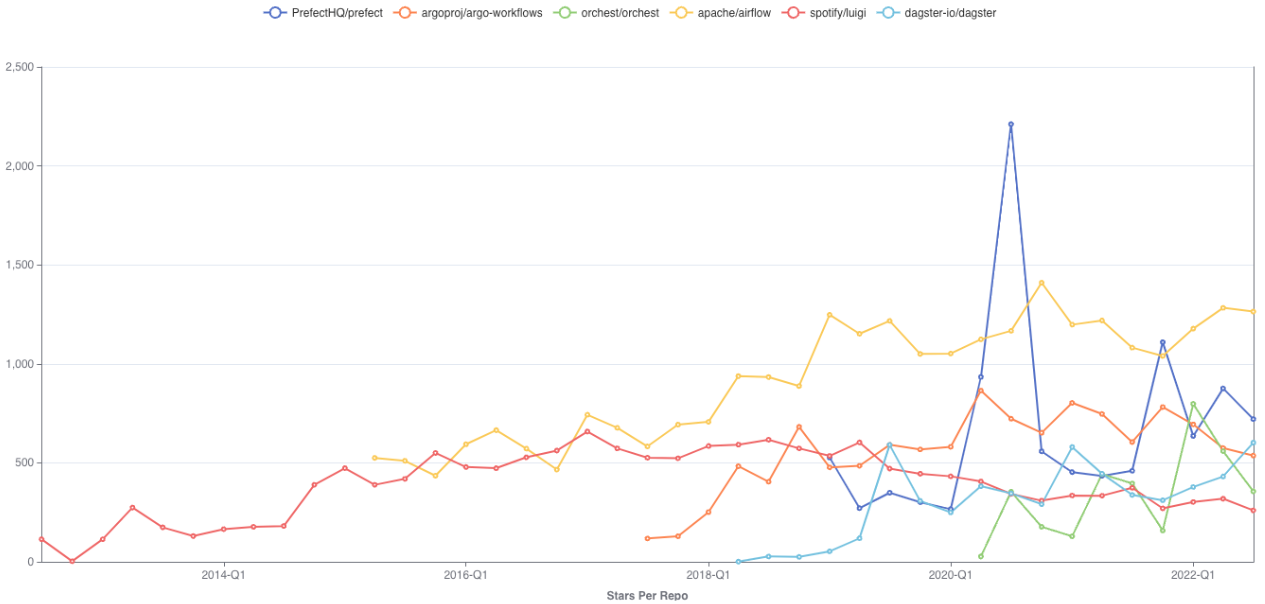
Stars Per Repo - Quarterly: Airflow and Prefect in particular are rising, the latter with a conspicuous spike in Aug 2020. Luigi is the earliest one and is still starred regularly (although less than its competitors)
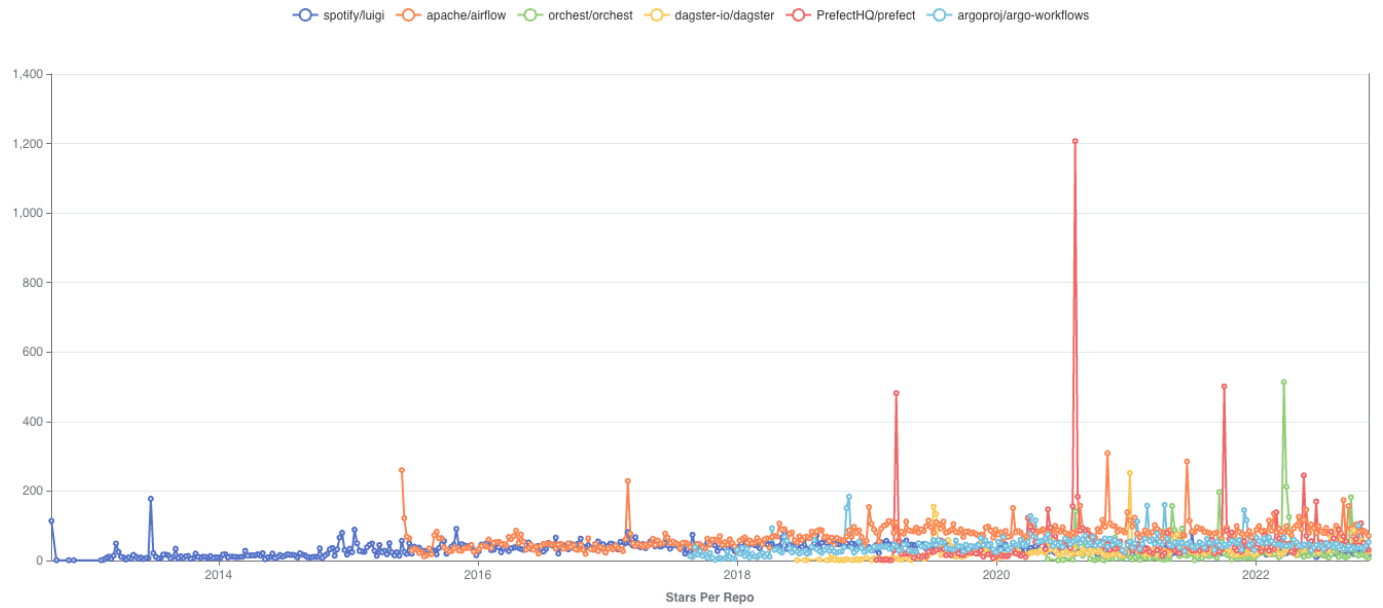
Stars Per Repo - Daily: Prefect spike on Aug 8th 2020 coincides with the launch of Prefect Server and UI
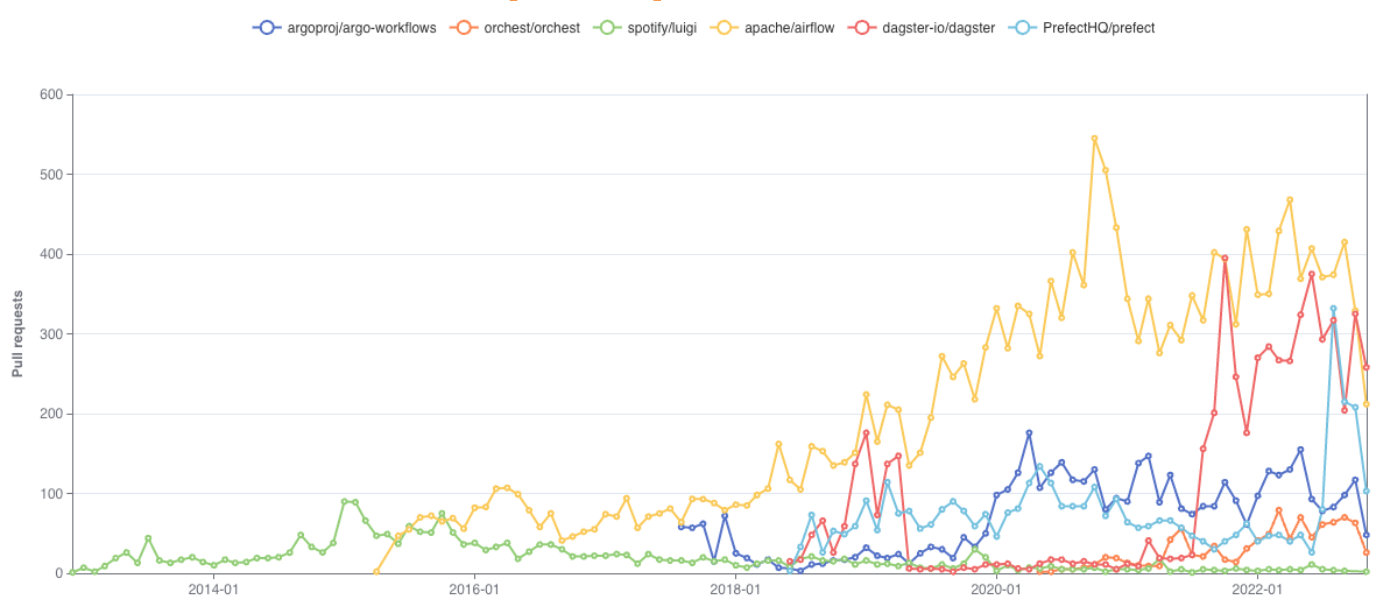
PRs Per Repo - Monthly: Airflow has the most PRs/month, followed by Dagster. Dagster has a gap between mid 2019 and late 2021, followed by a rapid rise in PRs. Potentially relevantly, in Nov 2021, Dagster announced their series A funding and the launch of Elementl
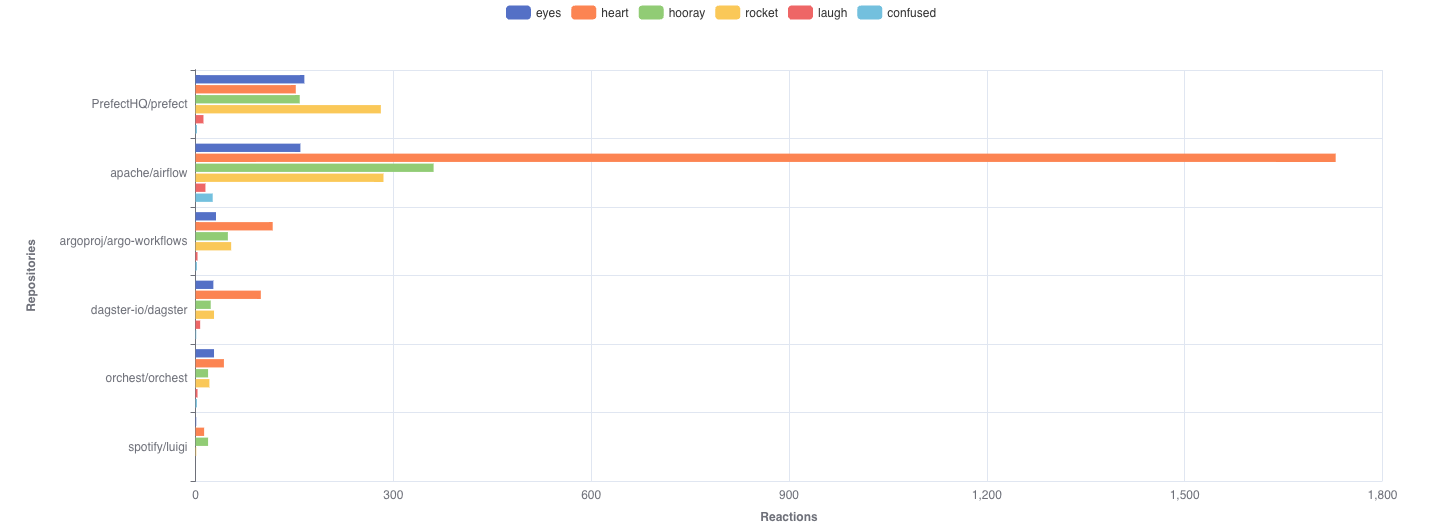
PR Reactions Per Repo: Airflow contributors are a hearty bunch. Prefect contributors like the rocket emoji. Luigi contributors are seemingly outwardly stoic, using little reactions at all.
| Pipeline Stage | Member Responsible |
|---|---|
| Ingestion | Rashid Mohammed |
| Transformation and Quality Tests | Paul Hallaste |
Project management - task assignment - was managed using Notion. The entire project Kanban can be found here. Project meetings were held on a weekly basis to:
- Make sure team members were on schedule
- Reschedule tasks were necessary
- Share knowledge

GitHub was used to collaboratively work on this project. See Figure 4 below for some of our merge requests.

Figure 4: GitHub collaboration
Towards the end of the project, we tried to implement CI/CD in our pipeline. The services we considered were CodeDeploy and GitHub Actions. We were able to run integration tests however we failed to deploy the project to our EC2 instance. We ended up creating a cronjob that updates the repo in production every minute. The main con of this approach is config files like profiles.yml and .env have to uploaded to the production server manually every time a change is required. We understand that this does not scale so in our future work, we plan to implement the full CI/CD workflow.
Conventional usage of dbt preaches the use of staging tables as mirrors of the source. According to the guide in Appendix B, the most standard types of staging model transformations are:
- Renaming
- Type casting
- Basic computations (e.g. with macros, sql functions, etc)
- Categorisations (e.g. with case statements)
Joining challenges the aforementioned pattern. This is because the aim of staging is to prepare and clean source conformed models for downstream usage. Essentially, staging prepares the most useful version of the source system, which we can use as a new modular component for the dbt project. However, there are certain instances where a join is inevitable. In our example, we needed to find the last time our twitter data was updated using snowpipe to check source freshness. Unfortunately, adding a current_timestamp column is moot because load times inserted using current_timestamp are earlier than the load_time values in the COPY_HISTORY view (the actual load time). See Appendix C for a full read.
The only way to get the load_time values was join on the COPY_HISTORY table view. You can find this unconventional pattern in data-orchestration/dags/dbt/data_community_input.
The dbt documentation site can be improved.
We could have leveraged tools like LocalStack to emulate the AWS services for testing.
Few connections were created in this project but as the airbyte connections grow, it'll be better to leverage the capabilities of the Octavia CLI.
https://docs.github.com/en/rest/guides/getting-started-with-the-rest-api
https://developer.twitter.com/en/docs/twitter-api/getting-started/getting-access-to-the-twitter-api
https://docs.getdbt.com/guides/best-practices/how-we-structure/2-staging


