


Quickly create and customise thematic web maps based on NUTS regions, showing Eurostat data directly retrieved from the Eurostat database.
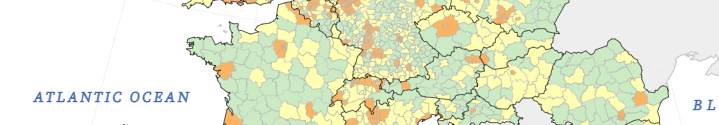
- Population density (see the code)
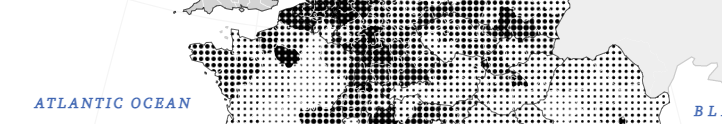
- Population density map with dot pattern (see the code)
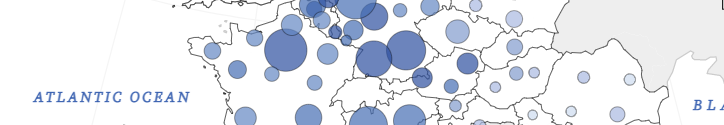
- Population map with proportional circles (see the code)
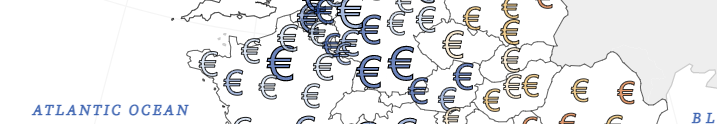
- GDP map with custom proportional symbols (see the code)
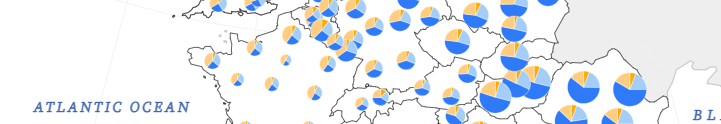
- Causes of death with proportional pie charts (see the code)
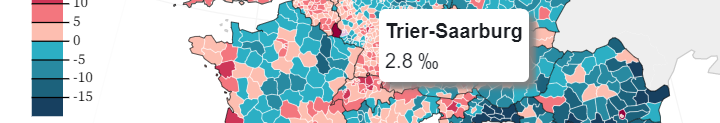
- Population change (see the code)
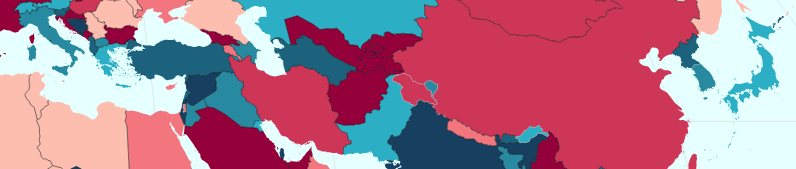
- NUTS typology as a categorical map (see the code)
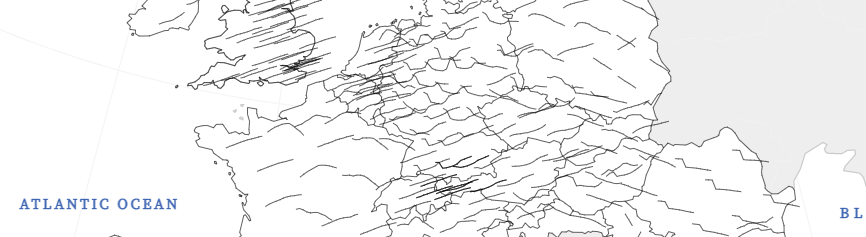
- Focus on Spain (see the code)
- 20 years of GDP change in Europe (see the code)
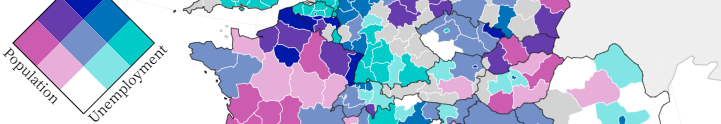
- Unemployment/population relation (see the code)
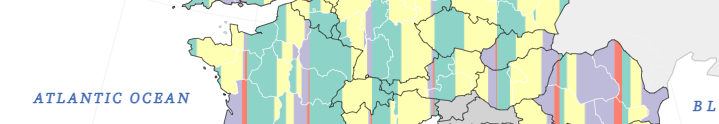
- Farm sizes composition (see the code)
- Livestock composition (see the code)
- Sparklines: Population in Europe since 2012 (see the code)
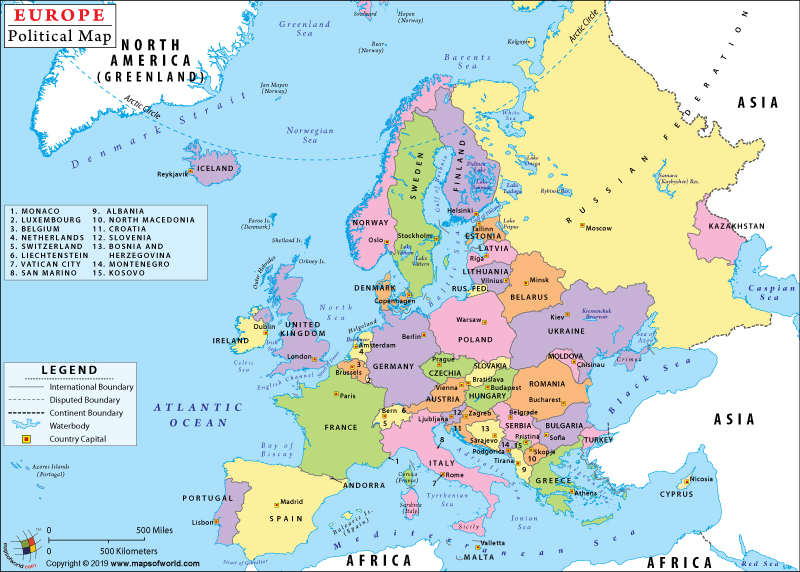
- World map (see the code)
- Node.js: With
npm install eurostatmapand theneurostatmap = require("eurostatmap"). - Standalone: For the latest version, use
<script src="https://unpkg.com/eurostat-map"></script>as shown in the examples. For a fixed version, use<script src="https://unpkg.com/[email protected]"></script>, where X.Y.Z is a version number among these ones.
See the API reference:
- For a choropleth map,
- For a proportional symbol map,
- For a proportional pie chart map,
- For a categorical map.
- For a bivariate choropleth map.
- For a stripe composition map.
- For a sparkline map.
Anything unclear or missing? Feel free to ask !
Maps based on NUTS regions rely on Nuts2json API and TopoJSON format. Statistical data are accessed using Eurostat REST webservice for JSON-stat data. The data are decoded and queried using JSON-stat library. Maps are rendered as SVG maps using D3.js library.
| contributors | |
| version | See npm |
| status | Since 2018 |
| license | EUPL 1.2 |
Feel free to ask support, fork the project or simply star it (it's always a pleasure).
The Eurostat NUTS dataset is copyrighted. There are specific provisions for the usage of this dataset which must be respected. The usage of these data is subject to their acceptance. See the Eurostat-GISCO website for more information.
The designations employed and the presentation of material on these maps do not imply the expression of any opinion whatsoever on the part of the European Union concerning the legal status of any country, territory, city or area or of its authorities, or concerning the delimitation of its frontiers or boundaries. Kosovo*: This designation is without prejudice to positions on status, and is in line with UNSCR 1244/1999 and the ICJ Opinion on the Kosovo declaration of independence. Palestine*: This designation shall not be construed as recognition of a State of Palestine and is without prejudice to the individual positions of the Member States on this issue.
![dependabot[bot] avatar](https://avatars.githubusercontent.com/in/29110?v=4 "dependabot[bot]")


