Comments (4)
 Tony-009
commented on May 2, 2024
1
Tony-009
commented on May 2, 2024
1
Okay! Yes, that makes sense. I was also looking to see how the mean_spend and mean_reponse were calculated? because that will provide a point of reference(initial attributed conversions) which can be compared with the budget allocator optimised conversion/sales for the future weeks. Appreciate the help!
from robyn.
 gufengzhou
commented on May 2, 2024
1
gufengzhou
commented on May 2, 2024
1
mean_spend is the mean of all non-zero periods within modelling window. for example, if you have 365 days of data and a new channel is only active since 30 days, then the mean_spend for this channel will be the mean of the 30 days. mean_response is bit more complicated. if it's spend representing the channel, then the pseudo-code is mean_response = hill_function(mean_spend)*ridge_beta_coef. If it's exposure representing the channel, then pseudo-code is mean_response = hill_function(reverse_michaelis_menten(mean_spend))*ridge_beta_coef. Basically, the mean_spend has to go through all transformation to get to mean_response. In the current .func script, it's row 1771- 1839. hope it helps.
from robyn.
Tony-009
commented on May 2, 2024
1
Okay! Thanks for the in-depth response. This is exactly what I was looking for because something wasn't adding when I was looking at the code and trying to understand the mean_response. Anyways, Appreciate the time and help:-)
from robyn.
gufengzhou
commented on May 2, 2024
hey, first of all, there's been a bug introduced by the sorting issue from the data.table library that is fixed just now. please use the latest update.
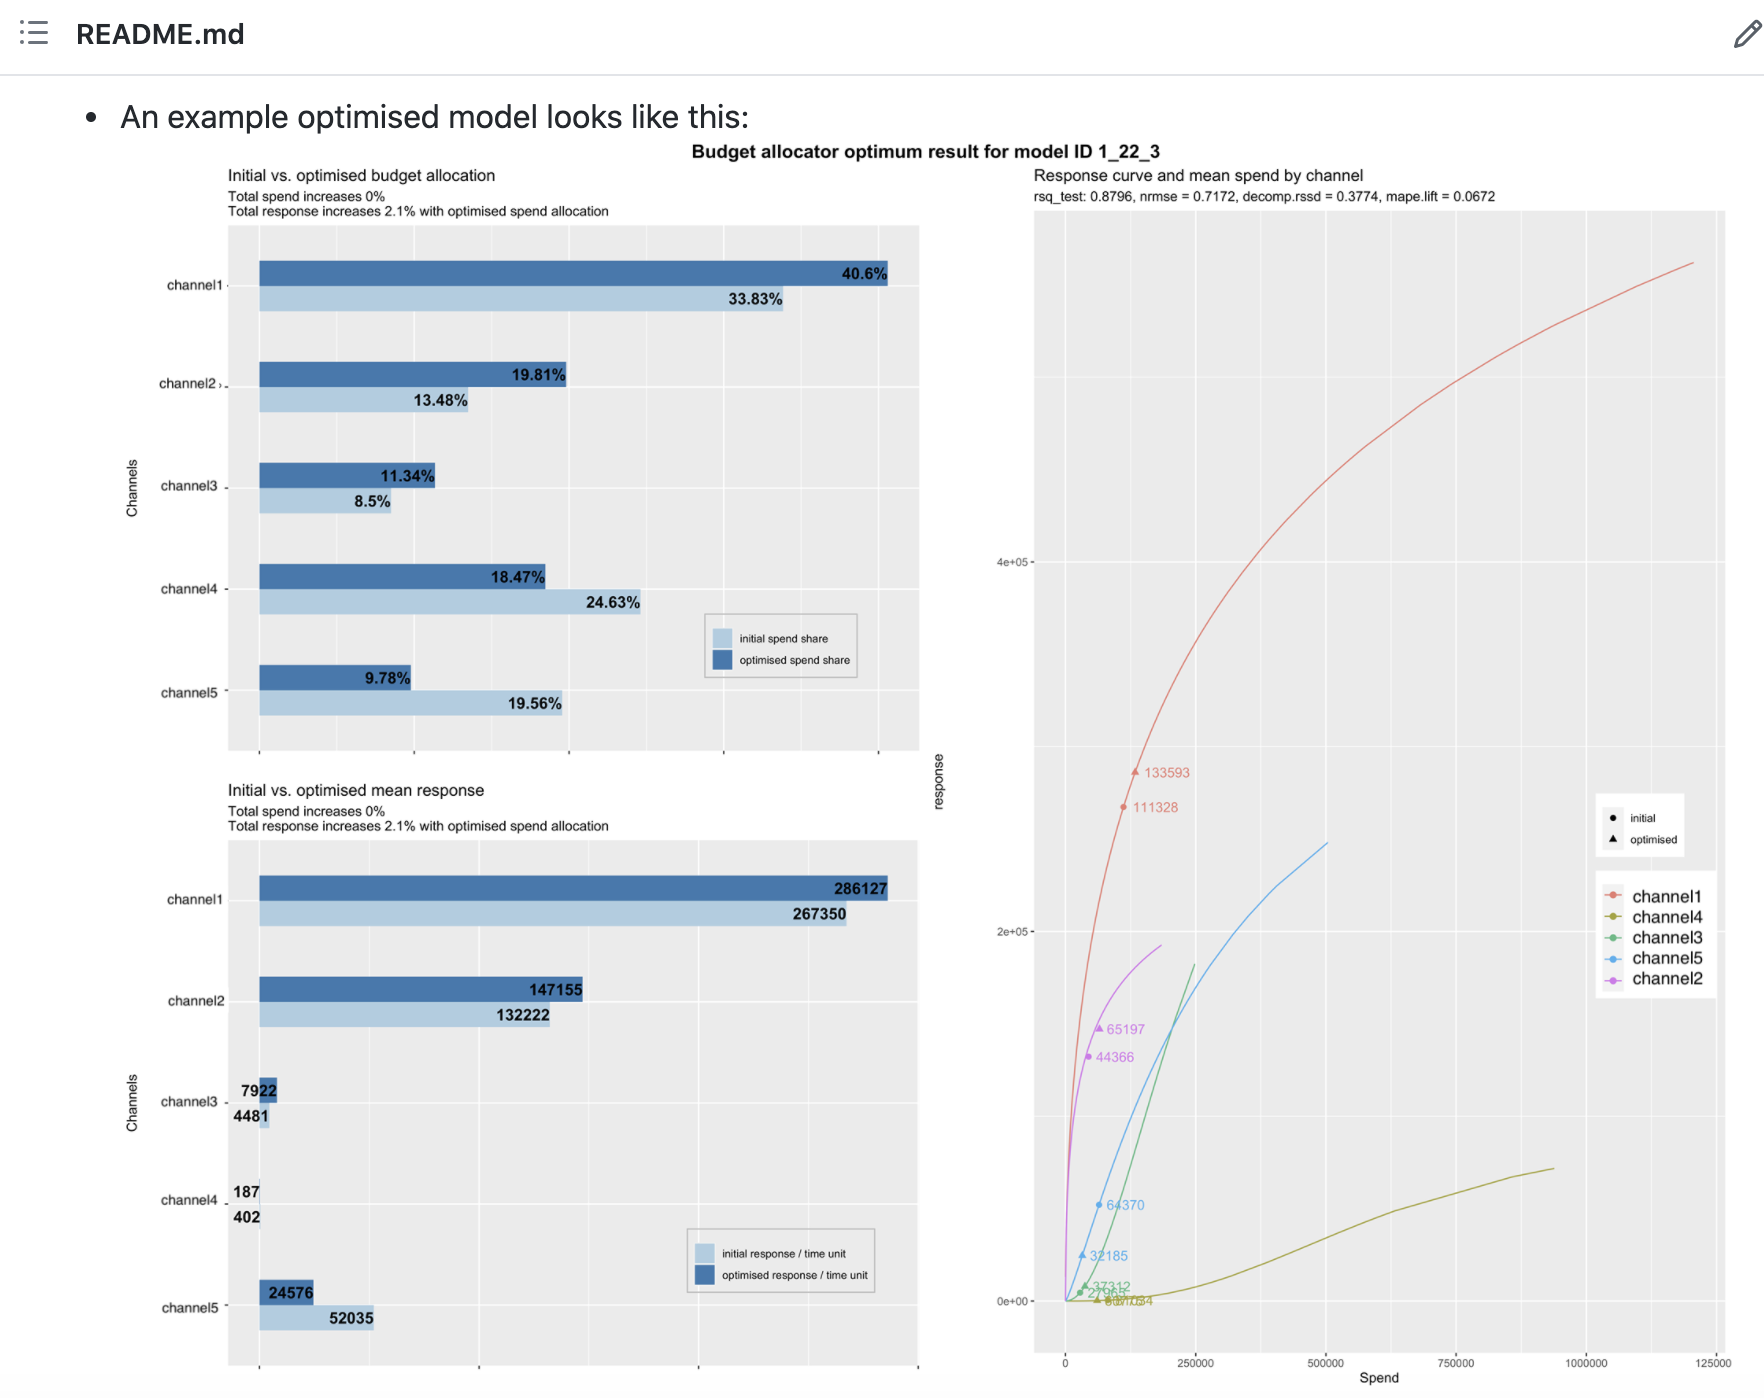
Regarding "forecast the conversion", it's done in the budget allocator already. Looking at the example plot in readme, the lower left plot from the _reallocated.png tells you how much of the response (conversions in your case) will increase or decrease per time unit (if you use weekly data, it'll be the change of a week). It's basically saying this: according to your input data and the model you choose, if you shift media budget as recommended, you will expect this much of change in response (conversions) within a week. This is the column optmResponseUnit in the _reallocated.csv
from robyn.
Related Issues (20)
- Plotting uses huge amount of RAM, causes crash, Out of Memory Errors HOT 3
- Error in colSums(subset(dt_inputRollWind, select = paid_media_spends), : 'x' must be numeric HOT 1
- InputCollect hyperparameter causes error HOT 2
- Budget Allocator - Greater ROI with similar spend HOT 2
- URGENT - robyn_recreate() with JSON produces different model HOT 7
- Budget Allocator ROAS does not match one-pager ROAS with weibull PDF adstock HOT 2
- Error in py_get_attr_impl(x, name, silent) : AttributeError: '_DE' object has no attribute 'set_objective_weights' HOT 2
- Conversion for a particular channel given a Spend. HOT 1
- Strange error with adobe-helvetica (?) HOT 1
- Error in `mutate()`: ℹ In argument: `rsq = lares::winsorize(.data$rsq, thresh = c(0.01, 0.99))` HOT 4
- Robyn Output Error - One or both dimensions exceed the maximum (50000px)
- Robyn Output Error - One or both dimensions exceed the maximum (50000px) HOT 3
- Robyn Python API error HOT 4
- Weibull adstock graph problem HOT 3
- How to make Weibull plots more legible? HOT 1
- Difference between immediate vs. carryover in OutputCollect and OutputModels HOT 4
- '500 Internal Server Error' while accessing 'robyn_outputs' - robyn_api for python HOT 6
- Error after robyn_run() "Error in py_get_attr_impl(x, name, silent)" HOT 1
- Inquiry About Sales Incremental Analysis with Budget Changes Using Robyn HOT 1
- How to replicate the Response Curves and Mean Spends by Channel using the Weibull CDF in a one-pager format from raw data
Recommend Projects
-
 React
React
A declarative, efficient, and flexible JavaScript library for building user interfaces.
-
Vue.js
🖖 Vue.js is a progressive, incrementally-adoptable JavaScript framework for building UI on the web.
-
 Typescript
TypeScript is a superset of JavaScript that compiles to clean JavaScript output.
-
TensorFlow
An Open Source Machine Learning Framework for Everyone
-
Django
The Web framework for perfectionists with deadlines.
-
 Laravel
A PHP framework for web artisans
-
D3
Bring data to life with SVG, Canvas and HTML. 📊📈🎉
-
Recommend Topics
-
javascript
JavaScript (JS) is a lightweight interpreted programming language with first-class functions.
-
web
Some thing interesting about web. New door for the world.
-
server
A server is a program made to process requests and deliver data to clients.
-
Machine learning
Machine learning is a way of modeling and interpreting data that allows a piece of software to respond intelligently.
-
Visualization
Some thing interesting about visualization, use data art
-
Game
Some thing interesting about game, make everyone happy.
Recommend Org
-
Facebook
We are working to build community through open source technology. NB: members must have two-factor auth.
-
Microsoft
Open source projects and samples from Microsoft.
-
Google
Google ❤️ Open Source for everyone.
-
Alibaba
Alibaba Open Source for everyone
-
D3
Data-Driven Documents codes.
-
Tencent
China tencent open source team.
from robyn.