Hubble is a dashboard that displays in a terminal with any data you want. It allows you to setup thresholds if a number goes above/under a certain value. You can have any webhooks, programs, workers, scripts, etc just send an http post request (or setup an api endpoint to poll) and it will get placed on the dashboard. You can also just write a coffee file and have it load from disk. Be creative!!
-
Install hubble
npm install -g hubble
-
Make sure your path has shared npm libraries. If you aren't sure, just run
export PATH=/usr/local/share/npm/bin:$PATH
-
Start your dashboard by typing
hubble
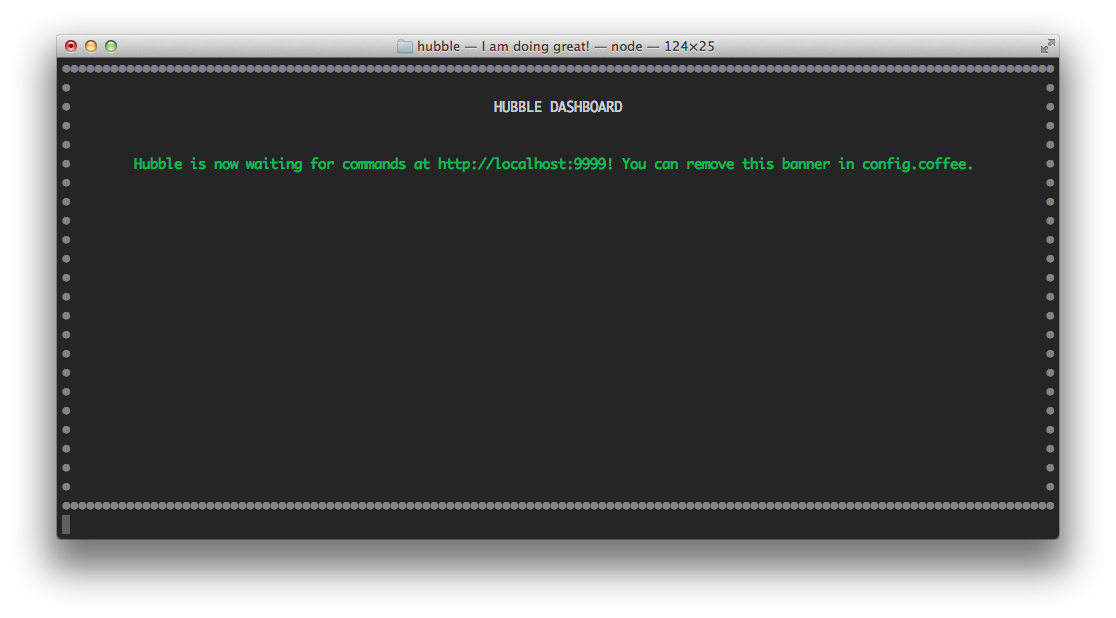
Upon your first launch of Hubble, you will see a screen like below
From this screen, press Y to create config.coffee in the current directory. This file contains the server and dashboard configuration. After this file is created, your board will automatically reload.
You now edit config.coffee to customize your board. :)
Hubble is built behind the idea that you http post information to the server, or load it from disk to configure and populate it. This is a list of the parameters supported by hubble.
column - 0, 1, etc... defines which column the data goes in. (max columns are defined in config.coffee)
label  - the name of the data point to be displayed in the console
Specifying the column and the label with nothing else will create center-aligned text in the column. For a blank line in the console, simply don't include the label.
value - the value of the data point (a specified value)
If the value has been set and you want to increment it by one, you can set the value as increment (sample below)
poll_url      - the url of the web request
poll_seconds  - how often to poll for data changes
poll_failed   - the message to display if the request fails
poll_method   - the method to apply to the result for displaying (accepts one of the below values)
	count_array             - if the endpoint is an array, counts the list
	json_value:{expression} - this will select a single json value from the response. some samples
                              of this are in the Github Dashboard below. visit
                              https://github.com/dfilatov/jspath for a full reference.
poll_header   - any headers to add to the request (you can specify more than one poll_header if you need to)
If you want to set a threshold, you can pass the high and low values. If the value is outside of the threshold, it will turn to the color that was defined in config.coffee.
high   - only works with numbers. this is the over-the-threshold amount (the number will display as configured in config.coffee [red])
low    - only works with numbers. this is the below-the-threshold amount (the number will display as configured in config.coffee [also red])
screen - a single key (example 'a' ... when you press a, this dashboard will show)
At anytime, you can press escape to return to your default screen.
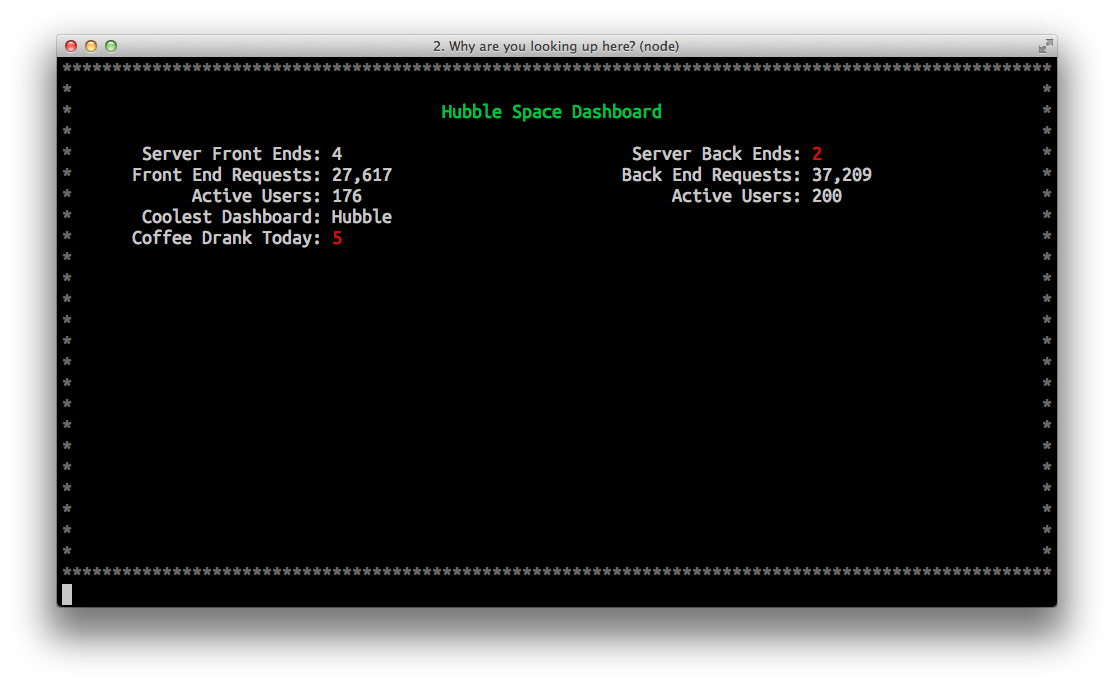
Let's post how many front end and back end servers we have running. If we go under 3, we want it to display the color of the low threshold (red). Let's also post some other random data.
curl --data "column=0&label=Server%20Front%20Ends&value=4&low=3" http://localhost:9999/
curl --data "column=1&label=Server%20Back%20Ends&value=2&low=3"  http://localhost:9999/

curl --data "column=0&label=Front%20End%20Requests&value=27,617" http://localhost:9999/
curl --data "column=1&label=Back%20End%20Requests&value=37,209"  http://localhost:9999/

curl --data "column=0&label=Active%20Users&value=176" http://localhost:9999/
curl --data "column=1&label=Active%20Users&value=200" http://localhost:9999/

curl --data "column=0&label=Coolest%20Dashboard&value=Hubble"  http://localhost:9999/
curl --data "column=0&label=Coffee%20Drank%20Today&value=5&high=4" http://localhost:9999/
After adding some data, setting some thresholds, the dashboard will now look like below
If you have another cup of coffee, you can just increment a value that has already been set
curl --data "column=0&label=Coffee%20Drank%20Today&value=increment&high=4" http://localhost:9999/
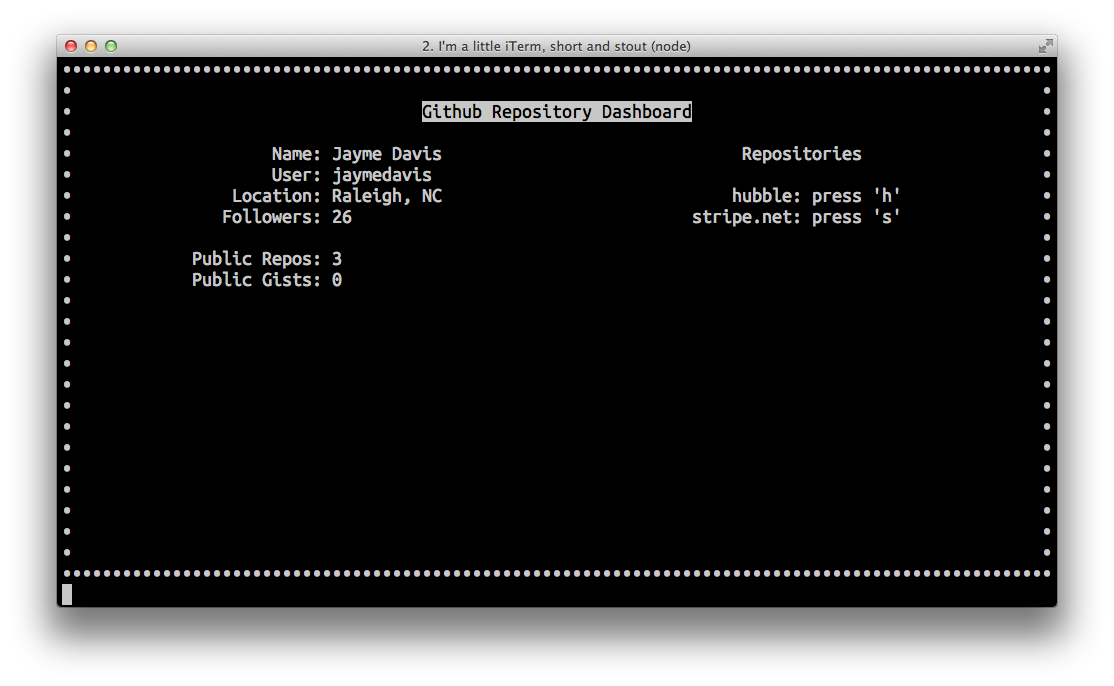
Let's setup a few API calls that we'll use for polling. We will track some information about our Github account, and have it update every 10 seconds. We will track two repositories on two different screens in addition to our overview screen. Lets also change up the colors in the config just for fun. :)
module.exports =
	title:  'Github Repository Dashboard'
	border: '•'

	server:
		port: 9999

	# for more information about available options, see https://github.com/Marak/colors.js
	colors:
		title:  'inverse'
		border: 'white'
		high:   'red'
		low:    'red'

	columns: 2 # how many vertical columns of data for your dashboard
You don't have to supply the '[github:username]:[github:password]' in the api requests, but it will allow you to poll more often (5000 requests per hour vs 60 requests per hour)
curl http://localhost:9999 \
-d column=0 \
-d label="Name" \
-d poll_url="https://[github:username]:[github:password]@api.github.com/users/jaymedavis" \
-d poll_seconds=10 \
-d poll_failed="Bummer :(" \
-d poll_method="json_value:^.[0].name"

curl http://localhost:9999 \
-d column=0 \
-d label="User" \
-d poll_url="https://[github:username]:[github:password]@api.github.com/users/jaymedavis" \
-d poll_seconds=10 \
-d poll_failed="Bummer :(" \
-d poll_method="json_value:^.[0].login"

curl http://localhost:9999 \
-d column=0 \
-d label="Location" \
-d poll_url="https://[github:username]:[github:password]@api.github.com/users/jaymedavis" \
-d poll_seconds=10 \
-d poll_failed="Bummer :(" \
-d poll_method="json_value:^.[0].location"

curl http://localhost:9999 \
-d column=0 \
-d label="Followers" \
-d poll_url="https://[github:username]:[github:password]@api.github.com/users/jaymedavis" \
-d poll_seconds=10 \
-d poll_failed="Bummer :(" \
-d poll_method="json_value:^.[0].followers"

curl http://localhost:9999 \
-d column=0 \

curl http://localhost:9999 \
-d column=0 \
-d label="Public Repos" \
-d poll_url="https://[github:username]:[github:password]@api.github.com/users/jaymedavis" \
-d poll_seconds=10 \
-d poll_failed="Bummer :(" \
-d poll_method="json_value:^.[0].public_repos"

curl http://localhost:9999 \
-d column=0 \
-d label="Public Gists" \
-d poll_url="https://[github:username]:[github:password]@api.github.com/users/jaymedavis" \
-d poll_seconds=10 \
-d poll_failed="Bummer :(" \
-d poll_method="json_value:^.[0].public_gists"

curl http://localhost:9999 \
-d column=1 \
-d label="Repositories"

curl http://localhost:9999 \
-d column=1 \

curl http://localhost:9999 \
-d column=1 \
-d label="hubble" \
-d value="press 'h'"

curl http://localhost:9999 \
-d column=1 \
-d label="stripe.net" \
-d value="press 's'"
Your dashboard so far will look like below
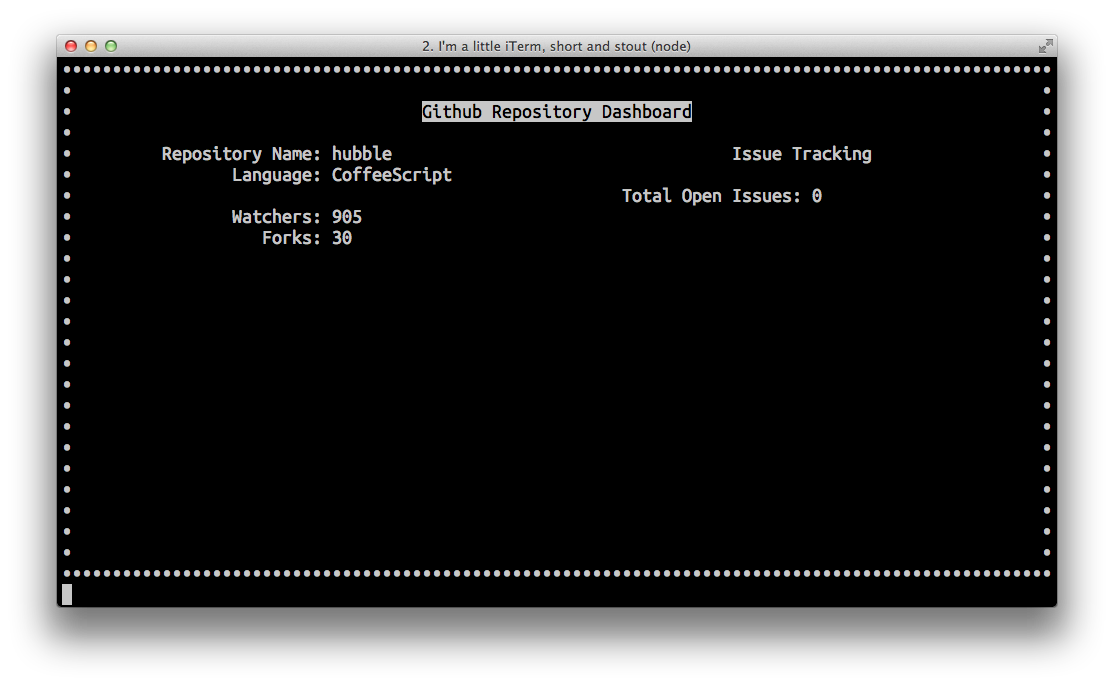
Let's build another screen to track hubble by pressing the 'h' key. The curl request is the same as before, you just also pass in screen=h to specify "show this when h is pressed"
curl http://localhost:9999 \
-d screen="h" \
-d column=0 \
-d label="Repository Name" \
-d value="hubble"

curl http://localhost:9999 \
-d screen="h" \
-d column=0 \
-d label="Language" \
-d poll_url="https://[github:username]:[github:password]@api.github.com/repos/jaymedavis/hubble" \
-d poll_seconds=10 \
-d poll_failed="Bummer :(" \
-d poll_method="json_value:^.[0].language"

curl http://localhost:9999 \
-d screen="h" \
-d column=0

curl http://localhost:9999 \
-d screen="h" \
-d column=0 \
-d label="Watchers" \
-d poll_url="https://[github:username]:[github:password]@api.github.com/repos/jaymedavis/hubble" \
-d poll_seconds=10 \
-d poll_failed="Bummer :(" \
-d poll_method="json_value:^.[0].watchers_count"

curl http://localhost:9999 \
-d screen="h" \
-d column=0 \
-d label="Forks" \
-d poll_url="https://[github:username]:[github:password]@api.github.com/repos/jaymedavis/hubble" \
-d poll_seconds=10 \
-d poll_failed="Bummer :(" \
-d poll_method="json_value:^.[0].forks_count"

curl http://localhost:9999 \
-d screen="h" \
-d column=1 \
-d label="Issue Tracking"

curl http://localhost:9999 \
-d screen="h" \
-d column=1

curl http://localhost:9999 \
-d screen="h" \
-d column=1 \
-d label="Total Open Issues" \
-d high="1" \
-d poll_url="https://[github:username]:[github:password]@api.github.com/repos/jaymedavis/hubble" \
-d poll_seconds=10 \
-d poll_failed="Bummer :(" \
-d poll_method="json_value:^.[0].open_issues_count"
If you press 'h', you will see something like below
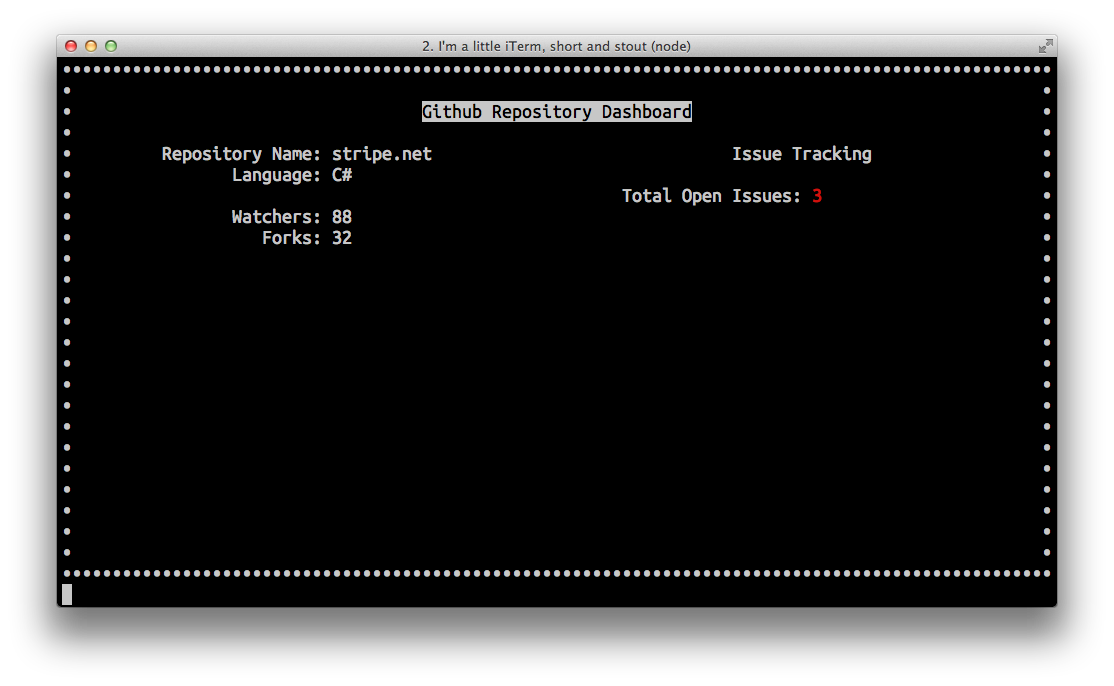
Let's build another screen to track stripe.net by pressing the 's' key. The curl request is the same as before, you just also pass in screen=s to specify "show this when s is pressed"
curl http://localhost:9999 \
-d screen="s" \
-d column=0 \
-d label="Repository Name" \
-d value="stripe.net"

curl http://localhost:9999 \
-d screen="s" \
-d column=0 \
-d label="Language" \
-d poll_url="https://[github:username]:[github:password]@api.github.com/repos/jaymedavis/stripe.net" \
-d poll_seconds=10 \
-d poll_failed="Bummer :(" \
-d poll_method="json_value:^.[0].language"

curl http://localhost:9999 \
-d screen="s" \
-d column=0

curl http://localhost:9999 \
-d screen="s" \
-d column=0 \
-d label="Watchers" \
-d poll_url="https://[github:username]:[github:password]@api.github.com/repos/jaymedavis/stripe.net" \
-d poll_seconds=10 \
-d poll_failed="Bummer :(" \
-d poll_method="json_value:^.[0].watchers_count"

curl http://localhost:9999 \
-d screen="s" \
-d column=0 \
-d label="Forks" \
-d poll_url="https://[github:username]:[github:password]@api.github.com/repos/jaymedavis/stripe.net" \
-d poll_seconds=10 \
-d poll_failed="Bummer :(" \
-d poll_method="json_value:^.[0].forks_count"

curl http://localhost:9999 \
-d screen="s" \
-d column=1 \
-d label="Issue Tracking"

curl http://localhost:9999 \
-d screen="s" \
-d column=1

curl http://localhost:9999 \
-d screen="s" \
-d column=1 \
-d label="Total Open Issues" \
-d high="1" \
-d poll_url="https://[github:username]:[github:password]@api.github.com/repos/jaymedavis/stripe.net" \
-d poll_seconds=10 \
-d poll_failed="Bummer :(" \
-d poll_method="json_value:^.[0].open_issues_count"
If you press 's', you will see something like below
If you want to go back to the main screen at anytime, just press escape.
If you wish to take a snapshot of your current board and save it to disk, you can do so by posting to /save, and providing a filename.
curl --data "filename=myboard.coffee" http://localhost:9999/save
If you wish to load your file next time you start hubble, just provide it as a parameter at the command line.
./hubble myboard.coffee
You could just as easily write your script directly if you choose... without doing any http posts.
I really have enjoyed working on this project and would love to hear how you use it. Shoot me an email or a twitter message (@jaymed), I'd appreciate it!


