Sterenborg: automatically rank plots based on NDVI maps that stem from satellite and drone images.
Team members: Rowley Cowper and Simeon Nedkov
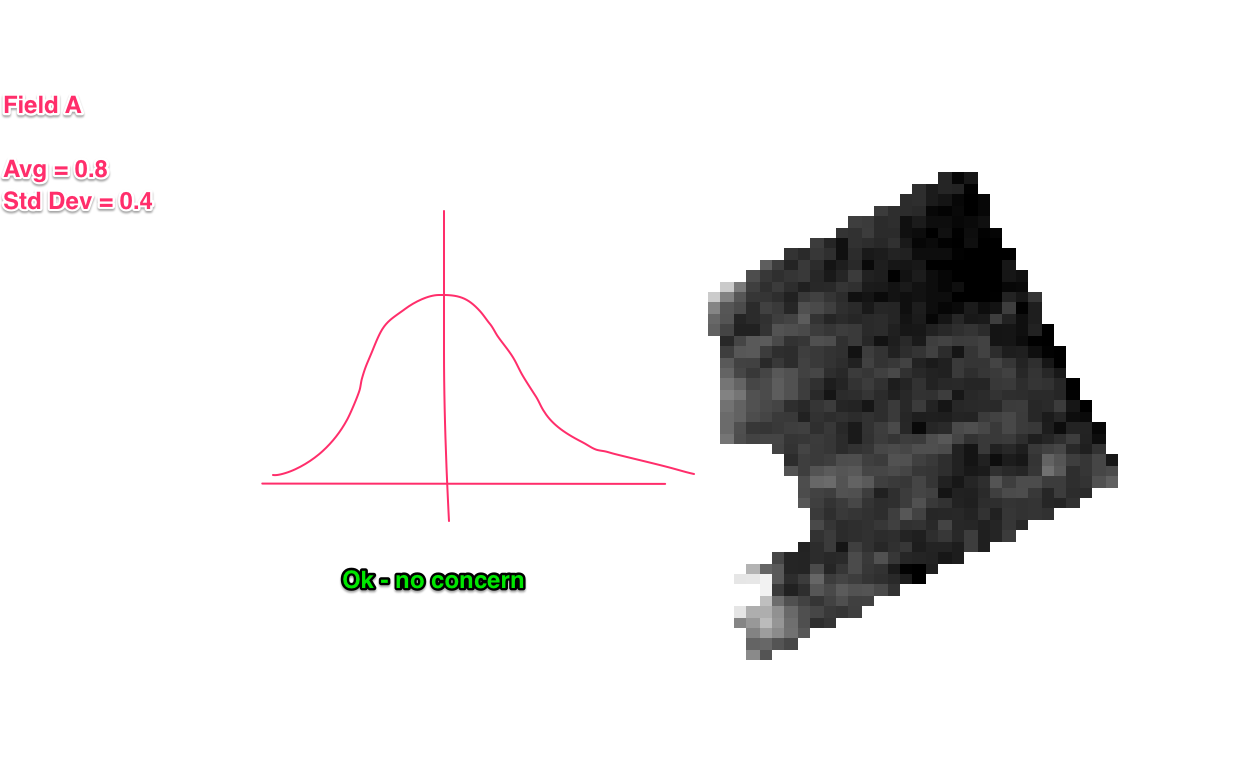
The idea of this data interaction is to make a tool that can identify, in graph form, any potential deviation in field performance or between fields, that might reveal a growing or emerging problem. The concept revolves around the fact that the dataset in the current visual form may hide emerging problems if the problem is evenly distributed throughout the image. By taking the histogram of a field it is hoped to reveal additional peaks emerging that would cause the farmer to look at the data/field in more detail.
The final output should look something like this:
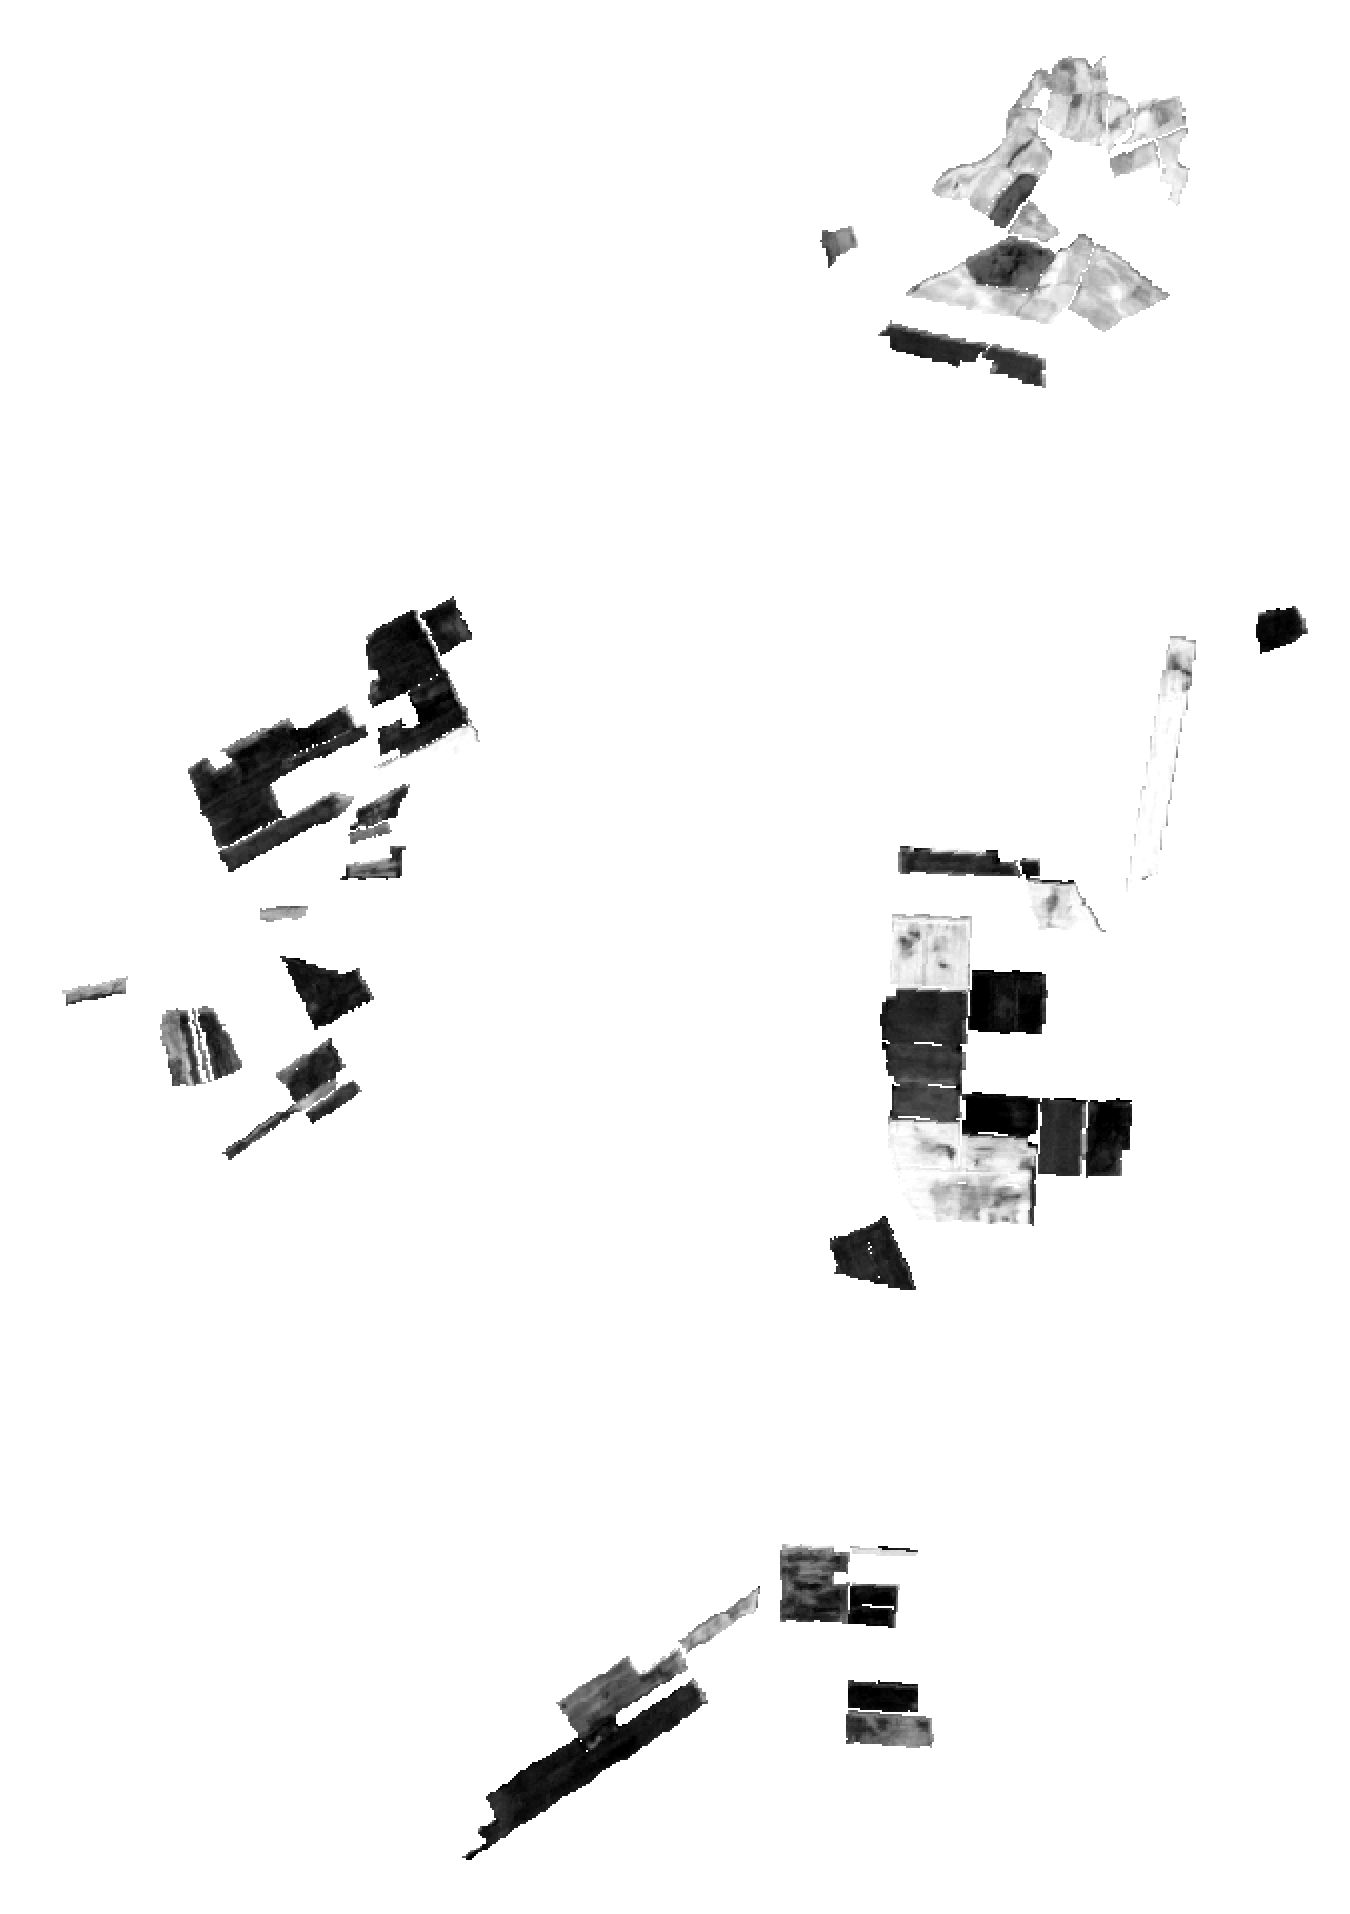
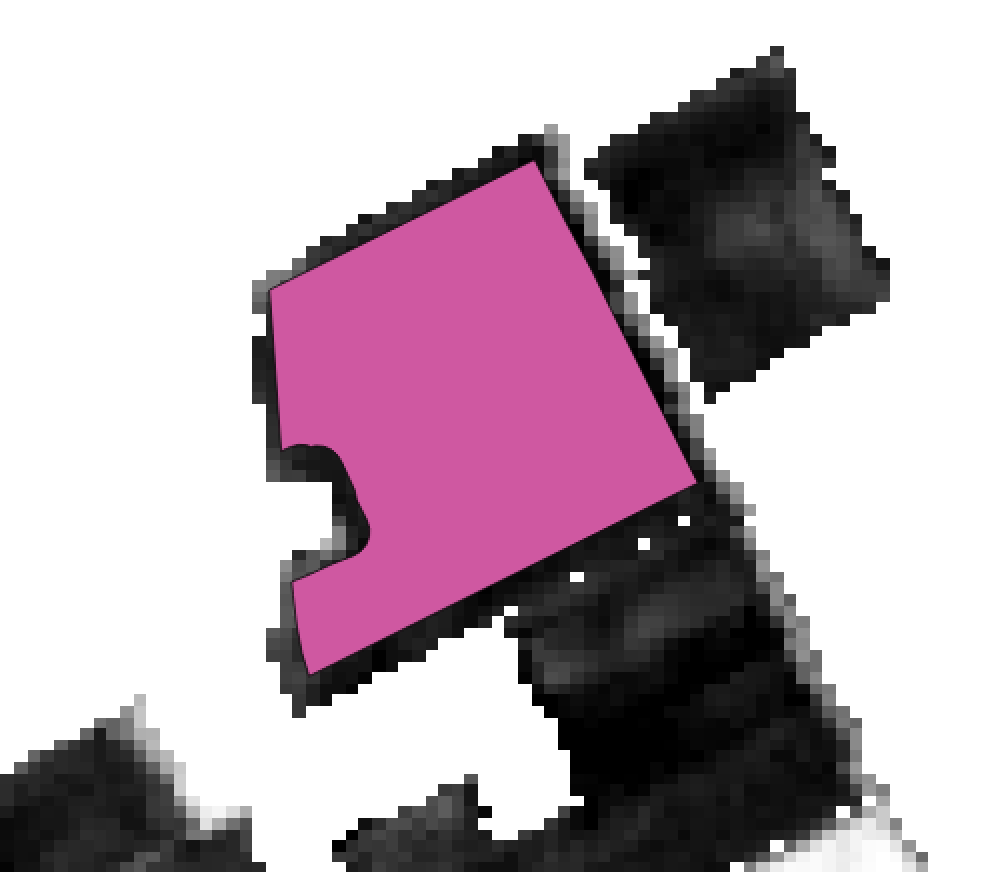
Take the dataset
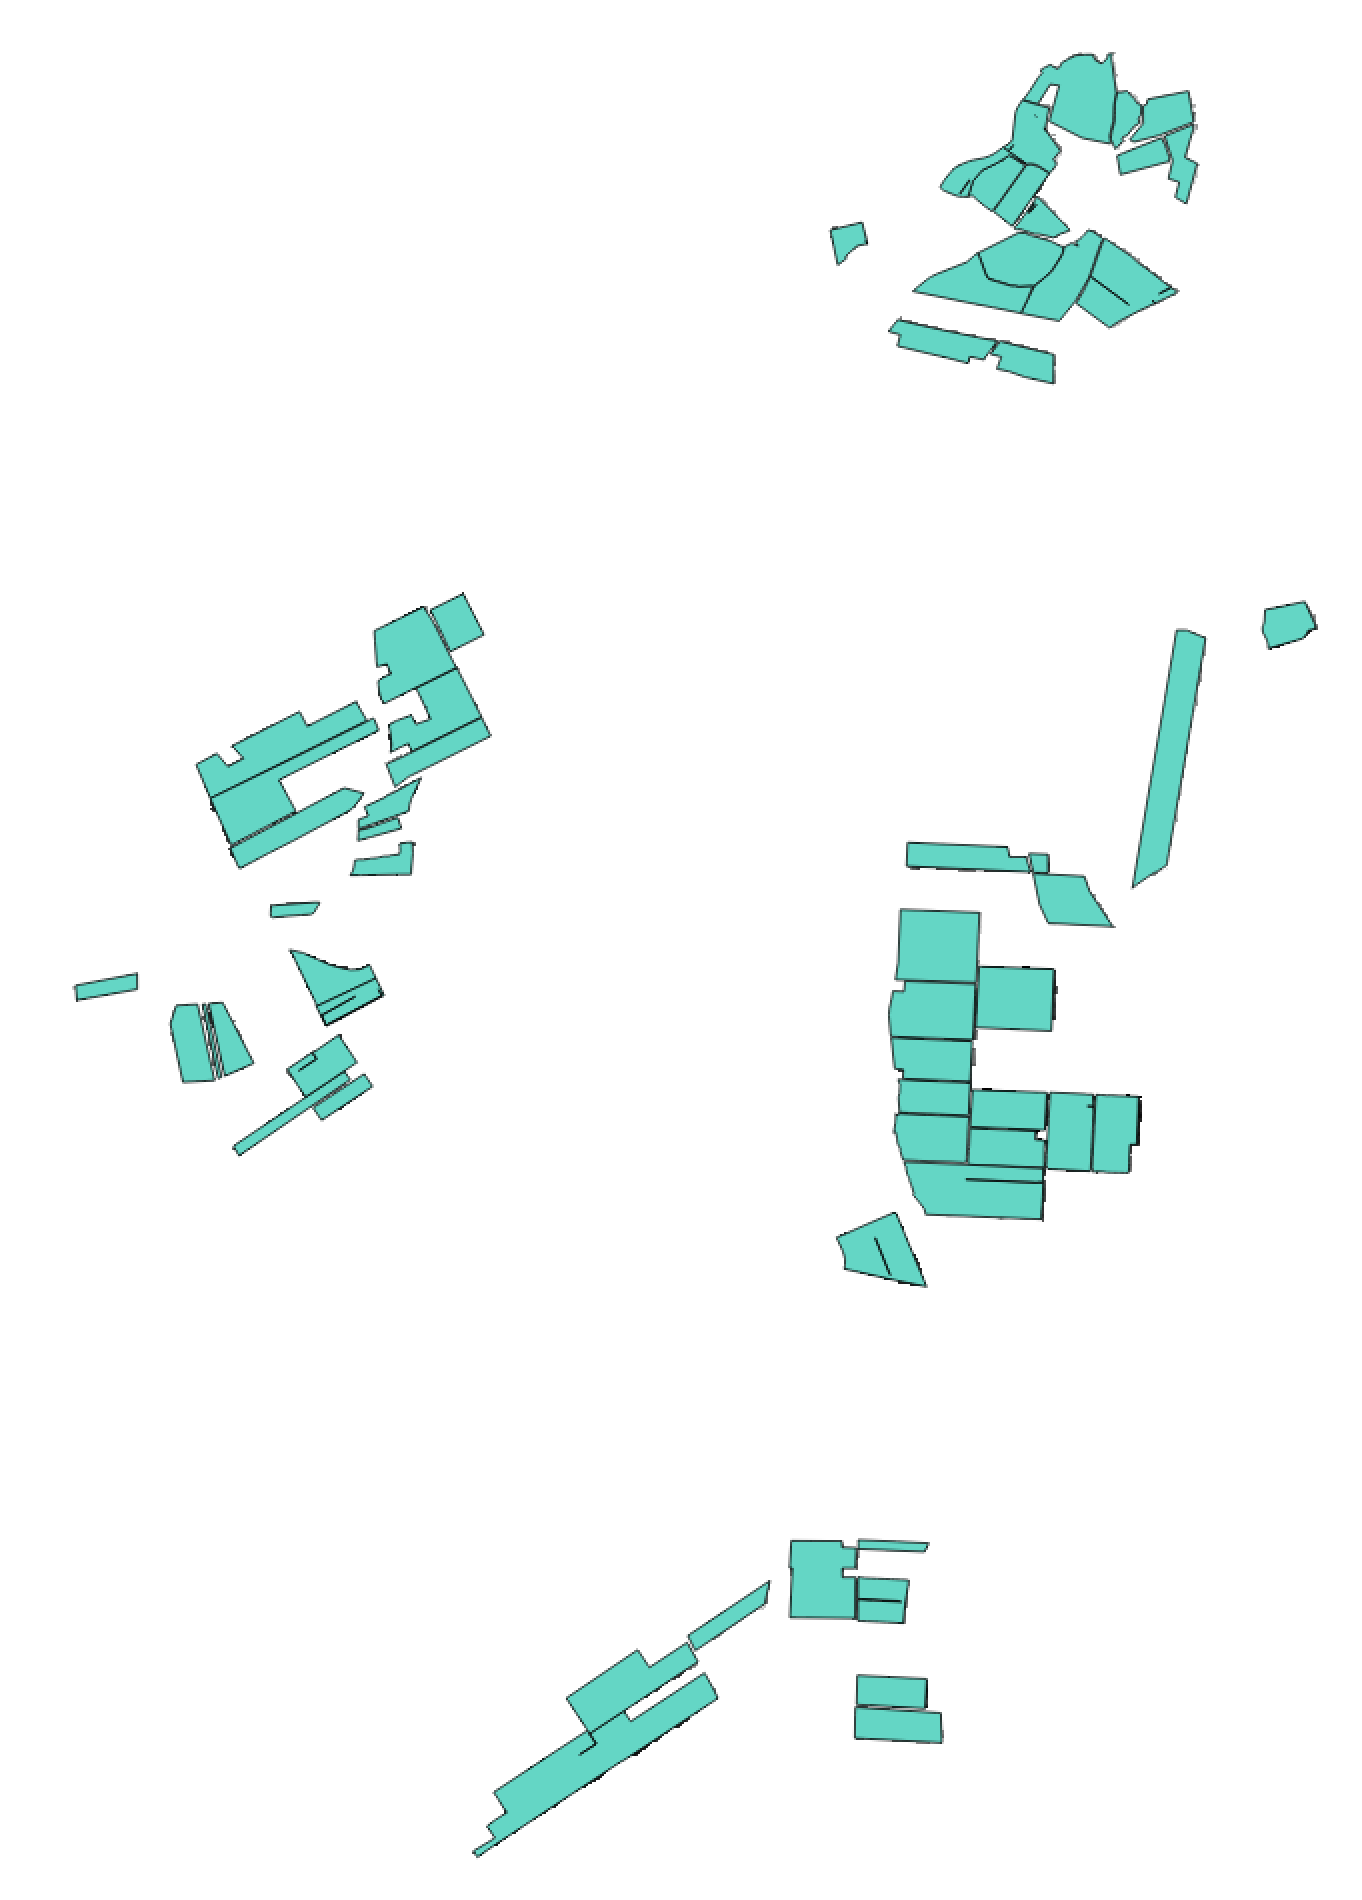
The farmer can select the fields to consider or to rank
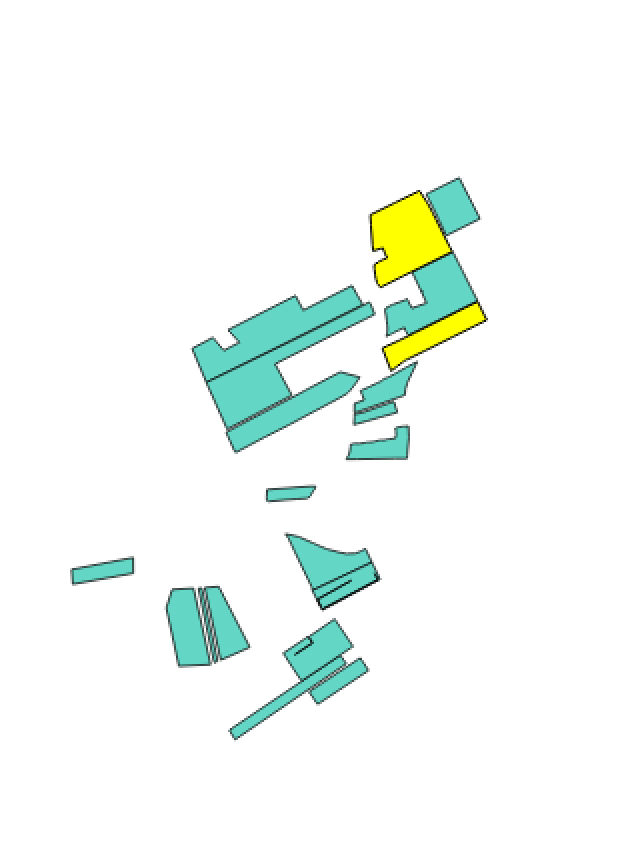
These are masked, breaking it down into individual field, removing the pixel bordering effect
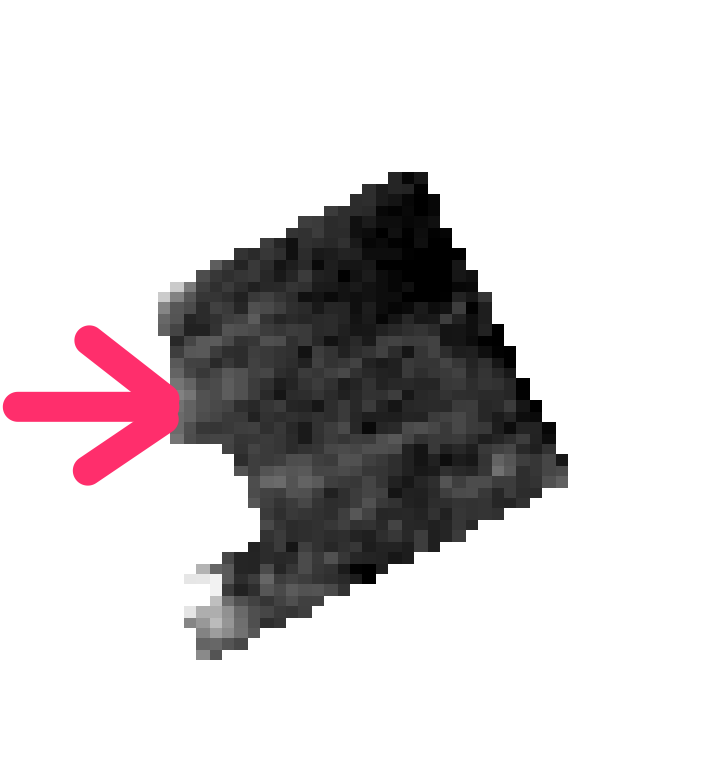
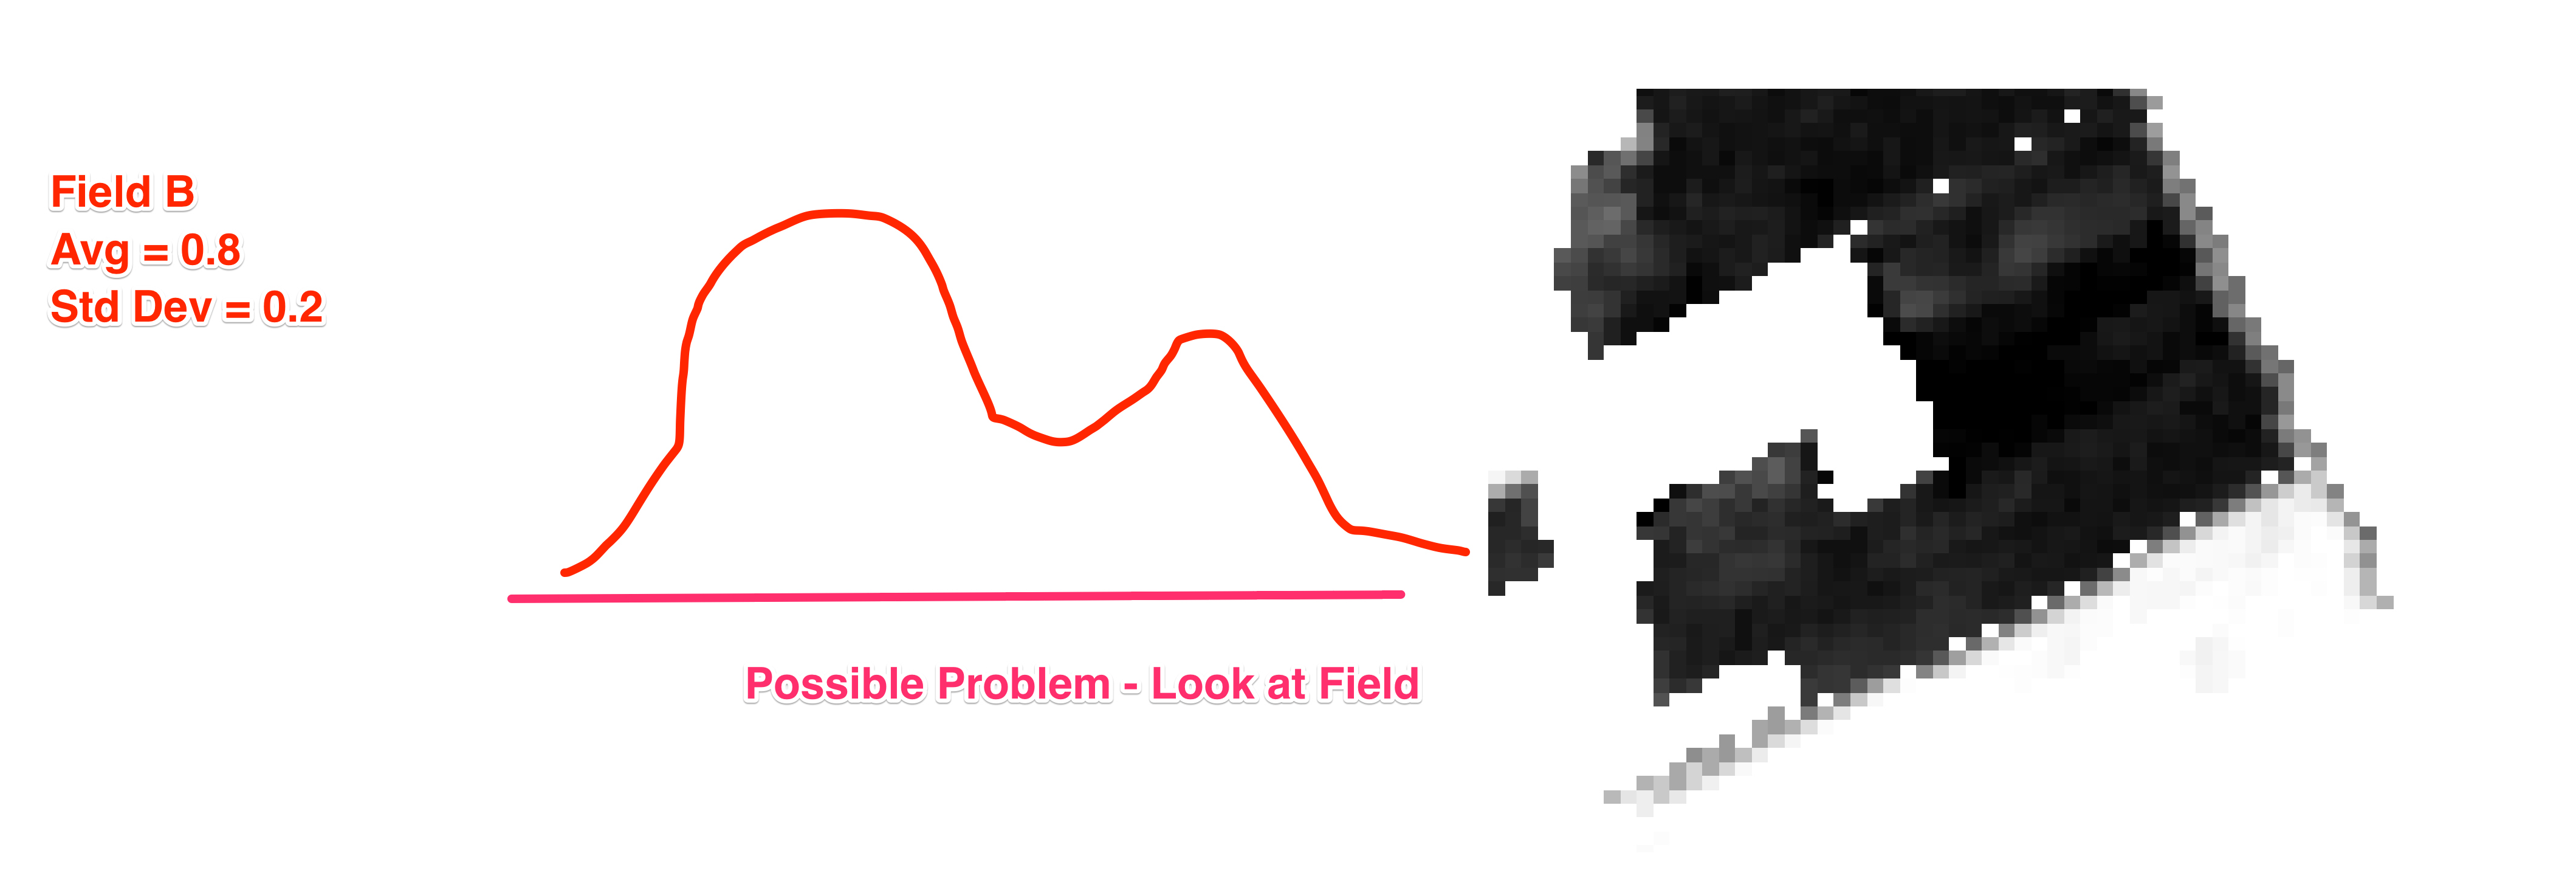
Convert to a histogram, with the intent of looking for significant deviations in the form of dual peaks

Set a threshold point at which to calculate the number of peaks, possibly by scanning the image from bottom to top, looking for gaps
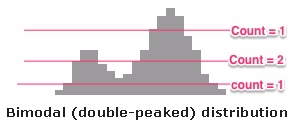
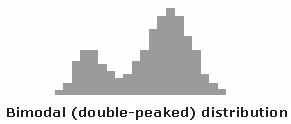
If a count=2 scenario is encountered, then there is the potential that a problem is developing. This may only be able to look at visually.
A time based evaluation of this would also be quite valuable, as it may show an emerging area problem.
For example, if the problem is evenly distributed, it is hard to see in the picture visually, but would be very apparent in the histogram representation.
Things that need to be done/considered - Exporting the raster data measurements into a stats program or algorithm that computes a minimum threshold count for the histogram to give a good distribution
The methodology is implemented in rank.py. The script takes a satellite/drone image, intersects it with the farmer's plots
and calculates a number of zonal statistics and a histogram.
- automatically detect peaks in the histogram