GithubHelp home page GithubHelp logo

fboehm / qtl2pleio Goto Github PK

View Code? Open in Web Editor NEW
4.0 3.0 1.0 5.35 MB

Testing pleiotropy vs. separate QTL in multiparental populations

License: Other

R 70.28% C++ 23.31% C 2.66% TeX 3.21% Dockerfile 0.55%
quantitative-trait quantitative-genetics multiparental-populations

qtl2pleio's Introduction

qtl2pleio

R-CMD-check CRAN_Status_Badge Coverage Status Project Status: Active – The project has reached a stable, usable state and is being actively developed. status DOI

Overview

qtl2pleio is a software package for use with the R statistical computing environment. qtl2pleio is freely available for download and use. I share it under the MIT license. The user will also want to download and install the qtl2 R package.

Click here to explore qtl2pleio within a live Rstudio session in “the cloud”.

Contributor guidelines

We eagerly welcome contributions to qtl2pleio. All pull requests will be considered. Features requests and bug reports may be filed as Github issues. All contributors must abide by the code of conduct.

Technical support

For technical support, please open a Github issue. If you’re just getting started with qtl2pleio, please examine the vignettes on the package’s web site. You can also email [email protected] for assistance.

Goals

The goal of qtl2pleio is, for a pair of traits that show evidence for a QTL in a common region, to distinguish between pleiotropy (the null hypothesis, that they are affected by a common QTL) and the alternative that they are affected by separate QTL. It extends the likelihood ratio test of Jiang and Zeng (1995) for multiparental populations, such as Diversity Outbred mice, including the use of multivariate polygenic random effects to account for population structure. qtl2pleio data structures are those used in the rqtl/qtl2 package.

Installation

To install qtl2pleio, use install_github() from the devtools package.

install.packages("qtl2pleio")

You may also wish to install the R/qtl2. We will use it below.

install.packages("qtl2")

Example

Below, we walk through an example analysis with Diversity Outbred mouse data. We need a number of preliminary steps before we can perform our test of pleiotropy vs. separate QTL. Many procedures rely on the R package qtl2. We first load the qtl2 and qtl2pleio packages.

library(qtl2)
library(qtl2pleio)
library(ggplot2)

Reading data from qtl2data repository on github

We’ll consider the DOex data in the qtl2data repository. We’ll download the DOex.zip file before calculating founder allele dosages.

file <- paste0("https://raw.githubusercontent.com/rqtl/",
               "qtl2data/master/DOex/DOex.zip")
DOex <- read_cross2(file)
probs <- calc_genoprob(DOex)

Let’s calculate the founder allele dosages from the 36-state genotype probabilities.

pr <- genoprob_to_alleleprob(probs)

We now have an allele probabilities object stored in pr.

names(pr)
#> [1] "2" "3" "X"
dim(pr$`2`)
#> [1] 261   8 127

We see that pr is a list of 3 three-dimensional arrays - one array for each of 3 chromosomes.

Kinship calculations

For our statistical model, we need a kinship matrix. We get one with the calc_kinship function in the rqtl/qtl2 package.

kinship <- calc_kinship(probs = pr, type = "loco")

Statistical model specification

We use the multivariate linear mixed effects model:

vec(Y) = Xvec(B) + vec(G) + vec(E)

where Y contains phenotypes, X contains founder allele probabilities and covariates, and B contains founder allele effects. G is the polygenic random effects, while E is the random errors. We provide more details in the vignette.

Simulating phenotypes with qtl2pleio::sim1

The function to simulate phenotypes in qtl2pleio is sim1.

# set up the design matrix, X
pp <- pr[[2]] #we'll work with Chr 3's genotype data
#Next, we prepare a design matrix X
X <- gemma2::stagger_mats(pp[ , , 50], pp[ , , 50])
# assemble B matrix of allele effects
B <- matrix(data = c(-1, -1, -1, -1, 1, 1, 1, 1, -1, -1, -1, -1, 1, 1, 1, 1), nrow = 8, ncol = 2, byrow = FALSE)
# set.seed to ensure reproducibility
set.seed(2018-01-30)
Sig <- calc_Sigma(Vg = diag(2), Ve = diag(2), kinship = kinship[[2]])
# call to sim1
Ypre <- sim1(X = X, B = B, Sigma = Sig)
Y <- matrix(Ypre, nrow = 261, ncol = 2, byrow = FALSE)
rownames(Y) <- rownames(pp)
colnames(Y) <- c("tr1", "tr2")

Let’s perform univariate QTL mapping for each of the two traits in the Y matrix.

s1 <- scan1(genoprobs = pr, pheno = Y, kinship = kinship)

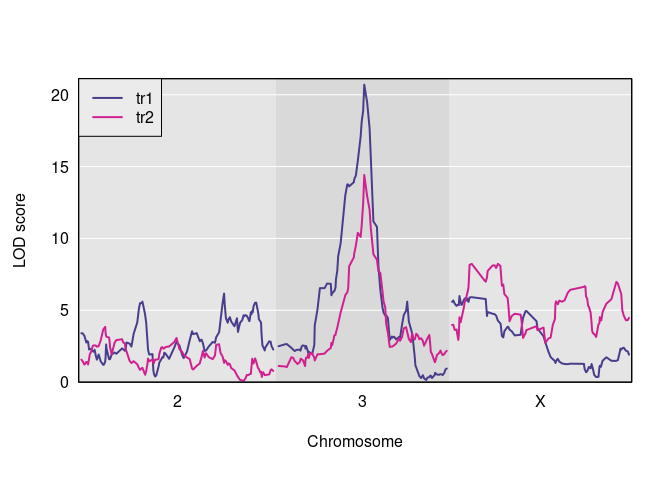
Here is a plot of the results.

And here are the observed QTL peaks with LOD > 8.

find_peaks(s1, map = DOex$pmap, threshold=8)
#>   lodindex lodcolumn chr      pos       lod
#> 1        1       tr1   3 82.77806 20.703383
#> 2        2       tr2   3 82.77806 14.417924
#> 3        2       tr2   X 48.10040  8.231551

Perform two-dimensional scan as first step in pleiotropy vs. separate QTL hypothesis test

We now have the inputs that we need to do a pleiotropy vs. separate QTL test. We have the founder allele dosages for one chromosome, i.e., Chr 3, in the R object pp, the matrix of two trait measurements in Y, and a LOCO-derived kinship matrix, kinship[[2]].

out <- suppressMessages(scan_pvl(probs = pp,
                pheno = Y,
                kinship = kinship[[2]], # 2nd entry in kinship list is Chr 3
                start_snp = 38,
                n_snp = 25
                ))

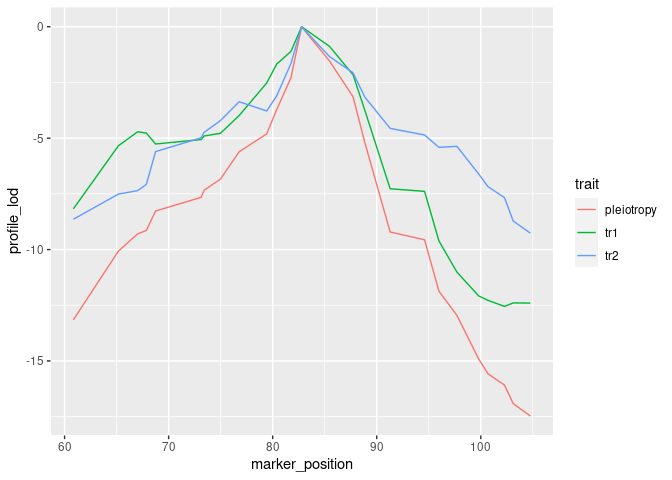
Create a profile LOD plot to visualize results of two-dimensional scan

To visualize results from our two-dimensional scan, we calculate profile LOD for each trait. The code below makes use of the R package ggplot2 to plot profile LODs over the scan region.

library(dplyr)
out %>%
  calc_profile_lods() %>%
  add_pmap(pmap = DOex$pmap$`3`) %>%
  ggplot() + geom_line(aes(x = marker_position, y = profile_lod, colour = trait))

Calculate the likelihood ratio test statistic for pleiotropy v separate QTL

We use the function calc_lrt_tib to calculate the likelihood ratio test statistic value for the specified traits and specified genomic region.

(lrt <- calc_lrt_tib(out))
#> [1] 0

Bootstrap analysis to get p-values

Before we call boot_pvl, we need to identify the index (on the chromosome under study) of the marker that maximizes the likelihood under the pleiotropy constraint. To do this, we use the qtl2pleio function find_pleio_peak_tib.

(pleio_index <- find_pleio_peak_tib(out, start_snp = 38))
#> log10lik13 
#>         50
set.seed(2018-11-25) # set for reproducibility purposes.
b_out <- suppressMessages(boot_pvl(probs = pp,
         pheno = Y,
         pleio_peak_index = pleio_index,
         kinship = kinship[[2]], # 2nd element in kinship list is Chr 3
         nboot = 10,
         start_snp = 38,
         n_snp = 25
         ))
(pvalue <- mean(b_out >= lrt))
#> [1] 1

Citation information

citation("qtl2pleio")
#> 
#> To cite qtl2pleio in publications use:
#> 
#>   Boehm FJ, Chesler EJ, Yandell BS, Broman KW (2019) Testing pleiotropy
#>   vs. separate QTL in multiparental populations G3
#>   https://www.g3journal.org/content/9/7/2317
#> 
#> A BibTeX entry for LaTeX users is
#> 
#>   @Article{Boehm2019testing,
#>     title = {Testing pleiotropy vs. separate QTL in multiparental populations},
#>     author = {Frederick J. Boehm and Elissa J. Chesler and Brian S. Yandell and Karl W. Broman},
#>     journal = {G3},
#>     year = {2019},
#>     volume = {9},
#>     issue = {7},
#>     url = {https://www.g3journal.org/content/9/7/2317},
#>     eprint = {https://www.g3journal.org/content/ggg/9/7/2317.full.pdf},
#>   }

qtl2pleio's People

Contributors

fboehm avatar kbroman avatar kyleniemeyer avatar

Stargazers

 avatar  avatar  avatar  avatar

Watchers

 avatar  avatar  avatar

Forkers

kbroman

qtl2pleio's Issues

Use base 10 log instead of natural base

scan_pvl uses natural base logarithms. Also, need to revise column name in output of calc_profile_lods to clarify that logarithm base should be 10.

Issue initially raised by @HongHe0123 in a separate discussion

tests fail in v 0.1.1

Due to restructuring of scan_pvl output, I need to revise tests for scan_pvl. As of v 0.1.1, the output of scan_pvl is now a data frame with (n_snp)^d rows, where the last column is log likelihood values.

Reword README and vignette sections

The README.md needs more detailed, accurate explanations. Think about explaining each step to a novice R user. Also consider showing the results of calculations, rather than assuming that the user knows to examine them. For some large results, kinship matrices, etc, show dim or length only?

How to extract from addcovar input a matrix with linearly independent columns?

I need to look to see how others have addressed this... maybe even an R package has a function to handle this already.

The problem is that we need to think about whether, after subsetting to common subjects and removing subjects with missing phenotypes or covariates, the resulting covariates matrix's columns are linearly independent. If they have "full rank", then we're ok... but, if rank is less than the number of columns in the covariates matrix, how to proceed? For example, we can't merely drop an arbitrary column, since a column could have, for example, all zeros. But, if we rule out this case, that a matrix column is all zeros, then maybe we can just drop one column if the rank is only one less than the number of columns. I need to review my matrix algebra - if 4 vectors form a matrix that has rank 3, is it true that any 3 of them (again, assuming none is the zero vector) together have rank 3? No! We also need to consider the possibility that two columns are "parallel". In a more general setting, we need to check the rank of the subsets of columns. Since, for example, a three vectors could all be coplanar, while no two would be parallel. I am sure that others have written code to solve this. Can I find their code?

Update README.Rmd

After making changes to the code, I need to revise the R code in the README.Rmd to ensure that it uses currently available functions. Specifically, tidy_scan_pvl is no longer available, yet, I think, it's used in the README.Rmd. I probably should remove the plot_pvl call, too. I might consider revising plot_pvl to take the updated data structures outputted by calc_profile_lods.

Decide which data to include in package

I can't write files (or even download to a tmp directory) per CRAN policy. Change / remove sim400. I also need to change examples, tests, vignettes to align with this requirement.

Update README

  1. remove text about rstudio session in the cloud.
  2. add text and hyperlinks about multivariate, one-QTL scans

fix vignettes

vignettes("qtl2pleio")

returns message that no vignettes were found. Fix this!

Installation problem

Sorry for bothering you again. I got error again for the installation of new version and old version (install_github("fboehm/qtl2pleio", ref = "b7ce5bdba3b5a120a58af0f0337b72ac30cfed1a",force = TRUE)). The both have similar error massages. So I have not qtl2pleio to use now. Thanks for the help.

devtools::install_github("fboehm/qtl2pleio")
Downloading GitHub repo fboehm/qtl2pleio@master
√ checking for file 'C:\Users\60001296\AppData\Local\Temp\RtmpkvD45F\remotes1cd8448c04c1e\fboehm-qtl2pleio-0966d84/DESCRIPTION' (1.3s)

  • preparing 'qtl2pleio': (1.4s)
    √ checking DESCRIPTION meta-information ...
  • cleaning src
  • checking for LF line-endings in source and make files and shell scripts (676ms)
  • checking for empty or unneeded directories
  • building 'qtl2pleio_1.1.0.tar.gz'

Installing package into ‘C:/Users/Documents/R/win-library/3.5’
(as ‘lib’ is unspecified)
ERROR: failed to lock directory 'C:/Users/60001296/Documents/R/win-library/3.5' for modifying
Try removing 'C:/Users/60001296/Documents/R/win-library/3.5/00LOCK-qtl2pleio'
In R CMD INSTALL
Error: Failed to install 'qtl2pleio' from GitHub:
(converted from warning) installation of package ‘C:/Users/AppData/Local/Temp/RtmpkvD45F/file1cd8468252a38/qtl2pleio_1.1.0.tar.gz’ had non-zero exit status
In addition: Warning messages:
1: In base_download_noheaders(url, path, quiet, headers, method) :
R (< 3.6.0) cannot send HTTP headers with the wininet download method. This download will likely fail. Please choose a different download method, via the download.file.method option. The libcurl method is best, if available, and the wget and curl methods work as well, if the corresponding external tool is available. See ?download.file
2: In untar2(tarfile, files, list, exdir) :
skipping pax global extended headers
3: In untar2(tarfile, files, list, exdir) :
skipping pax global extended headers

Fix wording in d-variate, d-QTL scan vignette

  1. In the vignette, I talk about n_cores, the old name for what is now cores.
  2. I say that I use n_cores = 1 to satisfy CRAN when, in fact, I buildignore the vignette, so that CRAN never sees it.

Not able to install the package qtl2peio

Could you please help me with the installation? Thanks. I used devtools::install_github("fboehm/qtl2pleio") to install the package. But have an error as follows:

C:/RBuildTools/3.5/mingw_32/bin/g++ -I"C:/PROGRA1/R/R-351.3/include" -DNDEBUG -I"C:/Users//Documents/R/win-library/3.5/Rcpp/include" -I"C:/Users//Documents/R/win-library/3.5/RcppEigen/include" -O2 -Wall -mtune=generic -c test-example.cpp -o test-example.o
test-example.cpp:12:22: fatal error: testthat.h: No such file or directory
#include <testthat.h>
^
compilation terminated.
make: *** [C:/PROGRA1/R/R-351.3/etc/i386/Makeconf:215: test-example.o] Error 1
ERROR: compilation failed for package 'qtl2pleio'

  • removing 'C:/Users//Documents/R/win-library/3.5/qtl2pleio'
    In R CMD INSTALL
    Error in i.p(...) :
    (converted from warning) installation of package ‘C:/Users//AppData/Local/Temp/RtmpoX3waK/file5389835017109/qtl2pleio_1.0.7.tar.gz’ had non-zero exit status
    In addition: Warning messages:
    1: In untar2(tarfile, files, list, exdir) :
    skipping pax global extended headers
    2: In untar2(tarfile, files, list, exdir) :
    skipping pax global extended headers

Vignette code fails

in version 0.1.1, vignette code doesn't successfully run. This is due to a major restructuring of scan_pvl. I need to revise the tidy and plot functions to enable it to run successfully

clean up scan_pvl and boot_pvl code

I think that I'm using a lot of redundant code in these two functions. Make a third function that captures these redundancies, then call that third function from both scan_pvl and boot_pvl. adhere to the DRY (don't repeat yourself) principle.

CRAN and LTO issue

CRAN emailed me to say that I need to fix qtl2pleio.

Here is a discussion:

r-lib/testthat#1230

I may actually not use any C++ unit tests, so this may not be a big deal for me to remove testthat stuff that expects C++ unit tests.

Recommend Projects

  • React photo React

    A declarative, efficient, and flexible JavaScript library for building user interfaces.

  • Vue.js photo Vue.js

    🖖 Vue.js is a progressive, incrementally-adoptable JavaScript framework for building UI on the web.

  • Typescript photo Typescript

    TypeScript is a superset of JavaScript that compiles to clean JavaScript output.

  • TensorFlow photo TensorFlow

    An Open Source Machine Learning Framework for Everyone

  • Django photo Django

    The Web framework for perfectionists with deadlines.

  • D3 photo D3

    Bring data to life with SVG, Canvas and HTML. 📊📈🎉

Recommend Topics

  • javascript

    JavaScript (JS) is a lightweight interpreted programming language with first-class functions.

  • web

    Some thing interesting about web. New door for the world.

  • server

    A server is a program made to process requests and deliver data to clients.

  • Machine learning

    Machine learning is a way of modeling and interpreting data that allows a piece of software to respond intelligently.

  • Game

    Some thing interesting about game, make everyone happy.

Recommend Org

  • Facebook photo Facebook

    We are working to build community through open source technology. NB: members must have two-factor auth.

  • Microsoft photo Microsoft

    Open source projects and samples from Microsoft.

  • Google photo Google

    Google ❤️ Open Source for everyone.

  • D3 photo D3

    Data-Driven Documents codes.