ETL Workshop - 1
- Setting Project Locally
- Description & Goals
- Arquitecture
- Process & Result
- Conclusions
- References
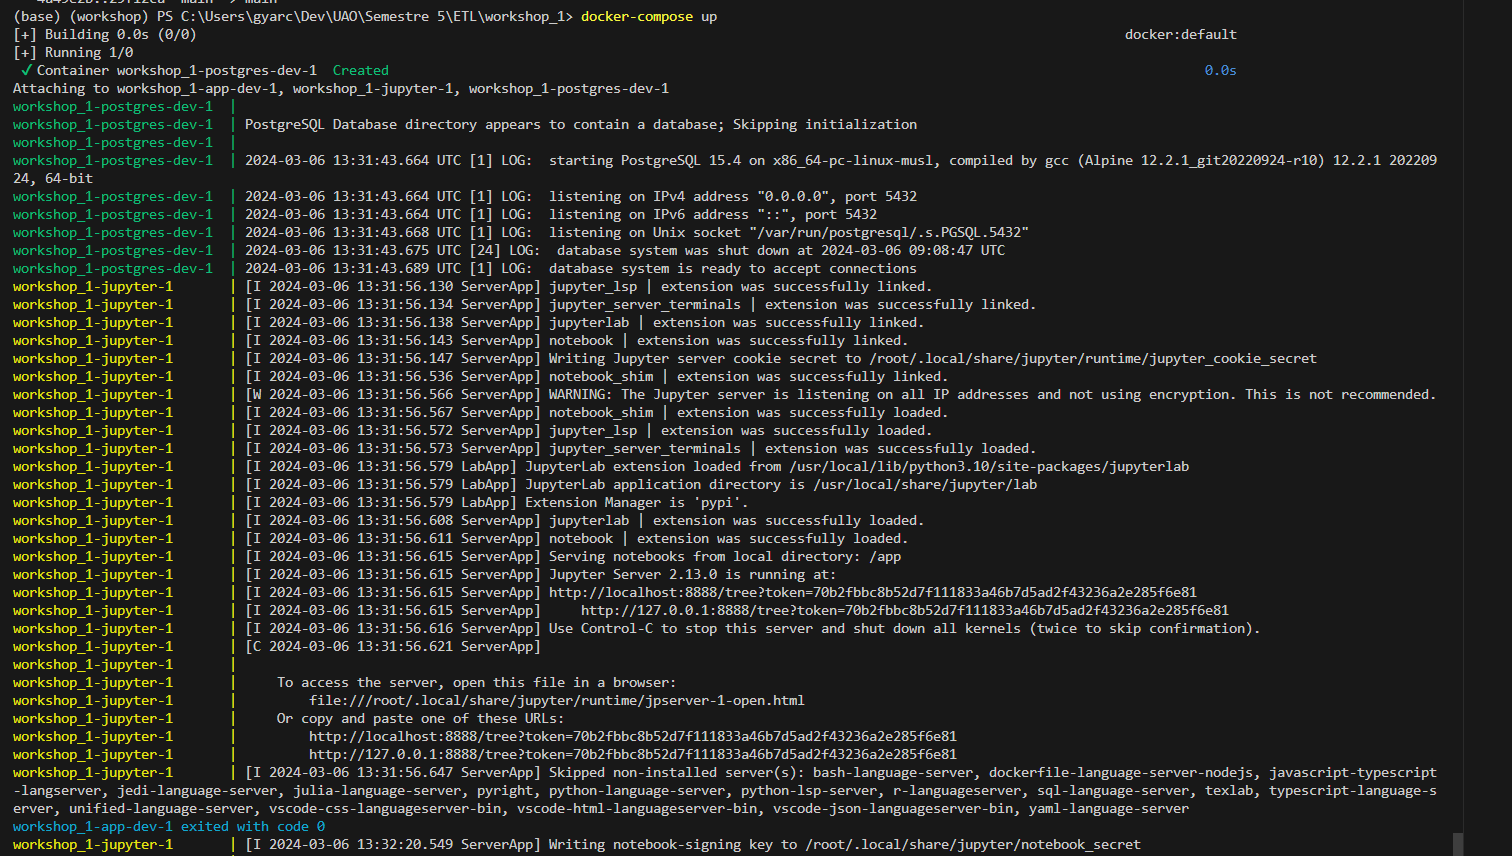
This project is using Docker to arquitecture the services required in order to run the EDA process, without the worry of the database.
- Update the file called
_template_env_localwith the correct values for the db credentials. IMPORTANT! As Docker will copy it and transform it into the container to be used. - Validate you have Docker running in your system and execute
docker-compose build docker-compose upThis will start the container running the script to load the data from thedata/candidates.csvand it will start jupyter-notebooks in the port8888.
We were tasked to evaluate the candidates dataset provided with 50.000 candidates with randomly generated data from 2018 to the 2022, in the process to read, clean and analyze the data in order to solve the given questions:
- Which years had the highest number of hires?
- How many individuals have been hired, categorized by targetted countries (Brazil, Colombia, Ecuador, USA)?
- How many individuals have been hired, categorized by technology?
- How many individuals have been hired, categorized by seniority level?
The idea is to design a base pipeline to answer these questions, providing all the backing to support our answers.


The architecture consists of three main services:
- postgres-dev: A PostGIS database server with health checks and persistent storage.
- app-dev: An application service that runs data loading scripts and depends on
postgres-dev.load_data.py: An small script to read the csv file and store it as is in the DB.
- jupyter: A Jupyter notebook service for interactive development, depending on
app-dev.EDA.ipynb: A notebook with the exploratory process, conclusions and storage of the cleaned dataset into a new table.
Networks
- All services are connected to the
devnetwork, enabling them to communicate with each other.
Volumes
pgdata-dev: Used bypostgres-devfor data persistence../app:/app: Shared volume betweenapp-devandjupyterfor application files.
Dependencies
app-devdepends on the health ofpostgres-dev.jupyterstarts afterapp-devis ready.- It exposes port
8888for notebook access.
This setup facilitates a development environment where database, application, and interactive exploration can work closely together.

Loading Raw Data: In our app-dev service we have defined a load_data script with the usage of SQLAlchemy providing the engine for the connection to our postgres-dev , then we proceed to clean the names of the columns so we don’t find any spaces and lowercase them so they’re ready to be stored using pandas passing the connection to the DB, we have explicitely told pandas to replace if the data is duplicated so out of the box we have that protection. Once the script is executed we close the de service due that it completed its purpose.

Notebook: In our EDA.ipynb file is where we have the meat and potatoes of the project, like the data has been stored in our DB, we reuse the connection created to insert the data, to read it as well with usage of pandas, so our data comes directly from our postgres-dev service. Inside our notebook we can find the next sections to document our process in a incremental way starting from the basic review of the data to store the transformed data into a new table to be used for the dashboard.
-
Initial review: We see the structure of our dataset along with the location metrics four numerical numbers.

-
Univariate Exploring: Here we evaluate our variables alone so we can see how they behave, this section has sub-sections reviewing the different types of our columns.
-
Numerical: We only review Years of Experience (yoe) due that from code_challenge_score and technical_interview_score we only care if both are above 7 in order to define is a candidate is hired.

-
Binary: Like we mention early we from code_challenge_score and technical_interview_score we only care if both are above 7 in order to define is a candidate is hired, this stores the values as true or false according to the condition.

-
Categorical: Most our columns care categorical values where we can found email, country, seniority, technology that had to be mapped into a new parent category to group the many sub-categories that this field had.
-
Years
 The year 2022 got (5642) the lower number of applications, while the 2020 got (11237) the year with most applications reported.
 -
Email
 There is a 0.3% of users with the same email sending multiple applications.
When watching for emails a couple of questions were raised about if these duplicated emails are duplicated entries or they’re different records.
-
Country (USA, Brazil, Colombia, and Ecuador)
 Even thought the number of applications are high, our target countries don't make it into the top ten with most applications. Colombia being short of 5 applications to make it.
 -
Seniority

-
Technology
 The seniority System Integration and Connectivity got (1973) the lower number of applications, while the Coding and Development got (13447) the seniority with most applications reported.
For this columns we originaly had 24 different technologies that could be grouped together to be more manageable.
-
-
-
Bivariate & Multivariate Exploring: After reviewing individually our attributes, there were a couple of questions raised that we can answer doing this exploring between multiple attributes.
-
Were the multiple applications from duplicate emails submitted within the same year or across different years?

-
Were the multiple applications from duplicate emails for the same technology?

-
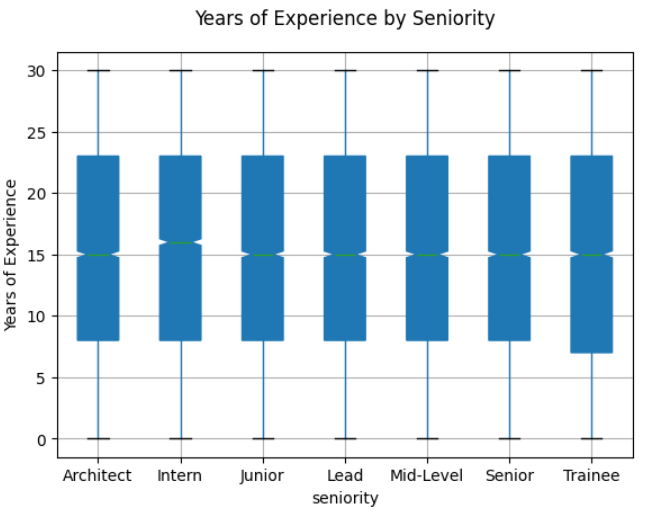
How is the distribution of years of experience across different seniority levels?

-
Which technologies are most applied for by country?

-
How many individuals have been hired, categorized by seniority level?

-
How many individuals have been hired, categorized by technology?

-
How many individuals have been hired, categorized by country?

-
Which years had the highest number of hires?

-


- Most of the data here is normalized, with no empty values and nulls.
- Even though we had emails duplicated, this never meant that the rows were duplicated, those were applications done on either different years or different technologies.
- We can see out of the gate that is random simulated data due that the in years of experience it follows the almost the same distribution for all seniorities, which does not make sense.
- As an exercise was fun to review the variables and try to raise questions that could generate valuable insights.
- Practical Statistics for Data Scientists: 50+ Essential Concepts Using R and Python - 2020: ISBN 149207294X
- Hands-On Machine Learning with Scikit-Learn, Keras, and TensorFlow: Concepts, Tools, and Techniques to Build Intelligent Systems 2nd Edición - 2019: ISBN 1492032646
- Choosing color palettes — seaborn 0.13.2 documentation (pydata.org)
- pandas.DataFrame.groupby — pandas 2.2.1 documentation (pydata.org)
- matplotlib.pyplot.bar — Matplotlib 3.8.3 documentation
- Controlling figure aesthetics — seaborn 0.13.2 documentation (pydata.org)
- Line Chart in Power BI [Complete Tutorial with 57 Examples] - SPGuides
- pandas.crosstab — pandas 2.2.1 documentation (pydata.org)

